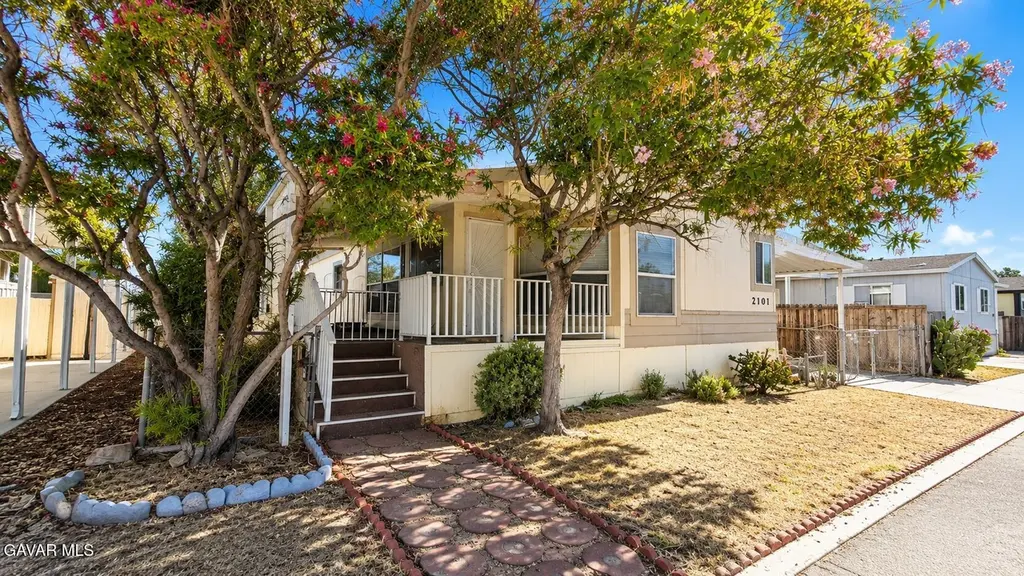
2101 Windflow Dr #56 · Rosamond, CA
Flood risk 6/10 · Moderate
- FEMA flood zone
- A
- Chance of flooding over 30 yrs
- 0.76%
- Est. flood insurance / yr
- $1,009 – $1,996
Fire risk 4/10 · Minor
- Est. fire insurance / yr
- $659 – $1,223
Heat risk 7/10 · Major
- Hot days now (above 101°F)
- 5 days/yr
- Hot days in 30 yrs
- 14 days/yr
Wind risk 1/10 · Minimal
- Chance of severe wind over 30 yrs
- —
Air-quality risk 8/10 · Major
- Unhealthy air days now
- 16 days/yr
- Unhealthy air days in 30 yrs
- 21 days/yr
Risk factors via First Street. Map © Google.
Why this score? — see what drove the B grade
The composite is a weighted blend of 9 inputs, each scored 0–100. Each bar is that input's sub-score; the figure is the points it added to the 100-point composite (weight × sub-score).
- Cash flow +30.0/30.0
- 1% rule +10.0/10.0
- DSCR +10.0/10.0
- ARV discount +7.5/15.0
- Appreciation +6.2/10.0
- Condition / age +2.8/5.0
- Rent growth +2.5/5.0
- Livability +2.5/5.0
- Schools +2.2/10.0
$70,000
🖨 Deal sheet 📄 Offer letter ✓ Due diligence
Listing remarks
Great opportunity to own this spacious 1,512 sq. ft. 3-bedroom, 2-bathroom home located in the well-maintained Tradewinds Mobile Estates community. This home features a large kitchen, formal dining area, spacious bedrooms, and an indoor laundry room, all offered at a fraction of the cost of similar homes in the area. With a little work, updating, and personal touch, this home has the potential to truly shine and offers an excellent opportunity for buyers looking to add their own style and value. Conveniently located close to the 14 Freeway, shopping, restaurants, and everyday neighborhood amenities, this property combines location and outstanding potential.
Key facts
- Community pool
- Built 1986
- Listed 9 days
Property features AI
Finance
- Other: APN 473-171-71
- HOA & community: Park name: Tradewinds; New space rent $819; Deposit $5,000; Park manager: Albert Gatton (661-256-4890); All ages allowed
Exterior
- Utilities: Natural gas
- Home design: Mobile home (located in a managed park, space #56); Porch
- Construction: Composition shingle roof; Manufactured 2004 (date of manufacture 2004-12-31); Skirted
- Exterior features: Chain link and wood fencing; Community recreation area, clubhouse/rec room, and pool (mobile home park amenities)
Interior
- Kitchen: Dishwasher
- Bathrooms: 2 full bathrooms
- Heating & cooling: Central air; Central gas heating
- Interior features: Dishwasher; Porch
Neighborhood map
What this means for you Summary
Snapshot
- This is a 3-bed/2.0-bath manufactured listed at $70k. Condition is rated average.
Deal economics
- At list price, monthly cash flow is $1k ($18k/yr) — positive.
- The deal already cash-flows at list — no discount required.
- Meets the 1% rule at list price ($3k rent vs $70k).
- Cap rate 33.5% vs local median 4.3% in Rosamond — top-decile yield for the area; either an underpriced asset or a hidden risk that comps aren't pricing in. Stress-test before assuming the spread holds.
Location & tenants
- Location reads 49/100 on livability (#1,178 in CA) — a working-class tenant base; expect higher turnover. Strengths: housing A+; Watch: schools F, crime F, amenities F.
- Southern Kern Unified (town): math 25% / reading 25% proficiency, ranked #387 of 517 in CA (top 75%) — low school quality limits family demand, transient renter base, plan for 1-2y turnover; 67% free/reduced lunch — lower-income household profile, screen leases tightly.
- Market conditions: 458 active listings in the ZIP; 14 comparable units currently listed for rent nearby; rentals at typical pace (median 19d on market — plan ~3-4 weeks tenant-placement turnaround); solid renter incomes; 3,244 units permitted in Kern County in 2024 (73 in 5+ unit buildings).
- This rent runs 41% of the median local income ($77k/yr) — at the standard rent-burdened threshold; future hikes will face affordability resistance.
Forward outlook
- In year one you build about $2k of equity ($484 loan paydown + $2k appreciation (2.4% local appreciation)).
- Kern County population projected at +17% by 2050 — long-run rental-demand tailwind backs the buy-and-hold thesis.
- At projected returns (2.4% appreciation + 3.0% rent growth), your $20k cash investment doubles in ~1 year — after that, you're playing with house money.
Negotiation context
- Only 9 days on market — expect competitive offers; lowballing is unlikely to land.
Risks & watch-outs
- Watch-outs: flood insurance adds $125/mo.
- Climate carrying-cost: in FEMA flood zone A (mandatory federal flood insurance); extreme-heat days projected 5→14/yr by 2055 (HVAC capex compounding) — expect insurance premiums to compound above CPI over the hold.
Questions for the listing agent
- What's the actual annual flood-insurance premium (NFIP or private), and is the property in a SFHA with mandatory coverage?
- Is there a deadline driving the sale (1031 exchange, divorce, estate, relocation)? That informs how much negotiation room exists.
- Schools are F-rated, which usually means shorter tenancies and higher turnover. Who's the typical renter profile here, and what's been the actual vacancy rate?
- Crime grade is F in this area — have there been break-ins, vandalism, or insurance claims at this property in the last 3 years? What carrier currently insures it and at what premium?
- What's the average days-on-market for RENTAL listings here right now (not sales)? A rising rental-DOM trend means longer vacancies and softer asking-rent achievability than the comps imply.
- What's the recent tenant-quality profile in this submarket — average credit score on applications, eviction rate, late-payment / NSF rate, and stable-employment percentage? A property-management company in the area should have these aggregated.
- How much new for-sale + rental construction is in the pipeline within 1–3 miles? Heavy new supply typically softens prices + rents 12–24 months out; constrained supply supports both.
Investment metrics
- 1% rule
- 3.74% ✓
- Cap rate
- 33.47%
- Cash-on-cash
- 97.05%
- DSCR
- 5.32
- GRM
- 2.2
CMA / ARV
- ARV (on-the-fly)
- $140,616
- Comps found
- 12
Show comp detail 12 sales within ~0.75 mi
| Address | Dist | Beds/Ba | Sqft | Sold | Price | $/sf | Match |
|---|---|---|---|---|---|---|---|
| 2016 Windcurrent Dr #143 | 0.04mi | 3/2.0 | 1,512 (0%) | 14mo | $151,500 | $100 | 87 |
| 2021 Windharp #30 | 0.12mi | 4/2.0 (+1) | 1,536 (+2%) | 1mo | $108,000 | $70 | 86 |
| 2013 Sonja Dr #73 | 0.28mi | 3/2.0 | 1,488 (-2%) | 12mo | $142,500 | $96 | 74 |
| 1550 20th St W #70 | 0.34mi | 3/2.0 | 1,492 (-1%) | 10mo | $120,000 | $80 | 73 |
| 2000 Windcurrent Dr #147 | 0.05mi | 3/2.0 | 1,344 (-11%) | 8mo | $125,000 | $93 | 73 |
| 2104 Windbreak Drive #18 #18 | 0.14mi | 3/2.0 | 1,344 (-11%) | 5mo | $110,000 | $82 | 71 |
| 2116 Windflow Drive #66 #66 | 0.07mi | 3/2.0 | 1,344 (-11%) | 9mo | $98,950 | $74 | 70 |
| 1550 W 20th St #18 | 0.34mi | 3/2.0 | 1,600 (+6%) | 5mo | $160,000 | $100 | 70 |
| 1550 20th W | 0.35mi | 3/2.0 | 1,600 (+6%) | 5mo | $175,000 | $109 | 70 |
| 1550 W 20th St Spc 67 | 0.34mi | 3/2.0 | 1,440 (-5%) | 10mo | $130,000 | $90 | 68 |
| 1550 20th St W #97 | 0.34mi | 3/2.0 | 1,600 (+6%) | 12mo | $162,000 | $101 | 65 |
| 2024 Colleen Dr #52 | 0.26mi | 3/2.0 | 1,680 (+11%) | 11mo | $150,000 | $89 | 60 |
Match score weights: distance 35% · size 25% · config 20% · recency 20%. Top-matched comps best support the ARV.
Projected returns pro-forma
2.4% appreciation · 3.0% rent growth · sell at horizon
- IRR
- 93.3%
- Equity multiple
- 6.07×
- Total profit
- $99,354
- Equity at exit
- $29,157
- IRR
- 93.3%
- Equity multiple
- 12.55×
- Total profit
- $226,325
- Equity at exit
- $43,209
Cash invested: $19,600 (down + closing). Projections, not guarantees.
Landlord ↔ Tenant lean methodology
- Overall (STATE)
- 18 Strongly Tenant-Friendly
- State California
- 18 Strongly Tenant-Friendly · D+13
- County
- — inherits STATE
- City
- — inherits STATE
ZIP-level market 93560
- Home prices YoY
- 0.6%
- Active inventory
- 458
- Price-to-rent
- 2.2×
Monthly cashflow live
- Estimated rent
- $2,619 high interval (Pro) →
- Mortgage (P&I)
- −$367
- Tax est. 1.5%
- −$88 /mo · $1,050/yr
- Insurance
- −$29
- Flood insurance flood zone
- −$125 /mo · $1,502/yr
- HOA
- −$0
- Vacancy / Maint / Mgmt
- −$550
- Net cashflow
- $1,460
Break-even live
UW: 25.0% down · 7.5% · 30yr · 1.5% tax · 5.0% vac · 8.0% maint · 8.0% mgmt
Financing live
Cash to close
- Down payment
- $17,500
- Closing costs
- $2,100
- Reserves months
- —
- Total cash needed
- —
Loan-product check · same deal, 3 products live
Conventional
25% down · 7.5% · 30yr
- Down + closing
- —
- Monthly P&I
- —
- Monthly cashflow
- —
- DSCR
- —
- Eligible?
- —
Personal DTI + credit; lowest rate.
DSCR
20% down · 8.5% · 30yr
- Down + closing
- —
- Monthly P&I
- —
- Monthly cashflow
- —
- DSCR
- —
- Eligible?
- —
No personal income docs; deal must DSCR.
Hard money
10% down · 12.0% · 12mo
- Down + closing
- —
- Monthly P&I
- —
- Monthly cashflow
- —
- DSCR
- —
- Eligible?
- —
Short-term bridge; refi at stabilization.
Rent comps 14 comps
| Address | Beds | Baths | Sqft | Rent | $/sqft | DOM | Units | Dist |
|---|---|---|---|---|---|---|---|---|
| 1943 Pengilley Ave Rosamond, CA | 3.0 | 2.0 | 1379 | $2,600 | $1.89 | 1d | 1 | 0.17mi |
| 1953 Marie Ave Apt A Rosamond, CA | 4.0 | 3.0 | 1753 | $2,550 | $1.45 | 43d | 1 | 0.24mi |
| 1953 Marie Ave Apt A Rosamond, CA | 4.0 | 3.0 | 1753 | $2,550 | $1.45 | 3d | 1 | 0.24mi |
| 2051 Candice Ave Rosamond, CA | 3.0 | 2.0 | 1345 | $2,395 | $1.78 | 15d | 1 | 0.60mi |
| 1838 Center St Unit A Rosamond, CA | 3.0 | 2.5 | 1475 | $2,000 | $1.36 | 10d | 1 | 0.89mi |
| 1838 Center St Unit A Rosamond, CA | 3.0 | 2.5 | 1495 | $2,000 | $1.34 | 1d | 1 | 0.89mi |
| 3017 Via Bella Rosa Ave Rosamond, CA | 4.0 | 2.0 | 1820 | $2,800 | $1.54 | 43d | 1 | 1.06mi |
| 2910 B St Rosamond, CA | 2.0 | 1.5 | 1775 | $1,542 | $0.87 | 19d | 1 | 1.10mi |
| 3124 Via Bella Rosa Ave Rosamond, CA | 4.0 | 2.0 | 1809 | $3,200 | $1.77 | 43d | 1 | 1.16mi |
| 3172 Shelley St Rosamond, CA | 4.0 | 2.0 | 1192 | $2,300 | $1.93 | 22d | 1 | 1.37mi |
| 3356 Firebush Ave Rosamond, CA | 4.0 | 2.0 | 1612 | $2,550 | $1.58 | 20d | 1 | 1.37mi |
| 2516 Starbrite Ave Rosamond, CA | 3.0 | 2.0 | 1542 | $2,900 | $1.88 | 1d | 1 | 1.41mi |
| 2608 Starbrite Ave Rosamond, CA | 4.0 | 2.0 | 1542 | $2,795 | $1.81 | 1d | 1 | 1.43mi |
| 3424 Brabham Ave Rosamond, CA | 3.0 | 2.0 | 1364 | $2,150 | $1.58 | 43d | 1 | 1.45mi |
Listing history 6 events
-
2026-06-04status $70,000 Pending 9 DOM
-
2026-06-03days on market $70,000 Active 9 DOM
-
2026-06-02days on market $70,000 Active 8 DOM
-
2026-06-01days on market $70,000 Active 7 DOM
-
2026-05-31days on market $70,000 Active 6 DOM
-
2026-05-25$70,000 Active
ⓘ Source: listings_history table (triggers on properties + properties_extension) + one-shot
backfill from property_details.listing_events for pre-trigger history.
Climate risk First Street
- Flood 6/10 Major FEMA zone A · 76% chance over 30 yrs
- Wildfire 4/10 Moderate
- Heat 7/10 Severe 5 d/yr ≥101°F today · 14 d/yr by 30 yrs out
- Wind 1/10 Low
- Air quality 8/10 Severe 16 unhealthy d/yr today · 21 by 30 yrs out
Nearby sold comps map
Loading sold comps map…
Walkable amenities ~0.75 mi
Loading nearby amenities…
Taxation est. · year 1
- Rental income
- $31,426
- − Mortgage interest
- −$3,921
- − Property taxes
- −$1,050
- − Insurance
- −$1,852
- − Repairs & maintenance
- −$2,514
- − Management
- −$2,514
- − Depreciation
- −$2,036
- Taxable income
- $17,538
- Est. tax owed @ 24.0%
- −$4,209
- After-tax cash flow
- $13,310/yr
For passive investors: Depreciation is non-cash, so a rental often shows a tax loss while cash-flowing — sheltering income. Rental losses are passive: they offset passive income freely, and up to $25,000/yr can offset ordinary (W-2) income if you actively participate and your MAGI is under $100k (phasing out to $0 by $150k); unused losses carry forward. On sale, claimed depreciation is recaptured at up to 25%, and gains may owe capital-gains tax (a 1031 exchange can defer both). Figures are a year-1 estimate at your 24.0% rate — not tax advice; consult a CPA.
Condition & rehab AI · 13 photos
This 3-bedroom, 2-bathroom home in Tradewinds Mobile Estates requires moderate updates to enhance its curb appeal and interior aesthetics, increasing its resale and rental value.
Repairs flagged
- Minor paint — some discoloration on interior walls
- Minor landscaping — simple landscaping, some wear
Value-add opportunities
- Both paint interior and exterior — enhances curb appeal and interior aesthetics
- Both landscaping — enhances curb appeal and adds value
- Both update bathrooms — modernizes and adds value
- Both update kitchen cabinets — modernizes and adds value
Renovation cost estimate screening
| Repair item | Severity | Est. cost |
|---|---|---|
| paint · some discoloration on interior walls | Minor | $500–3,000 |
| landscaping · simple landscaping, some wear | Minor | $500–3,000 |
| Total estimated repair cost · 2 items | $1,000–6,000 |
Value-add ROI direction
- Both paint interior and exterior — enhances curb appeal and interior aesthetics ↑
- Both landscaping — enhances curb appeal and adds value ↑
- Both update bathrooms — modernizes and adds value ↑
- Both update kitchen cabinets — modernizes and adds value ↑
ⓘ Cost ranges are severity-bucket heuristics (US national rule-of-thumb). Get contractor quotes + a written scope before underwriting a rehab budget.
Schools (NCES district)
- District
- Southern Kern Unified
- NCES district ID
- 0637620
- Math proficiency
- 25% ▲ 7.00%
- Reading proficiency
- 25% ▼ -8.00%
- Median HH income
- $54,523
- Composite
- 22.5/100
- National rank
- #8093
- State rank
- #387 of 517 in CA
Livability — Rosamond
- Score
- 49/100
- State rank
- #1178
- US rank
- #25952
Category grades
Schools grade is shown separately in the Schools card above.
Census & demographics
- Census place
- Rosamond, CA
- County
- Kern County · 710,371 people
- City population
- 22,119
- Metro
- Bakersfield, CA
- Population (ZIP)
- 22,119
- Household income
- $77,431
- Rent vs Own
- Severe rent burden
- 425.0
Population outlook (Kern County) Hauer SSP2
- Today (2025)
- 947,286 people
- By 2030
- 978,984 · +3.3%
- By 2040
- 1,045,018 · +10.3%
- By 2050
- 1,105,232 · +16.7%
- By 2075
- 1,229,538 · +29.8%
- By 2100
- 1,238,059 · +30.7%
Race, ethnicity, and origin ACS 2023
- Neighborhood character
- Diverse neighborhood (Simpson 0.68)
- Race & ethnicity
- Hispanic / Latino 45% White 32% Two or more races 17% Black 13% Asian 3% Native American 1%
- Hispanic origin (detail)
- Mexican 35%
- Common ancestry
- Portuguese 2% Italian 2% Lithuanian 1%
- Foreign-born
- 13% · Canada
- Languages at home
- 68% English-only · Spanish 28% Other Indo-European 2% Other Asian/Pacific 1%
Political lean MEDSL · Kern
- 2024 margin
- Strong R (+21.1) · D 38.2% · R 59.3% · Other 2.5%
- 2008→2024 swing
- -3.3pp toward R · 2008: -17.8pp · 2024: -21.1pp
- All cycles
- 2024: R+21.1 2020: R+10.2 2016: R+15.0 2012: R+20.9 2008: R+17.8
Not yet ingested
- Civics
- —
Market trends
- HPI YoY
- ▲ 2.40%
- Current HPI
- 403.7206
- Rent YoY
- —
- Metro
- Bakersfield, CA
- State GDP YoY
- ▲ 3.21%
- F500 in state
- 116
Industry mix (Fortune 500 HQ in CA)
| Industry | F500 HQs | Revenue |
|---|---|---|
| Technology | 27 | $1,492B |
|
||
| Financial Services | 3 | $174B |
|
||
| Retail | 3 | $44B |
|
||
| Insurance | 3 | $26B |
|
||
| Media / Entertainment | 2 | $115B |
|
||
| Pharmaceuticals / Biotech | 2 | $62B |
|
||
Price history
1 event — show timeline
- 2026-05-25 Listed $70,000 AVMLS
Cash-flow waterfall
monthlySold comps — $/sqft
last 12 mo · ≤1 miLoading sold comps…