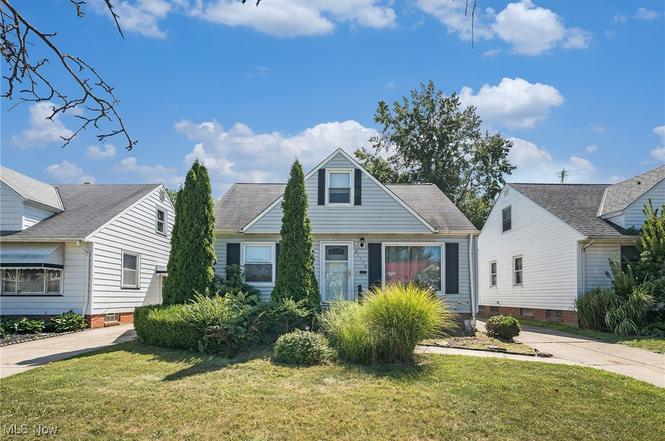
21170 Wilmore Ave · Euclid, OH
Flood risk 1/10 · Minimal
- FEMA flood zone
- X (unshaded)
- Chance of flooding over 30 yrs
- 0.0%
- Est. flood insurance / yr
- $473 – $860
Fire risk 1/10 · Minimal
- Est. fire insurance / yr
- $713 – $1,323
Heat risk 3/10 · Minor
- Hot days now (above 94°F)
- 7 days/yr
- Hot days in 30 yrs
- 17 days/yr
Wind risk 1/10 · Minimal
- Chance of severe wind over 30 yrs
- —
Air-quality risk 3/10 · Minor
- Unhealthy air days now
- 3 days/yr
- Unhealthy air days in 30 yrs
- 4 days/yr
Risk factors via First Street. Map © Google.
Why this score? — see what drove the B- grade
The composite is a weighted blend of 9 inputs, each scored 0–100. Each bar is that input's sub-score; the figure is the points it added to the 100-point composite (weight × sub-score).
- Cash flow +26.1/30.0
- ARV discount +14.8/15.0
- DSCR +8.8/10.0
- 1% rule +7.4/10.0
- Livability +3.9/5.0
- Rent growth +3.8/5.0
- Condition / age +2.5/5.0
- Schools +1.7/10.0
- Appreciation +0.0/10.0
$105,000
🖨 Deal sheet 📄 Offer letter ✓ Due diligence
Listing remarks
This spacious home offers plenty of potential for the right buyer! Featuring 3 bedrooms and 2 baths, the property is in need of some TLC and updates, making it a great opportunity to customize and add value. With solid bones and a functional layout, this home is ready for your personal touch or vision as an investment project. The property is being sold AS-IS, with the buyer responsible for all inspections and repairs. Don't miss the chance to make it your own!?
Key facts
- 4,356 sq ft lot
- Garage
- Built 1955
Neighborhood map
What this means for you Summary
Snapshot
- This is a 3-bed/1.0-bath single-family listed at $105k.
Deal economics
- At list price, monthly cash flow is $263 ($3k/yr) — positive.
- The deal already cash-flows at list — no discount required.
- Meets the 1% rule at list price ($1k rent vs $105k).
- Cap rate 9.3% vs local median 6.8% in Euclid — top-decile yield for the area; either an underpriced asset or a hidden risk that comps aren't pricing in. Stress-test before assuming the spread holds.
Location & tenants
- Location reads 77/100 on livability (#204 in OH, #3,149 nationally) — a middle-class / working-renter tenant base. Strengths: cost of living A+, housing A+, crime B+; Watch: schools C-, commute F, employment D-.
- Euclid City (suburban): math 14% / reading 28% proficiency, ranked #625 of 656 in OH (top 95%) — low school quality limits family demand, transient renter base, plan for 1-2y turnover; 70% free/reduced lunch — lower-income household profile, screen leases tightly.
- Market conditions: Rents rising fast (+5.3%/yr); 93 active listings in the ZIP; 23 comparable units currently listed for rent nearby; rentals at typical pace (median 21d on market — plan ~3-4 weeks tenant-placement turnaround); 1,441 units permitted in Cuyahoga County in 2024 (700 in 5+ unit buildings).
Forward outlook
- Local home prices are declining (-3.0%/yr); year-one equity from $726 of loan paydown is wiped out by about $3k of value loss. Plan a longer hold.
- Cuyahoga County population projected to shrink 8% by 2050 — rents likely to lag national; underwrite the cash flow, not the appreciation.
- At projected returns (-3.0% appreciation + 5.3% rent growth), your $29k cash investment doubles in ~9 years — after that, you're playing with house money.
Negotiation context
- Only 5 days on market — expect competitive offers; lowballing is unlikely to land.
- Current owner paid $44k; list at $105k implies a 139% gain — meaningful room to come down on a strong offer.
Risks & watch-outs
- Watch-outs: built in 1955 — expect roof / HVAC / electrical / plumbing capex.
Questions for the listing agent
- Built in 1955 — when were the roof, HVAC, electrical panel, plumbing, and water heater last replaced?
- Is there a deadline driving the sale (1031 exchange, divorce, estate, relocation)? That informs how much negotiation room exists.
- What's the average days-on-market for RENTAL listings here right now (not sales)? A rising rental-DOM trend means longer vacancies and softer asking-rent achievability than the comps imply.
- What's the recent tenant-quality profile in this submarket — average credit score on applications, eviction rate, late-payment / NSF rate, and stable-employment percentage? A property-management company in the area should have these aggregated.
- How much new for-sale + rental construction is in the pipeline within 1–3 miles? Heavy new supply typically softens prices + rents 12–24 months out; constrained supply supports both.
Investment metrics
- 1% rule
- 1.24% ✓
- Cap rate
- 9.30%
- Cash-on-cash
- 10.75%
- DSCR
- 1.48
- GRM
- 6.7
CMA / ARV
- ARV (on-the-fly)
- $125,184
- Comps found
- 12
Show comp detail 12 sales within ~0.75 mi
| Address | Dist | Beds/Ba | Sqft | Sold | Price | $/sf | Match |
|---|---|---|---|---|---|---|---|
| 21250 Wilmore Ave | 0.02mi | 3/1.0 | 978 (0%) | 0mo | $59,400 | $61 | 99 |
| 21170 Wilmore Ave | 0.00mi | 3/2.0 | 978 (0%) | 0mo | $107,100 | $110 | 96 |
| 20671 Wilmore Ave | 0.19mi | 3/1.0 | 1,053 (+8%) | 4mo | $120,000 | $114 | 75 |
| 20770 Morris Ave | 0.16mi | 3/1.0 | 1,081 (+10%) | 1mo | $155,000 | $143 | 74 |
| 21771 Ball Ave | 0.22mi | 3/1.0 | 1,093 (+12%) | 0mo | $140,000 | $128 | 70 |
| 20591 Ball Ave | 0.26mi | 3/1.0 | 858 (-12%) | 2mo | $109,600 | $128 | 66 |
| 20500 Morris Ave | 0.26mi | 3/1.0 | 1,104 (+13%) | 3mo | $134,000 | $121 | 64 |
| 21971 Crystal Ave | 0.37mi | 2/1.0 (-1) | 832 (-15%) | 2mo | $105,000 | $126 | 51 |
| 19344 Pasnow Ave | 0.67mi | 3/2.0 | 1,067 (+9%) | 2mo | $91,000 | $85 | 48 |
| 22000 Kennison Ave | 0.62mi | 3/1.5 | 1,100 (+12%) | 1mo | $180,000 | $164 | 48 |
| 22670 Arms Ave | 0.54mi | 3/2.0 | 1,100 (+12%) | 3mo | $148,000 | $135 | 47 |
| 19070 Meredith Ave | 0.73mi | 2/1.5 (-1) | 1,062 (+9%) | 1mo | $145,000 | $137 | 44 |
Match score weights: distance 35% · size 25% · config 20% · recency 20%. Top-matched comps best support the ARV.
Projected returns pro-forma
-3.0% appreciation · 5.28% rent growth · sell at horizon
- IRR
- 2.5%
- Equity multiple
- 1.10×
- Total profit
- $2,872
- Equity at exit
- $15,656
- IRR
- 14.3%
- Equity multiple
- 2.27×
- Total profit
- $37,469
- Equity at exit
- $9,078
Cash invested: $29,400 (down + closing). Projections, not guarantees.
Landlord ↔ Tenant lean methodology
- Overall (STATE)
- 73 Landlord-Friendly
- State Ohio
- 73 Landlord-Friendly · R+6
- County
- — inherits STATE
- City
- — inherits STATE
ZIP-level market 44123
- Home prices YoY
- -25.0%
- Rents YoY
- 5.3%
- Active inventory
- 93
- Price-to-rent
- 6.7×
Monthly cashflow live
- Estimated rent
- $1,307 high interval (Pro) →
- Mortgage (P&I)
- −$551
- Tax from tax record
- −$174 /mo · $2,093/yr
- Insurance
- −$44
- HOA
- −$0
- Vacancy / Maint / Mgmt
- −$274
- Net cashflow
- $263
Break-even live
UW: 25.0% down · 7.5% · 30yr · 1.5% tax · 5.0% vac · 8.0% maint · 8.0% mgmt
Financing live
Cash to close
- Down payment
- $26,250
- Closing costs
- $3,150
- Reserves months
- —
- Total cash needed
- —
Loan-product check · same deal, 3 products live
Conventional
25% down · 7.5% · 30yr
- Down + closing
- —
- Monthly P&I
- —
- Monthly cashflow
- —
- DSCR
- —
- Eligible?
- —
Personal DTI + credit; lowest rate.
DSCR
20% down · 8.5% · 30yr
- Down + closing
- —
- Monthly P&I
- —
- Monthly cashflow
- —
- DSCR
- —
- Eligible?
- —
No personal income docs; deal must DSCR.
Hard money
10% down · 12.0% · 12mo
- Down + closing
- —
- Monthly P&I
- —
- Monthly cashflow
- —
- DSCR
- —
- Eligible?
- —
Short-term bridge; refi at stabilization.
Rent comps 23 comps
| Address | Beds | Baths | Sqft | Rent | $/sqft | DOM | Units | Dist |
|---|---|---|---|---|---|---|---|---|
| 20990 Morris Ave Euclid, OH | 3.0 | 1.0 | 778 | $1,355 | $1.74 | 43d | 1 | 0.09mi |
| 21301 Arbor Ave Euclid, OH | 3.0 | 1.0 | 1050 | $1,450 | $1.38 | 19d | 1 | 0.20mi |
| 20500 Morris Ave Euclid, OH | 3.0 | 1.0 | 1104 | $1,399 | $1.27 | 43d | 1 | 0.27mi |
| 455 E 200th St Cleveland, OH | 2.0 | 1.0 | 950 | $1,150 | $1.21 | 23d | 1 | 0.43mi |
| 22501 Arms Ave Euclid, OH | 3.0 | 1.0 | 1044 | $1,350 | $1.29 | 23d | 1 | 0.45mi |
| 404 E 200th St Cleveland, OH | 2.0 | 1.0 | 884 | $1,095 | $1.24 | 43d | 1 | 0.45mi |
| 20231 Crystal Ave Euclid, OH | 2.0 | 1.0 | 833 | $799 | $0.96 | 16d | 1 | 0.47mi |
| 488 E 222nd St Unit Up Euclid, OH | 2.0 | 1.0 | 900 | $1,100 | $1.22 | 21d | 1 | 0.49mi |
| 521 E 222nd St Euclid, OH | 2.0 | 1.0 | 800 | $1,500 | $1.88 | 23d | 1 | 0.49mi |
| 20664 Miller Ave Unit Down Unit Euclid, OH | 3.0 | 2.0 | 1100 | $1,200 | $1.09 | 43d | 1 | 0.50mi |
| 927 E 216th St Unit 1 Euclid, OH | 2.0 | 1.0 | 850 | $1,147 | $1.35 | 4d | 1 | 0.54mi |
| 961 E 224th St Euclid, OH | 3.0 | 1.0 | 1034 | $1,300 | $1.26 | 16d | 1 | 0.56mi |
| 871 E 212th St Cleveland, OH | 3.0 | 1.5 | 1092 | $1,399 | $1.28 | 43d | 1 | 0.59mi |
| 415 E 222nd St Unit 461-23 Euclid, OH | 2.0 | 1.0 | 700 | $875 | $1.25 | 43d | 1 | 0.67mi |
| 824 E 236th St Euclid, OH | 3.0 | 2.0 | 1100 | $1,720 | $1.56 | 1d | 1 | 0.67mi |
| 19430 Monterey Ave Cleveland, OH | 3.0 | 1.5 | 898 | $1,236 | $1.38 | 21d | 1 | 0.68mi |
| 19205 Pasnow Ave Euclid, OH | 3.0 | 1.0 | 698 | $1,575 | $2.26 | 2d | 1 | 0.69mi |
| 4 Gateway Dr Euclid, OH | 2.0 | 1.0–2.0 | 650 | $1,150 | $1.77 | 7d | 5 | 0.77mi |
| 24200 Puritan Rd Euclid, OH | 3.0 | 1.0 | 1100 | $1,199 | $1.09 | 12d | 1 | 1.15mi |
| 1517 E 256th St Euclid, OH | 3.0 | 1.0 | 1002 | $1,300 | $1.30 | 23d | 1 | 1.45mi |
| 1550 E 256th St Euclid, OH | 3.0 | 1.0 | 1054 | $1,700 | $1.61 | 1d | 1 | 1.46mi |
| 1554 E 256th St Euclid, OH | 2.0 | 2.0 | 1062 | $1,250 | $1.18 | 23d | 1 | 1.46mi |
| 24630 Euclid Ave Euclid, OH | 2.0 | 1.0 | 750 | $1,100 | $1.47 | 10d | 1 | 1.50mi |
Listing history 3 events
-
2025-09-02status Pending
-
2025-08-26$105,000 Active
-
1977-06-01soldstatus $44,000
ⓘ Source: listings_history table (triggers on properties + properties_extension) + one-shot
backfill from property_details.listing_events for pre-trigger history.
Tax reassessment forecast OH · Partial reset (capped growth)
- Current annual tax
- $2,093 · $174/mo
- Projected year-2 tax
- $2,093 · $174/mo
- Expected delta
- $0/yr ($0/mo · 0.0%)
ⓘ Screening estimate from a state-policy table — verify with the county assessor before closing.
Climate risk First Street
- Flood 1/10 Low FEMA zone X (unshaded) · 0% chance over 30 yrs
- Wildfire 1/10 Low
- Heat 3/10 Moderate 7 d/yr ≥94°F today · 17 d/yr by 30 yrs out
- Wind 1/10 Low
- Air quality 3/10 Moderate 3 unhealthy d/yr today · 4 by 30 yrs out
Nearby sold comps map
Loading sold comps map…
Walkable amenities ~0.75 mi
Loading nearby amenities…
Taxation est. · year 1
- Rental income
- $15,679
- − Mortgage interest
- −$5,882
- − Property taxes
- −$2,093
- − Insurance
- −$525
- − Repairs & maintenance
- −$1,254
- − Management
- −$1,254
- − Depreciation
- −$3,055
- Taxable income
- $1,616
- Est. tax owed @ 24.0%
- −$388
- After-tax cash flow
- $2,773/yr
For passive investors: Depreciation is non-cash, so a rental often shows a tax loss while cash-flowing — sheltering income. Rental losses are passive: they offset passive income freely, and up to $25,000/yr can offset ordinary (W-2) income if you actively participate and your MAGI is under $100k (phasing out to $0 by $150k); unused losses carry forward. On sale, claimed depreciation is recaptured at up to 25%, and gains may owe capital-gains tax (a 1031 exchange can defer both). Figures are a year-1 estimate at your 24.0% rate — not tax advice; consult a CPA.
Schools (NCES district)
- District
- Euclid City
- NCES district ID
- 3904395
- Math proficiency
- 14% ▼ -19.00%
- Reading proficiency
- 28% ▼ -14.00%
- Median HH income
- $36,385
- Composite
- 17.39/100
- National rank
- #9067
- State rank
- #625 of 656 in OH
Livability — Euclid
- Score
- 77/100
- State rank
- #204
- US rank
- #3149
Category grades
Schools grade is shown separately in the Schools card above.
Census & demographics
- Census place
- Euclid, OH
- County
- Cuyahoga County · 1,090,369 people
- City population
- 41,855
- Metro
- Cleveland-Elyria, OH
- Population (ZIP)
- 18,050
- Household income
- $55,676
- Rent vs Own
- Severe rent burden
- 1085.0
Population outlook (Cuyahoga County) Hauer SSP2
- Today (2025)
- 1,244,621 people
- By 2030
- 1,230,093 · -1.2%
- By 2040
- 1,189,108 · -4.5%
- By 2050
- 1,145,706 · -7.9%
- By 2075
- 1,076,557 · -13.5%
- By 2100
- 978,987 · -21.3%
Race, ethnicity, and origin ACS 2023
- Neighborhood character
- Majority Black (65%)
- Race & ethnicity
- Black 65% White 28% Two or more races 6% Hispanic / Latino 1%
- Common ancestry
- Romanian 5%
- Foreign-born
- 2% · Canada
- Languages at home
- 96% English-only · Spanish 2% Chinese 1%
Political lean MEDSL · Cuyahoga
- 2024 margin
- Solid D (+31.5) · D 65.4% · R 33.9%
- 2008→2024 swing
- -7.4pp toward R · 2008: 38.9pp · 2024: 31.5pp
- All cycles
- 2024: D+31.5 2020: D+34.1 2016: D+35.0 2012: D+38.7 2008: D+38.9
Not yet ingested
- Civics
- —
Market trends
- HPI YoY
- ▼ -62.82%
- Current HPI
- 188.4932
- Rent YoY
- ▲ 5.28%
- Metro
- Cleveland-Elyria, OH
- State GDP YoY
- ▲ 1.98%
- F500 in state
- 48
Industry mix (Fortune 500 HQ in OH)
| Industry | F500 HQs | Revenue |
|---|---|---|
| Insurance | 3 | $145B |
|
||
| Industrial Machinery | 3 | $49B |
|
||
| Financial Services | 3 | $24B |
|
||
| Consumer Goods | 2 | $93B |
|
||
| Aerospace / Defense | 2 | $47B |
|
||
| Utilities | 2 | $33B |
|
||
Price history
+138.6% since first listed3 events — show timeline
- 2025-09-02 Pending — MLSNOW
- 2025-08-26 Listed $105,000 MLSNOW
- 1977-06-01 Sold (Public Records) $44,000 Public Records
Property tax history
+10.3%/yrLatest (2025): $2,093 · -6.7% YoY. Source: county tax records.
Cash-flow waterfall
monthlySold comps — $/sqft
last 12 mo · ≤1 miLoading sold comps…