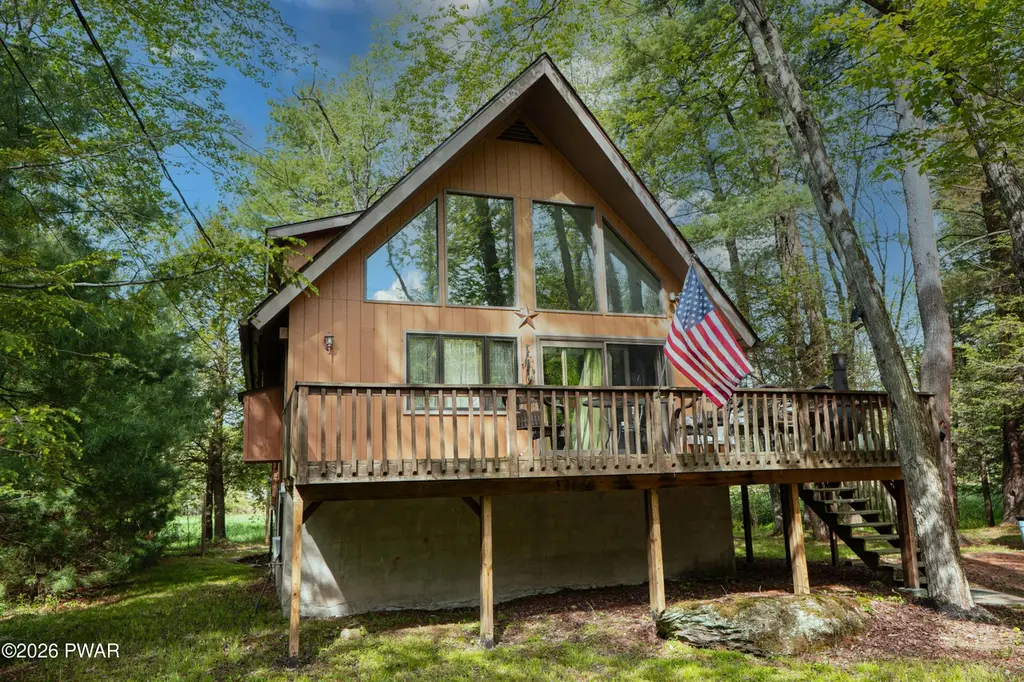
95 Brookfield Rd · Lake, PA
Flood risk 8/10 · Major
- FEMA flood zone
- AE
- Chance of flooding over 30 yrs
- 0.99%
- Est. flood insurance / yr
- $2,026 – $9,024
Fire risk 1/10 · Minimal
- Est. fire insurance / yr
- $511 – $949
Heat risk 2/10 · Minimal
- Hot days now (above 91°F)
- 7 days/yr
- Hot days in 30 yrs
- 16 days/yr
Wind risk 2/10 · Minimal
- Chance of severe wind over 30 yrs
- 3.0%
Air-quality risk 2/10 · Minimal
- Unhealthy air days now
- 1 days/yr
- Unhealthy air days in 30 yrs
- 2 days/yr
Risk factors via First Street. Map © Google.
Why this score? — see what drove the B- grade
The composite is a weighted blend of 9 inputs, each scored 0–100. Each bar is that input's sub-score; the figure is the points it added to the 100-point composite (weight × sub-score).
- Cash flow +20.1/30.0
- ARV discount +15.0/15.0
- Appreciation +10.0/10.0
- DSCR +6.4/10.0
- 1% rule +5.5/10.0
- Schools +4.4/10.0
- Rent growth +2.5/5.0
- Livability +2.5/5.0
- Condition / age +2.5/5.0
$275,000
🖨 Deal sheet 📄 Offer letter ✓ Due diligence
Listing remarks
Chalet charm meets modern comfort in this beautifully updated Pocono retreat! Featuring a bright open floor plan with rustic character and thoughtful upgrades throughout, this home offers the perfect blend of warmth and style. The updated kitchen and renovated bathrooms add a fresh, modern touch while maintaining the cozy chalet feel. Located on desirable Brookfield Rd, you'll love being just minutes from the main beach, main pool, ski hill, and tiki bar for year-round fun and convenience. Situated in The Hideout, an amenity-rich gated recreational community offering lakes, pools, beaches, golf course, ski hill, bar, restaurant, fitness center, and tiki bar, this home is the ideal escape or
Key facts
- Renovated bathrooms
- Updated kitchen
- 0.4 acre lot
Tags
Property features AI
Finance
- Other: Property located in a gated community with community amenities and recreational facilities
- Financial info: Association annual fee listed (monthly equivalent provided)
- HOA & community: Homeowners association with annual fee and additional one-time fee (fee includes trash); Association amenities include beach access, trails, sauna, tennis courts, seasonal streams/ponds, sport courts, ski access, pool, picnic area, playground, golf course, park, marina, jogging path, game courts (interior & exterior), gated entry, game room, fitness center, dog park, clubhouse, billiard room, beach rights, restaurant and fishing; Subdivision: The Hideout
Exterior
- Parking: Driveway; Gravel parking
- Security: Located in a gated community
- Utilities: Public sewer
- Home design: Single family residence; Residential property type; Three or more levels
- Construction: Asphalt roof
- Exterior features: Deck; Shed(s); Views; Roamingwood Lake nearby; Paved roads with private maintained road and private road frontage
Interior
- Kitchen: Dishwasher; Refrigerator; Microwave; Electric oven
- Bedrooms: Total rooms: 7
- Flooring: Laminate; Tile
- Bathrooms: 2 full bathrooms
- Heating & cooling: Baseboard heating; Radiant floor heating; Electric heating
- Interior features: High ceilings; Open floorplan; Daylight, walk-out, full and finished basement; Has fireplace (living room, propane)
- Laundry & utility: Washer; Dryer; Laundry room on lower level
Neighborhood map
What this means for you Summary
Snapshot
- This is a 2-bed/2.5-bath single-family listed at $275k.
Deal economics
- At list price, monthly cash flow is $-121 ($-1k/yr) — negative.
- To cash-flow at today's rent, offer at most $254k (7.8% below list).
- Meets the 1% rule at list price ($3k rent vs $275k).
- Recommended offer: $254k (7.8% below list) — sets the bar for cash-flow.
Location & tenants
- Location reads: area grade B — affects rentability + tenant quality, not the cash-flow math above.
- Western Wayne SD (rural): math 39% / reading 63% proficiency, ranked #165 of 539 in PA (top 31%) — acceptable for families but not a draw, mixed tenant base, ~2y average lease.
- Market conditions: 337 active listings in the ZIP; 1 comparable units currently listed for rent nearby; 177 units permitted in Wayne County in 2024 (0 in 5+ unit buildings).
Forward outlook
- In year one you build about $29k of equity ($2k loan paydown + $28k appreciation (10.0% local appreciation)).
- Wayne County population projected at -17% by 2050 — secular population decline; favor cash flow + early exit over multi-decade hold.
- By year 2, paydown + projected appreciation supports a ~$47k cash-out refi (75% LTV) — recoverable capital for the next deal without selling this one.
Negotiation context
- It's been on market 25 days — a 2% lower offer ($271k) is reasonable based on typical stale-listing flexibility.
- Current owner paid $150k; list at $275k implies a 83% gain — meaningful room to come down on a strong offer.
Risks & watch-outs
- Watch-outs: flood insurance adds $460/mo.
- Climate carrying-cost: in FEMA flood zone AE (mandatory federal flood insurance) — expect insurance premiums to compound above CPI over the hold.
Questions for the listing agent
- What do current leases actually rent for vs. the listed asking? Can we see a recent rent roll and the last 12 months of T-12 income?
- Built in 1976 — when were the roof, HVAC, electrical panel, plumbing, and water heater last replaced?
- What's the actual annual flood-insurance premium (NFIP or private), and is the property in a SFHA with mandatory coverage?
- What does the HOA fee cover, when was the last increase, and are there any pending special assessments or reserve-fund shortfalls?
- Is there a deadline driving the sale (1031 exchange, divorce, estate, relocation)? That informs how much negotiation room exists.
- What's the average days-on-market for RENTAL listings here right now (not sales)? A rising rental-DOM trend means longer vacancies and softer asking-rent achievability than the comps imply.
- What's the recent tenant-quality profile in this submarket — average credit score on applications, eviction rate, late-payment / NSF rate, and stable-employment percentage? A property-management company in the area should have these aggregated.
- How much new for-sale + rental construction is in the pipeline within 1–3 miles? Heavy new supply typically softens prices + rents 12–24 months out; constrained supply supports both.
Investment metrics
- 1% rule
- 1.05% ✓
- Cap rate
- 7.78%
- Cash-on-cash
- 5.30%
- DSCR
- 1.24
- GRM
- 7.9
CMA / ARV
- ARV (on-the-fly)
- $333,312
- Comps found
- 12
Show comp detail 12 sales within ~0.75 mi
| Address | Dist | Beds/Ba | Sqft | Sold | Price | $/sf | Match |
|---|---|---|---|---|---|---|---|
| 139 Ridgeview Dr | 0.21mi | 2/1.0 | 1,526 (-1%) | 5mo | $185,000 | $121 | 79 |
| 1379 Woodview Ter | 0.20mi | 3/2.0 (+1) | 1,483 (-4%) | 3mo | $164,500 | $111 | 76 |
| 45 Crestview Rd | 0.48mi | 3/2.0 (+1) | 1,522 (-1%) | 4mo | $270,000 | $177 | 65 |
| 59 Wildwood Ter | 0.48mi | 3/2.0 (+1) | 1,587 (+3%) | 1mo | $245,000 | $154 | 65 |
| 61 Woodcrest Ln | 0.28mi | 3/2.0 (+1) | 1,500 (-2%) | 16mo | $325,000 | $217 | 63 |
| 18 Wildwood Ct W | 0.38mi | 3/2.0 (+1) | 1,589 (+4%) | 10mo | $359,900 | $226 | 61 |
| 100 Ridgeview Dr | 0.35mi | 3/3.0 (+1) | 1,650 (+7%) | 7mo | $279,000 | $169 | 58 |
| 32 Forest Ln | 0.32mi | 3/2.5 (+1) | 1,408 (-8%) | 11mo | $350,000 | $249 | 57 |
| 894 Deerfield Rd | 0.54mi | 3/2.0 (+1) | 1,460 (-5%) | 3mo | $560,000 | $384 | 57 |
| 16 Wildwood Ter | 0.53mi | 2/2.0 | 1,692 (+10%) | 4mo | $268,650 | $159 | 53 |
| 467 Lakeview Dr W | 0.60mi | 3/2.0 (+1) | 1,550 (+1%) | 12mo | $425,000 | $274 | 53 |
| 97 Deerfield Rd | 0.63mi | 3/2.0 (+1) | 1,500 (-2%) | 15mo | $523,865 | $349 | 47 |
Match score weights: distance 35% · size 25% · config 20% · recency 20%. Top-matched comps best support the ARV.
Projected returns pro-forma
10.0% appreciation · 3.0% rent growth · sell at horizon
- IRR
- 23.0%
- Equity multiple
- 2.85×
- Total profit
- $142,446
- Equity at exit
- $247,742
- IRR
- 20.6%
- Equity multiple
- 6.54×
- Total profit
- $426,234
- Equity at exit
- $534,265
Cash invested: $77,000 (down + closing). Projections, not guarantees.
Landlord ↔ Tenant lean methodology
- Overall (STATE)
- 62 Landlord-Friendly
- State Pennsylvania
- 62 Landlord-Friendly · EVEN
- County
- — inherits STATE
- City
- — inherits STATE
ZIP-level market 18436
- Home prices YoY
- 16.9%
- Active inventory
- 337
- Price-to-rent
- 7.9×
Monthly cashflow live
- Estimated rent
- $2,900 medium interval (Pro) →
- Mortgage (P&I)
- −$1,442
- Tax from tax record
- −$206 /mo · $2,466/yr
- Insurance
- −$115
- Flood insurance flood zone
- −$460 /mo · $5,525/yr
- HOA
- −$189
- Vacancy / Maint / Mgmt
- −$609
- Net cashflow
- $-121
Break-even live
UW: 25.0% down · 7.5% · 30yr · 1.5% tax · 5.0% vac · 8.0% maint · 8.0% mgmt
Financing live
Cash to close
- Down payment
- $68,750
- Closing costs
- $8,250
- Reserves months
- —
- Total cash needed
- —
Loan-product check · same deal, 3 products live
Conventional
25% down · 7.5% · 30yr
- Down + closing
- —
- Monthly P&I
- —
- Monthly cashflow
- —
- DSCR
- —
- Eligible?
- —
Personal DTI + credit; lowest rate.
DSCR
20% down · 8.5% · 30yr
- Down + closing
- —
- Monthly P&I
- —
- Monthly cashflow
- —
- DSCR
- —
- Eligible?
- —
No personal income docs; deal must DSCR.
Hard money
10% down · 12.0% · 12mo
- Down + closing
- —
- Monthly P&I
- —
- Monthly cashflow
- —
- DSCR
- —
- Eligible?
- —
Short-term bridge; refi at stabilization.
Rent comps 1 comps
| Address | Beds | Baths | Sqft | Rent | $/sqft | DOM | Units | Dist |
|---|---|---|---|---|---|---|---|---|
| 1148 Golf Park Dr Lake Ariel, PA | 3.0 | 1.0 | 1210 | $2,900 | $2.40 | 24d | 1 | 0.38mi |
HOA detail
- Monthly dues
- $189 · $2,268/yr
- Likely covers
- poolgymsecurity
Listing history 19 events
-
2026-06-18days on market $275,000 Active 25 DOM
-
2026-06-17days on market $275,000 Active 24 DOM
-
2026-06-16days on market $275,000 Active 23 DOM
-
2026-06-15days on market $275,000 Active 22 DOM
-
2026-06-14days on market $275,000 Active 20 DOM
-
2026-06-13days on market $275,000 Active 19 DOM
-
2026-06-10days on market $275,000 Active 17 DOM
-
2026-06-09days on market $275,000 Active 16 DOM
-
2026-06-08days on market $275,000 Active 15 DOM
-
2026-06-07days on market $275,000 Active 14 DOM
-
2026-06-03days on market $275,000 Active 10 DOM
-
2026-06-02days on market $275,000 Active 9 DOM
-
2026-06-01days on market $275,000 Active 8 DOM
-
2026-05-31days on market $275,000 Active 7 DOM
-
2026-05-30days on market $275,000 Active 6 DOM
-
2026-05-23$275,000 Active
-
2006-09-14soldstatus $150,000
-
2002-11-29soldstatus $67,400
-
1989-10-18soldstatus $79,000
ⓘ Source: listings_history table (triggers on properties + properties_extension) + one-shot
backfill from property_details.listing_events for pre-trigger history.
Tax reassessment forecast PA · Partial reset (capped growth)
- Current annual tax
- $2,466 · $206/mo
- Projected year-2 tax
- $3,406 · $284/mo
- Expected delta
- +$939/yr (+$78/mo · 38.1%)
ⓘ Screening estimate from a state-policy table — verify with the county assessor before closing.
Climate risk First Street
- Flood 8/10 Severe FEMA zone AE · 99% chance over 30 yrs
- Wildfire 1/10 Low
- Heat 2/10 Low 7 d/yr ≥91°F today · 16 d/yr by 30 yrs out
- Wind 2/10 Low 3% chance of damaging wind over 30 yrs
- Air quality 2/10 Low 1 unhealthy d/yr today · 2 by 30 yrs out
Nearby sold comps map
Loading sold comps map…
Walkable amenities ~0.75 mi
Loading nearby amenities…
Taxation est. · year 1
- Rental income
- $34,800
- − Mortgage interest
- −$15,404
- − Property taxes
- −$2,466
- − Insurance
- −$6,900
- − Repairs & maintenance
- −$2,784
- − Management
- −$2,784
- − HOA
- −$2,268
- − Depreciation
- −$8,000
- Taxable loss
- −$5,807
- Est. tax savings @ 24.0%
- +$1,394
- After-tax cash flow
- $-54/yr
For passive investors: Depreciation is non-cash, so a rental often shows a tax loss while cash-flowing — sheltering income. Rental losses are passive: they offset passive income freely, and up to $25,000/yr can offset ordinary (W-2) income if you actively participate and your MAGI is under $100k (phasing out to $0 by $150k); unused losses carry forward. On sale, claimed depreciation is recaptured at up to 25%, and gains may owe capital-gains tax (a 1031 exchange can defer both). Figures are a year-1 estimate at your 24.0% rate — not tax advice; consult a CPA.
Schools (NCES district)
- District
- Western Wayne SD
- NCES district ID
- 4226070
- Math proficiency
- 39% ▼ -12.00%
- Reading proficiency
- 63% ▼ -6.00%
- Median HH income
- $51,358
- Composite
- 43.65/100
- National rank
- #2964
- State rank
- #165 of 539 in PA
Livability — Lake
No livability data for this city. (Only ~50 U.S. cities are tracked.)
Census & demographics
- Census place
- The Hideout, PA
- Population (ZIP)
- 13,225
Population outlook (Wayne County) Hauer SSP2
- Today (2025)
- 47,924 people
- By 2030
- 46,191 · -3.6%
- By 2040
- 42,815 · -10.7%
- By 2050
- 39,873 · -16.8%
- By 2075
- 34,556 · -27.9%
- By 2100
- 28,358 · -40.8%
Race, ethnicity, and origin ACS 2023
- Neighborhood character
- Predominantly White (95%)
- Race & ethnicity
- White 95% Two or more races 3% Hispanic / Latino 2%
- Common ancestry
- Romanian 9% Scotch-Irish 2% Iranian 2%
- Foreign-born
- 4%
- Languages at home
- 95% English-only · French/Haitian/Cajun 2% Russian/Polish/Slavic 1% Spanish 1%
Political lean MEDSL · Wayne
- 2024 margin
- Solid R (+37.1) · D 31.1% · R 68.2%
- 2008→2024 swing
- -24.8pp toward R · 2008: -12.3pp · 2024: -37.1pp
- All cycles
- 2024: R+37.1 2020: R+33.6 2016: R+39.7 2012: R+20.9 2008: R+12.3
Not yet ingested
- Civics
- —
Market trends
- HPI YoY
- ▲ 47.95%
- Current HPI
- 331.9645
- Rent YoY
- —
- Metro
- —
- State GDP YoY
- ▲ 1.68%
- F500 in state
- 34
Industry mix (Fortune 500 HQ in PA)
| Industry | F500 HQs | Revenue |
|---|---|---|
| Healthcare | 2 | $309B |
|
||
| Insurance | 2 | $27B |
|
||
| Telecommunications / Media | 1 | $124B |
|
||
| Industrial Distribution | 1 | $22B |
|
||
| Financial Services | 1 | $20B |
|
||
| Chemicals / Materials | 1 | $18B |
|
||
Price history
+248.1% since first listed4 events — show timeline
- 2026-05-23 Listed $275,000 PWMLS
- 2006-09-14 Sold (Public Records) $150,000 Public Records
- 2002-11-29 Sold (Public Records) $67,400 Public Records
- 1989-10-18 Sold (Public Records) $79,000 Public Records
Property tax history
+2.4%/yrLatest (2026): $2,466 · +3.0% YoY. Source: county tax records.
Cash-flow waterfall
monthlySold comps — $/sqft
last 12 mo · ≤1 miLoading sold comps…