 Multi-family
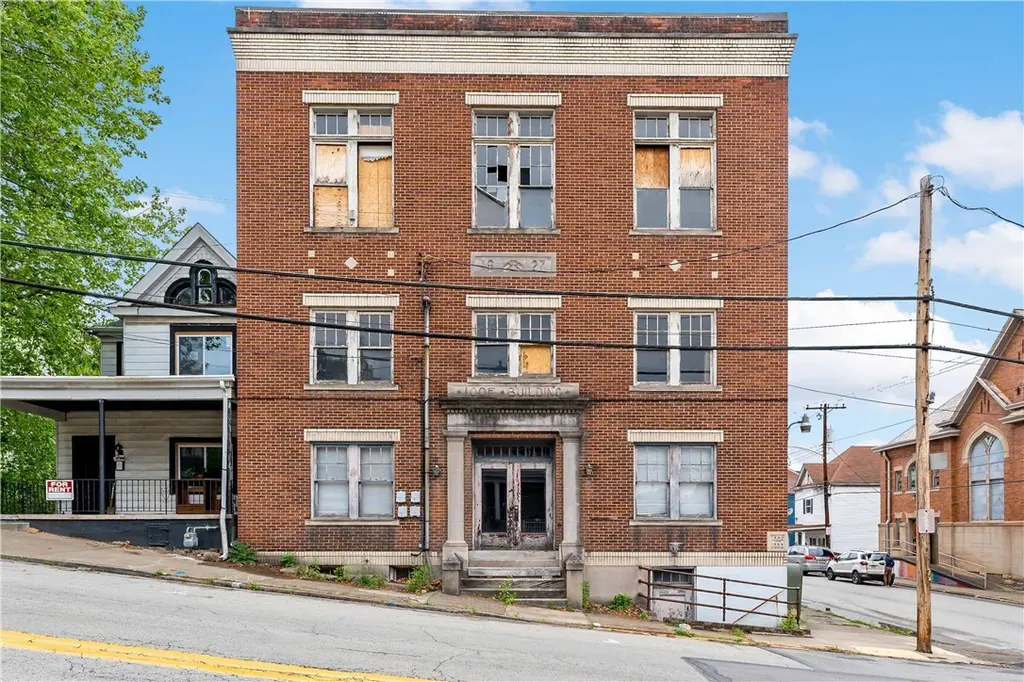
400 5th St · Charleroi, PA
Flood risk 1/10 · Minimal
- FEMA flood zone
- X (unshaded)
- Chance of flooding over 30 yrs
- 0.0%
- Est. flood insurance / yr
- $507 – $1,088
Fire risk 2/10 · Minimal
- Est. fire insurance / yr
- $511 – $949
Heat risk 4/10 · Minor
- Hot days now (above 97°F)
- 8 days/yr
- Hot days in 30 yrs
- 21 days/yr
Wind risk 2/10 · Minimal
- Chance of severe wind over 30 yrs
- —
Air-quality risk 2/10 · Minimal
- Unhealthy air days now
- 1 days/yr
- Unhealthy air days in 30 yrs
- 2 days/yr
Risk factors via First Street. Map © Google.
Why this score? — see what drove the B grade
The composite is a weighted blend of 9 inputs, each scored 0–100. Each bar is that input's sub-score; the figure is the points it added to the 100-point composite (weight × sub-score).
- Cash flow +30.0/30.0
- 1% rule +10.0/10.0
- DSCR +10.0/10.0
- ARV discount +7.5/15.0
- Appreciation +4.1/10.0
- Livability +3.8/5.0
- Schools +3.0/10.0
- Rent growth +2.5/5.0
- Condition / age +1.0/5.0
$199,900
🖨 Deal sheet 📄 Offer letter ✓ Due diligence
Multi-family units
County records classify this as Multi-Family (2-4 Unit). Listing-text estimate: 1 unit. estimate disagrees with records
Listing remarks
Great opportunity to acquire a true piece of local history with immense redevelopment potential. This massive brick structure offers approximately 12,000–14,000 square feet and was previously configured for residential apartment use, along with two expansive spaces seemingly a former banquet hall in the basement and a large social hall occupying the top floor. The Building makes an ideal candidate for investors, developers, or visionary owner-operators seeking their next value-add project. The property seems to be previously built out for eight 2-bedroom, 1-bath apartments. The building’s solid brick construction, historic character, and flexible layout create endless possibilit
Key facts
- Mixed-use conversion
- Brick structure
- Flexible layout
Tags
Property features AI
Finance
- Financial info: Assessed value listed; Annual tax amount listed
Exterior
- Parking: On-street parking
- Utilities: Electricity available; Natural gas available; Water available; Sewer available
- Home design: Property facing and stories not specified
- Construction: Brick exterior
- Exterior features: Brick construction; Zoned commercial
Interior
- Interior features: Full basement
Neighborhood map
What this means for you Summary
Snapshot
- This is a multifamily listed at $200k. Condition is rated poor.
Deal economics
- At list price, monthly cash flow is $4k ($49k/yr) — positive.
- The deal already cash-flows at list — no discount required.
- Meets the 1% rule at list price ($7k rent vs $200k).
- Recommended offer: $194k (3.0% below list) — sets the bar for market timing.
- Cap rate 30.8% vs local median 15.3% in Charleroi — top-decile yield for the area; either an underpriced asset or a hidden risk that comps aren't pricing in. Stress-test before assuming the spread holds.
Location & tenants
- Location reads 76/100 on livability (#382 in PA, #3,416 nationally) — a middle-class / working-renter tenant base. Strengths: cost of living A+, housing A+, crime A-; Watch: schools D+, employment F.
- Charleroi SD (rural): math 20% / reading 51% proficiency, ranked #421 of 539 in PA (top 78%) — families likely to look elsewhere, expect single-tenant / working-renter base with shorter leases.
- Market conditions: 87 active listings in the ZIP; 12 comparable units currently listed for rent nearby; rentals leasing fast (median 2d on market — plan ~1-2 weeks tenant-placement turnaround); 489 units permitted in Washington County in 2024 (30 in 5+ unit buildings).
Forward outlook
- Local home prices are declining (-1.8%/yr); year-one equity from $1k of loan paydown is wiped out by about $4k of value loss. Plan a longer hold.
- Washington County population projected to shrink 6% by 2050 — rents likely to lag national; underwrite the cash flow, not the appreciation.
- At projected returns (-1.8% appreciation + 3.0% rent growth), your $56k cash investment doubles in ~2 years — after that, you're playing with house money.
Negotiation context
- It's been on market 34 days — a 3% lower offer ($194k) is reasonable based on typical stale-listing flexibility.
Risks & watch-outs
- Watch-outs: built in 1927 — expect roof / HVAC / electrical / plumbing capex.
Questions for the listing agent
- It's been on market 34 days. Have you received any prior offers? Is the seller open to a 3% concession, seller financing, or rate buy-down credit?
- Have any recent inspections been done? Can we get a copy of the seller's disclosures and any deferred-maintenance estimates?
- Built in 1927 — when were the roof, HVAC, electrical panel, plumbing, and water heater last replaced?
- Is there a deadline driving the sale (1031 exchange, divorce, estate, relocation)? That informs how much negotiation room exists.
- Schools are D-rated, which usually means shorter tenancies and higher turnover. Who's the typical renter profile here, and what's been the actual vacancy rate?
- What's the average days-on-market for RENTAL listings here right now (not sales)? A rising rental-DOM trend means longer vacancies and softer asking-rent achievability than the comps imply.
- What's the recent tenant-quality profile in this submarket — average credit score on applications, eviction rate, late-payment / NSF rate, and stable-employment percentage? A property-management company in the area should have these aggregated.
- How much new apartment / multifamily construction is in the pipeline within 1–3 miles? Heavy new supply (>2% of stock underway) typically softens rents 12–24 months out; light construction supports rent growth.
Investment metrics
- 1% rule
- 3.46% ✓
- Cap rate
- 30.77%
- Cash-on-cash
- 87.40%
- DSCR
- 4.89
- GRM
- 2.4
CMA / ARV
- ARV (median comp)
- $58,476
- List price
- $199,900
- Delta
- 241.85%
- Verdict
- OVERPRICED
- Comps
- 1 within 2.0 mi
Show comp detail 9 sales within ~0.75 mi
| Address | Dist | Beds/Ba | Sqft | Sold | Price | $/sf | Match |
|---|---|---|---|---|---|---|---|
| 526 Fallowfield | 0.09mi | 8/7.0 | — | 2mo | $382,500 | — | 82 |
| 409 5th St | 0.03mi | 4/2.0 | — | 8mo | $55,000 | — | 79 |
| 404 5th St | 0.01mi | 4/2.0 | — | 11mo | $18,500 | — | 78 |
| 206 Lookout Ave | 0.25mi | 5/3.0 | — | 2mo | $35,000 | — | 74 |
| 429 Mckean Ave | 0.10mi | 5/6.0 | — | 15mo | $199,900 | — | 70 |
| 503 Meadow Ave | 0.20mi | 4/2.0 | — | 18mo | $48,000 | — | 63 |
| 15-16 3rd St | 0.28mi | 4/2.0 | — | 18mo | $96,000 | — | 59 |
| 209 Luella Ave | 0.27mi | 4/2.0 | — | 21mo | $27,600 | — | 58 |
| 219 Meadow Ave | 0.28mi | 5/3.0 | — | 24mo | $75,000 | — | 55 |
Match score weights: distance 35% · size 25% · config 20% · recency 20%. Top-matched comps best support the ARV.
Projected returns pro-forma
-1.83% appreciation · 3.0% rent growth · sell at horizon
- IRR
- 88.7%
- Equity multiple
- 5.24×
- Total profit
- $237,331
- Equity at exit
- $40,418
- IRR
- 91.0%
- Equity multiple
- 10.83×
- Total profit
- $550,395
- Equity at exit
- $36,073
Cash invested: $55,972 (down + closing). Projections, not guarantees.
Landlord ↔ Tenant lean methodology
- Overall (STATE)
- 62 Landlord-Friendly
- State Pennsylvania
- 62 Landlord-Friendly · EVEN
- County
- — inherits STATE
- City
- — inherits STATE
ZIP-level market 15022
- Home prices YoY
- -1.0%
- Active inventory
- 87
- Price-to-rent
- 19.3×
Monthly cashflow live
- Estimated rent
- $6,909 high interval (Pro) →
- Mortgage (P&I)
- −$1,048
- Tax est. 1.5%
- −$250 /mo · $2,998/yr
- Insurance
- −$83
- HOA
- −$0
- Vacancy / Maint / Mgmt
- −$1,451
- Net cashflow
- $4,077
Break-even live
8-unit breakdown (identical units grouped — click to expand)
| Units | Beds | Baths | Est. rent |
|---|---|---|---|
| 8× units | 2 | 1 | $6,912 |
| #1 | 2 | 1 | $864 |
| #2 | 2 | 1 | $864 |
| #3 | 2 | 1 | $864 |
| #4 | 2 | 1 | $864 |
| #5 | 2 | 1 | $864 |
| #6 | 2 | 1 | $864 |
| #7 | 2 | 1 | $864 |
| #8 | 2 | 1 | $864 |
| Total (8 units) | $6,909 | ||
UW: 25.0% down · 7.5% · 30yr · 1.5% tax · 5.0% vac · 8.0% maint · 8.0% mgmt
Financing live
Cash to close
- Down payment
- $49,975
- Closing costs
- $5,997
- Reserves months
- —
- Total cash needed
- —
Loan-product check · same deal, 3 products live
Conventional
25% down · 7.5% · 30yr
- Down + closing
- —
- Monthly P&I
- —
- Monthly cashflow
- —
- DSCR
- —
- Eligible?
- —
Personal DTI + credit; lowest rate.
DSCR
20% down · 8.5% · 30yr
- Down + closing
- —
- Monthly P&I
- —
- Monthly cashflow
- —
- DSCR
- —
- Eligible?
- —
No personal income docs; deal must DSCR.
Hard money
10% down · 12.0% · 12mo
- Down + closing
- —
- Monthly P&I
- —
- Monthly cashflow
- —
- DSCR
- —
- Eligible?
- —
Short-term bridge; refi at stabilization.
Rent comps 12 comps
| Address | Beds | Baths | Sqft | Rent | $/sqft | DOM | Units | Dist |
|---|---|---|---|---|---|---|---|---|
| 207 5th St Apt 203 Charleroi, PA | 1.0 | 1.0 | 650 | $695 | $1.07 | 1d | 1 | 0.07mi |
| 15 3rd St Charleroi, PA | 2.0 | 1.0 | — | $795 | — | 1d | 1 | 0.27mi |
| 16 3rd St Charleroi, PA | 2.0 | 1.0 | — | $795 | — | 1d | 1 | 0.27mi |
| 1022 McKean Ave Charleroi, PA | 3.0 | 3.0 | 1344 | $1,450 | $1.08 | 1d | 1 | 0.51mi |
| 900 11th St Charleroi, PA | 2.0 | 1.0 | — | $1,100 | — | 1d | 1 | 0.57mi |
| 1204 Lower Meadow Ave Charleroi, PA | 3.0 | 1.0 | 1024 | $1,150 | $1.12 | 1d | 1 | 0.61mi |
| 1221 Graham Ave Monessen, PA | 3.0 | 1.0 | 960 | $1,300 | $1.35 | 1d | 1 | 0.78mi |
| 619 Conrad Ave Unit 2 Charleroi, PA | 1.0 | 1.0 | — | $750 | — | 1d | 1 | 0.97mi |
| 925 Leeds Ave Monessen, PA | 2.0 | 1.0 | 1000 | $700 | $0.70 | 14d | 1 | 1.14mi |
| 925 Leeds Ave Monessen, PA | 2.0 | 1.0 | 1000 | $700 | $0.70 | 1d | 1 | 1.14mi |
| 1136 Reservoir Ave Monessen, PA | 3.0 | 2.0 | 1550 | $650 | $0.42 | 1d | 1 | 1.31mi |
| 522 Division St Monessen, PA | 2.0 | 1.0 | 2547 | $795 | $0.31 | 1d | 1 | 1.40mi |
Listing history 14 events
-
2026-06-18days on market $199,900 Active 34 DOM
-
2026-06-17days on market $199,900 Active 33 DOM
-
2026-06-16days on market $199,900 Active 32 DOM
-
2026-06-15days on market $199,900 Active 31 DOM
-
2026-06-13days on market $199,900 Active 29 DOM
-
2026-06-09days on market $199,900 Active 25 DOM
-
2026-06-08days on market $199,900 Active 24 DOM
-
2026-06-07days on market $199,900 Active 23 DOM
-
2026-06-05days on market $199,900 Active 20 DOM
-
2026-06-03days on market $199,900 Active 19 DOM
-
2026-06-02days on market $199,900 Active 18 DOM
-
2026-06-01days on market $199,900 Active 17 DOM
-
2026-05-31days on market $199,900 Active 16 DOM
-
2026-05-13$199,900 Active 814-char remark
ⓘ Source: listings_history table (triggers on properties + properties_extension) + one-shot
backfill from property_details.listing_events for pre-trigger history.
Climate risk First Street
- Flood 1/10 Low FEMA zone X (unshaded) · 0% chance over 30 yrs
- Wildfire 2/10 Low
- Heat 4/10 Moderate 8 d/yr ≥97°F today · 21 d/yr by 30 yrs out
- Wind 2/10 Low
- Air quality 2/10 Low 1 unhealthy d/yr today · 2 by 30 yrs out
Nearby sold comps map
Loading sold comps map…
Walkable amenities ~0.75 mi
Loading nearby amenities…
Taxation est. · year 1
- Rental income
- $82,908
- − Mortgage interest
- −$11,198
- − Property taxes
- −$2,998
- − Insurance
- −$1,000
- − Repairs & maintenance
- −$6,633
- − Management
- −$6,633
- − Depreciation
- −$5,815
- Taxable income
- $48,632
- Est. tax owed @ 24.0%
- −$11,672
- After-tax cash flow
- $37,248/yr
For passive investors: Depreciation is non-cash, so a rental often shows a tax loss while cash-flowing — sheltering income. Rental losses are passive: they offset passive income freely, and up to $25,000/yr can offset ordinary (W-2) income if you actively participate and your MAGI is under $100k (phasing out to $0 by $150k); unused losses carry forward. On sale, claimed depreciation is recaptured at up to 25%, and gains may owe capital-gains tax (a 1031 exchange can defer both). Figures are a year-1 estimate at your 24.0% rate — not tax advice; consult a CPA.
Condition & rehab AI · 12 photos
This multi-family building requires extensive repairs and renovations to restore its structural integrity and improve its appearance, making it a significant value-add project for investors and developers.
Repairs flagged
- Major roof — Severe damage and missing shingles
- Major exterior — Boarded-up windows and brick facade
- Major interior — Exposed beams and debris
- Major flooring — Damaged and uneven floors
- Major systems — Exposed electrical and plumbing systems
Value-add opportunities
- Both extensive exterior and interior repairs — Restores the building's structural integrity and appearance
- Both roof replacement — Prevents water damage and improves the building's overall condition
- Both electrical and plumbing upgrades — Ensures safety and functionality
- Both flooring replacement — Improves the building's usability and appearance
- Both interior paint and repairs — Enhances the building's appearance and usability
Renovation cost estimate screening
| Repair item | Severity | Est. cost |
|---|---|---|
| roof · Severe damage and missing shingles | Major | $15,000–50,000 |
| exterior · Boarded-up windows and brick facade | Major | $15,000–50,000 |
| interior · Exposed beams and debris | Major | $15,000–50,000 |
| flooring · Damaged and uneven floors | Major | $15,000–50,000 |
| systems · Exposed electrical and plumbing systems | Major | $15,000–50,000 |
| Total estimated repair cost · 5 items | $75,000–250,000 |
Value-add ROI direction
- Both extensive exterior and interior repairs — Restores the building's structural integrity and appearance ↑
- Both roof replacement — Prevents water damage and improves the building's overall condition ↑
- Both electrical and plumbing upgrades — Ensures safety and functionality ↑
- Both flooring replacement — Improves the building's usability and appearance ↑
- Both interior paint and repairs — Enhances the building's appearance and usability ↑
ⓘ Cost ranges are severity-bucket heuristics (US national rule-of-thumb). Get contractor quotes + a written scope before underwriting a rehab budget.
Schools (NCES district)
- District
- Charleroi SD
- NCES district ID
- 4205640
- Math proficiency
- 20% ▼ -19.00%
- Reading proficiency
- 51% ▼ -11.00%
- Median HH income
- $40,410
- Composite
- 29.72/100
- National rank
- #6450
- State rank
- #421 of 539 in PA
Livability — Charleroi
- Score
- 76/100
- State rank
- #382
- US rank
- #3416
Category grades
Schools grade is shown separately in the Schools card above.
Census & demographics
- Census place
- Charleroi, PA
- Population (ZIP)
- 10,044
Population outlook (Washington County) Hauer SSP2
- Today (2025)
- 208,060 people
- By 2030
- 207,168 · -0.4%
- By 2040
- 202,738 · -2.6%
- By 2050
- 195,269 · -6.1%
- By 2075
- 175,588 · -15.6%
- By 2100
- 145,827 · -29.9%
Race, ethnicity, and origin ACS 2023
- Neighborhood character
- Predominantly White (87%)
- Race & ethnicity
- White 87% Two or more races 6% Black 6%
- Common ancestry
- Romanian 8% Lithuanian 3% Scotch-Irish 2%
- Foreign-born
- 2% · Canada
- Languages at home
- 98% English-only · Spanish 1%
Political lean MEDSL · Washington
- 2024 margin
- Strong R (+25.5) · D 36.9% · R 62.4%
- 2008→2024 swing
- -20.8pp toward R · 2008: -4.7pp · 2024: -25.5pp
- All cycles
- 2024: R+25.5 2020: R+22.8 2016: R+25.3 2012: R+13.3 2008: R+4.7
Not yet ingested
- Civics
- —
Market trends
- HPI YoY
- ▼ -1.83%
- Current HPI
- 174.218
- Rent YoY
- —
- Metro
- —
- State GDP YoY
- ▲ 1.68%
- F500 in state
- 34
Industry mix (Fortune 500 HQ in PA)
| Industry | F500 HQs | Revenue |
|---|---|---|
| Healthcare | 2 | $309B |
|
||
| Insurance | 2 | $27B |
|
||
| Telecommunications / Media | 1 | $124B |
|
||
| Industrial Distribution | 1 | $22B |
|
||
| Financial Services | 1 | $20B |
|
||
| Chemicals / Materials | 1 | $18B |
|
||
Price history
1 event — show timeline
- 2026-05-13 Listed $199,900 West Penn MLS
Cash-flow waterfall
monthlySold comps — $/sqft
last 12 mo · ≤1 miLoading sold comps…