2094 Arbour Walk Cir #3018 · Pine Ridge, FL
Flood risk 4/10 · Minor
- FEMA flood zone
- X (shaded)
- Chance of flooding over 30 yrs
- 0.18%
- Est. flood insurance / yr
- $507 – $1,088
Fire risk 1/10 · Minimal
- Est. fire insurance / yr
- $947 – $1,759
Heat risk 10/10 · Severe
- Hot days now (above 107°F)
- 7 days/yr
- Hot days in 30 yrs
- 30 days/yr
Wind risk 10/10 · Severe
- Chance of severe wind over 30 yrs
- 99.0%
Air-quality risk 2/10 · Minimal
- Unhealthy air days now
- 2 days/yr
- Unhealthy air days in 30 yrs
- 2 days/yr
Risk factors via First Street. Map © Google.
Why this score? — see what drove the F grade
The composite is a weighted blend of 9 inputs, each scored 0–100. Each bar is that input's sub-score; the figure is the points it added to the 100-point composite (weight × sub-score).
- ARV discount +7.5/15.0
- Cash flow +5.3/30.0
- Appreciation +5.1/10.0
- Schools +5.0/10.0
- 1% rule +3.4/10.0
- Livability +3.4/5.0
- Rent growth +2.7/5.0
- Condition / age +2.5/5.0
- DSCR +0.0/10.0
$255,725
🖨 Deal sheet (PDF) 📄 Offer letter ✓ Due diligence
Listing remarks MLS
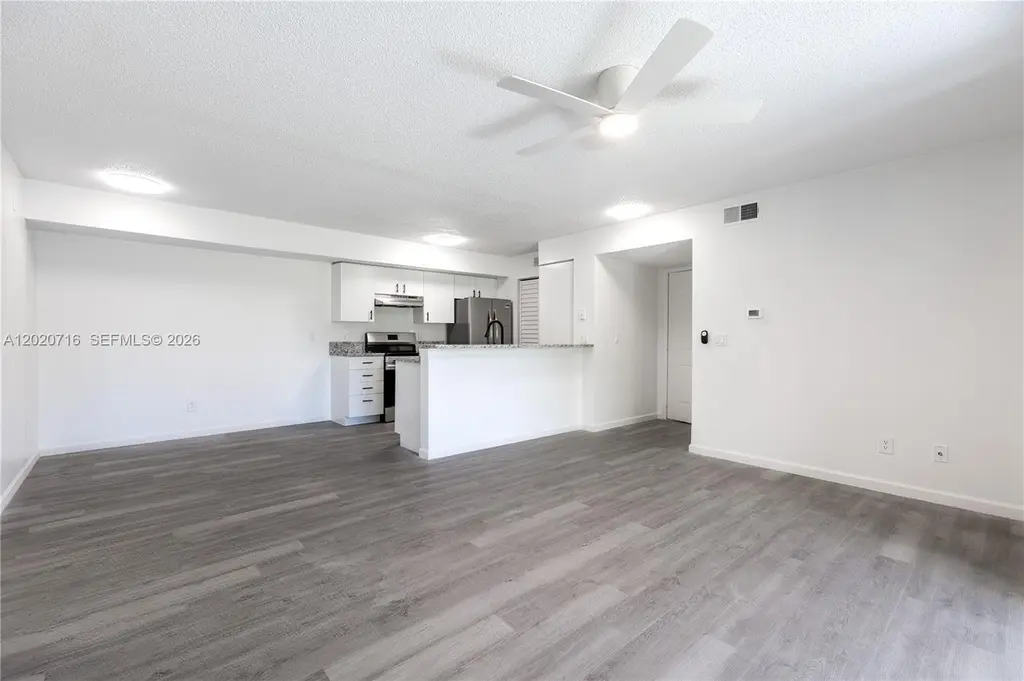
Charming first floor condo located in the heart of Naples. Featuring two bedroom, two bathroom floorplan with 920 square feet of updated living space. Enjoy a modern kitchen, upgraded flooring and bathrooms, all completed by the peaceful lake view. Perfect situated just minutes from the beach, shopping's centers, dinning plus located within a highly desirable school zone. Community amenities includes 2 pools , tennis court, and a fitness center. A great blend of Comfort, Location and Lifestyle.
Key facts
- Upgraded flooring
- Community amenities
- First floor condo
Tags
Property features AI
Finance
- Financial info: Pets allowed (yes) with size limit up to 20 lbs
- HOA & community: Monthly association fee; Association fee includes management, amenities, common areas, cable TV, internet, grounds maintenance, parking, pest control, roof, trash, and water; Association amenities: clubhouse, fitness center, barbecue, picnic area, playground, pool (association, heated), tennis court(s), vehicle wash area
Exterior
- Parking: Two or more spaces
- Security: Complex fenced; Smoke detector(s)
- Utilities: Cable available; Association-maintained water and trash (included in HOA)
- Home design: Attached property; 2-story building; Entry at level 1; Has view
- Construction: Block construction; Resale property
- Exterior features: Barbecue; Enclosed porch; Tennis court(s); Glass-enclosed, screened porch
Interior
- Kitchen: Dryer; Dishwasher; Electric range; Icemaker; Microwave; Refrigerator; Trash compactor; Washer
- Bedrooms: Has porch (room type listed)
- Flooring: Vinyl
- Bathrooms: 2 full bathrooms
- Heating & cooling: Central heating (electric); Central air; Ceiling fan(s)
- Interior features: Breakfast area; Living/dining room; Pantry; Split bedrooms; Walk-in closet(s); Unfurnished
- Laundry & utility: Washer and dryer included
Neighborhood map
What this means for you Summary
Snapshot
- This is a 2-bed/2.0-bath condo listed at $256k.
Deal economics
- At list price, monthly cash flow is $-565 ($-7k/yr) — negative.
- To cash-flow at today's rent, offer at most $156k (39.0% below list).
- To meet the 1% rule (rent ≥ 1% of price), the offer needs to be $214k (16.2% below list).
- Recommended offer: $156k (39.0% below list) — sets the bar for cash-flow.
Location & tenants
- Location reads 67/100 on livability (#565 in FL) — a middle-class / working-renter tenant base. Strengths: crime A+, housing A+, cost of living A-; Watch: health & safety C-, amenities F, commute F.
- Collier (suburban): math 60% / reading 56% proficiency, ranked #16 of 73 in FL (top 22%) — acceptable for families but not a draw, mixed tenant base, ~2y average lease.
- Zoned schools: Pelican Marsh Elementary School (math 87% / reading 83%, grade A+, #35 of 2,144 statewide, top 2%, 709 students, 29% FRL); Pine Ridge Middle School (math 74% / reading 70%, grade A, #52 of 571 statewide, top 10%, 832 students, 31% FRL); Barron Collier High School (math 62% / reading 68%, grade B, #76 of 667 statewide, top 11%, 1,650 students, 26% FRL) — zoned schools average 29% FRL vs 55% district-wide (26 pts lower); this property's tenant base skews higher-income than the district average.
- Zoned-school proficiency averages 74% at this address vs 58% district-wide (+16 pts) — the actual schools serving this property are materially stronger than the Collier average implies; a family-tenant draw the district grade alone would hide.
- Market conditions: Rents flat; 424 active listings in the ZIP; 40 comparable units currently listed for rent nearby; rentals at typical pace (median 23d on market — plan ~3-4 weeks tenant-placement turnaround); solid renter incomes; 3,520 units permitted in Collier County in 2024 (959 in 5+ unit buildings).
Forward outlook
- In year one you build about $3k of equity ($2k loan paydown + $754 appreciation (0.3% local appreciation)).
- Collier County population projected at +30% by 2050 — long-run rental-demand tailwind backs the buy-and-hold thesis.
- By year 10, paydown + projected appreciation supports a ~$31k cash-out refi (75% LTV) — recoverable capital for the next deal without selling this one.
Negotiation context
- It's been on market 35 days — a 3% lower offer ($248k) is reasonable based on typical stale-listing flexibility.
- 5 sale attempts since 18y ago with the ask held roughly flat each time — persistent listings suggest the price (not the market) is what's stuck; bring a comps-based counter.
- Current owner paid $60k; list at $256k implies a 326% gain — meaningful room to come down on a strong offer.
Risks & watch-outs
- Watch-outs: HOA is 31% of rent.
- Climate carrying-cost: severe wind risk, 99% chance of damaging wind over 30y; extreme-heat days projected 7→30/yr by 2055 (HVAC capex compounding) — expect insurance premiums to compound above CPI over the hold.
Questions for the listing agent
- What do current leases actually rent for vs. the listed asking? Can we see a recent rent roll and the last 12 months of T-12 income?
- It's been on market 35 days. Have you received any prior offers? Is the seller open to a 39% concession, seller financing, or rate buy-down credit?
- What does the HOA fee cover, when was the last increase, and are there any pending special assessments or reserve-fund shortfalls?
- Any open or pending special assessments — roof, HVAC, plumbing, elevator, façade? What's the per-unit balance and payoff schedule, and is the seller paying it off at close or rolling it to the buyer?
- Is there a deadline driving the sale (1031 exchange, divorce, estate, relocation)? That informs how much negotiation room exists.
- Schools are F-rated, which usually means shorter tenancies and higher turnover. Who's the typical renter profile here, and what's been the actual vacancy rate?
- The area grade is low — what's the realistic commute time and amenity access for the typical tenant pool here? Any planned neighborhood developments (good or bad) we should know about?
- What's the average days-on-market for RENTAL listings here right now (not sales)? A rising rental-DOM trend means longer vacancies and softer asking-rent achievability than the comps imply.
- What's the recent tenant-quality profile in this submarket — average credit score on applications, eviction rate, late-payment / NSF rate, and stable-employment percentage? A property-management company in the area should have these aggregated.
- How much new apartment / multifamily construction is in the pipeline within 1–3 miles? Heavy new supply (>2% of stock underway) typically softens rents 12–24 months out; light construction supports rent growth.
Investment metrics
- 1% rule
- 0.84% ✗
- Cap rate
- 3.64%
- Cash-on-cash
- -9.47%
- DSCR
- 0.58
- GRM
- 9.9
CMA / ARV
No comps found within radius.
Projected returns pro-forma
0.29% appreciation · 0.92% rent growth · sell at horizon
- IRR
- -13.1%
- Equity multiple
- 0.39×
- Total profit
- $-43,951
- Equity at exit
- $78,048
- IRR
- -8.3%
- Equity multiple
- 0.12×
- Total profit
- $-62,909
- Equity at exit
- $96,900
Cash invested: $71,603 (down + closing). Projections, not guarantees.
Landlord ↔ Tenant lean methodology
- Overall (STATE)
- 87 Strongly Landlord-Friendly
- State Florida
- 87 Strongly Landlord-Friendly · R+3
- County
- — inherits STATE
- City
- — inherits STATE
ZIP-level market 34109
- Home prices YoY
- 0.1%
- Rents YoY
- 0.9%
- Active inventory
- 424
- Price-to-rent
- 9.9×
Monthly cashflow live
- Estimated rent
- $2,144 high interval (Pro) →
- Mortgage (P&I)
- −$1,341
- Tax from tax record
- −$146 /mo · $1,751/yr
- Insurance
- −$107
- HOA
- −$665
- Vacancy / Maint / Mgmt
- −$450
- Net cashflow
- $-565
Break-even live
Sensitivity live
| Price | -10% $-420 | -5% $-492 | +0% $-565 | +5% $-637 | +10% $-710 |
|---|---|---|---|---|---|
| Rent | -10% $-734 | -5% $-650 | +0% $-565 | +5% $-480 | +10% $-395 |
| Rate | -1.0pp $-436 | -0.5pp $-500 | base $-565 | +0.5pp $-631 | +1.0pp $-699 |
UW: 25.0% down · 7.5% · 30yr · 1.5% tax · 5.0% vac · 8.0% maint · 8.0% mgmt
Financing live
Cash to close
- Down payment
- $63,931
- Closing costs
- $7,672
- Reserves months
- —
- Total cash needed
- —
Loan-product check · same deal, 3 products live
Conventional
25% down · 7.5% · 30yr
- Down + closing
- —
- Monthly P&I
- —
- Monthly cashflow
- —
- DSCR
- —
- Eligible?
- —
Personal DTI + credit; lowest rate.
DSCR
20% down · 8.5% · 30yr
- Down + closing
- —
- Monthly P&I
- —
- Monthly cashflow
- —
- DSCR
- —
- Eligible?
- —
No personal income docs; deal must DSCR.
Hard money
10% down · 12.0% · 12mo
- Down + closing
- —
- Monthly P&I
- —
- Monthly cashflow
- —
- DSCR
- —
- Eligible?
- —
Short-term bridge; refi at stabilization.
Rent comps 40 comps
| Address | Beds | Baths | Sqft | Rent | $/sqft | DOM | Units | Dist |
|---|---|---|---|---|---|---|---|---|
| 2058 Arbour Walk Cir #3322 Naples, FL | 2.0 | 2.0 | 918 | $2,000 | $2.18 | 25d | 1 | 0.07mi |
| 2070 Arbour Walk Cir #3214 Naples, FL | 1.0 | 1.0 | 760 | $1,600 | $2.11 | 23d | 1 | 0.07mi |
| 2130 Arbour Walk Cir #2724 Naples, FL | 2.0 | 2.0 | 1022 | $1,800 | $1.76 | 25d | 1 | 0.08mi |
| 2094 Arbour Walk Cir Naples, FL | 1.0 | 1.0 | 648 | $1,588 | $2.45 | 25d | 2 | 0.08mi |
| 2118 Arbour Walk Cir Naples, FL | 1.0 | 1.0 | 750 | $1,300 | $1.73 | 25d | 1 | 0.10mi |
| 2226 Arbour Walk Cir #1913 Naples, FL | 1.0 | 1.0 | 740 | $1,475 | $1.99 | 25d | 1 | 0.23mi |
| 2277 Arbour Walk Cir Naples, FL | 1.0–2.0 | 1.0–2.0 | 937 | $2,540 | $2.71 | 15d | 25 | 0.28mi |
| 2602 Fountain View Cir Naples, FL | 1.0–2.0 | 1.0–2.0 | 995 | $2,277 | $2.29 | 15d | 41 | 0.52mi |
| 7712 Jewel Ln Naples, FL | 2.0 | 2.0 | 1022 | $1,850 | $1.81 | 25d | 1 | 0.84mi |
| 7719 Jewel Ln #103 Naples, FL | 2.0 | 2.0 | 1022 | $3,800 | $3.72 | 25d | 1 | 0.86mi |
| 7800 Emerald Cir #104 Naples, FL | 2.0 | 2.0 | 1022 | $2,200 | $2.15 | 23d | 1 | 0.88mi |
| 7800 Emerald Cir Unit B104 Naples, FL | 2.0 | 2.0 | 1022 | $2,200 | $2.15 | 15d | 1 | 0.88mi |
| 7794 Emerald Cir Unit A-102 Naples, FL | 2.0 | 2.0 | 1022 | $4,000 | $3.91 | 15d | 1 | 0.91mi |
| 7754 Emerald Cir Unit T202 Naples, FL | 2.0 | 2.0 | 1022 | $3,850 | $3.77 | 15d | 1 | 0.96mi |
| 7791 Esmeralda Way #203 Naples, FL | 2.0 | 2.0 | 1022 | $1,950 | $1.91 | 15d | 1 | 0.99mi |
| 7750 Jewel Ln #103 Naples, FL | 2.0 | 2.0 | 1102 | $2,100 | $1.91 | 15d | 1 | 1.00mi |
| 7756 Jewel Ln #102 Naples, FL | 2.0 | 2.0 | 1022 | $3,700 | $3.62 | 25d | 1 | 1.02mi |
| 301 Ridge Dr Naples, FL | 2.0 | 2.0 | 900 | $6,000 | $6.67 | 25d | 1 | 1.09mi |
| 501 Forest Lakes Blvd #111 Naples, FL | 2.0 | 2.0 | 919 | $2,300 | $2.50 | 15d | 1 | 1.13mi |
| 499 Forest Lakes Blvd #105 Naples, FL | 2.0 | 2.0 | 919 | $1,950 | $2.12 | 15d | 1 | 1.13mi |
| 300 Forest Lakes Blvd Naples, FL | 2.0 | 2.0 | 842 | $2,700 | $3.21 | 25d | 2 | 1.18mi |
| 400 Forest Lakes Blvd Naples, FL | 2.0 | 2.0 | 842 | $2,350 | $2.79 | 23d | 4 | 1.19mi |
| 200 Forest Lakes Blvd #111 Naples, FL | 2.0 | 2.0 | 842 | $3,100 | $3.68 | 15d | 1 | 1.20mi |
| 100 Forest Lakes Blvd Naples, FL | 1.0–2.0 | 2.0 | 842 | $3,500 | $4.16 | 15d | 3 | 1.21mi |
| 175 Turtle Lake Ct Naples, FL | 1.0–2.0 | 1.0–2.0 | 740 | $1,650 | $2.23 | 15d | 2 | 1.23mi |
| 516 Gordonia Rd Naples, FL | 2.0 | 1.0 | 1100 | $3,200 | $2.91 | 25d | 1 | 1.24mi |
| 150 Turtle Lake Ct #307 Naples, FL | 1.0 | 1.0 | 638 | $1,500 | $2.35 | 25d | 1 | 1.24mi |
| 5301 Summerwind Dr Naples, FL | 1.0–2.0 | 1.0–2.0 | 836 | $1,864 | $2.23 | 15d | 12 | 1.28mi |
| 225 Turtle Lake Ct Naples, FL | 1.0–2.0 | 1.0–2.0 | 740 | $1,900 | $2.57 | 25d | 2 | 1.29mi |
| 5934 Premier Way Naples, FL | 1.0–3.0 | 1.0–3.0 | 1350 | $3,618 | $2.68 | 15d | 29 | 1.31mi |
| 1554 Oyster Catcher Pt Unit C Naples, FL | 2.0 | 2.0 | 1124 | $2,900 | $2.58 | 25d | 1 | 1.36mi |
| 200 Turtle Lake Ct #109 Naples, FL | 2.0 | 2.0 | 842 | $1,295 | $1.54 | 25d | 1 | 1.36mi |
| 170 Turtle Lake Ct Naples, FL | 2.0 | 2.0 | 842 | $2,975 | $3.53 | 15d | 1 | 1.37mi |
| 260 Quail Forest Blvd Naples, FL | 1.0–2.0 | 1.0–2.0 | 875 | $2,533 | $2.89 | 15d | 22 | 1.38mi |
| 1545 Oyster Catcher Pt Unit A Naples, FL | 2.0 | 2.0 | 1124 | $2,200 | $1.96 | 15d | 1 | 1.39mi |
| 200 Cajeput Dr Naples, FL | 1.0 | 1.0 | 750 | $2,500 | $3.33 | 25d | 1 | 1.39mi |
| 1086 Forest Lakes Dr Unit 9303 Naples, FL | 2.0 | 2.0 | 1000 | $2,395 | $2.40 | 15d | 1 | 1.40mi |
| 190 Turtle Lake Ct Unit 6 Naples, FL | 2.0 | 2.0 | 842 | $2,100 | $2.49 | 15d | 1 | 1.42mi |
| 180 Turtle Lake Ct #102 Naples, FL | 2.0 | 2.0 | 842 | $1,850 | $2.20 | 23d | 1 | 1.42mi |
| 287 Quail Forest Blvd #117 Naples, FL | 2.0 | 2.0 | 993 | $1,695 | $1.71 | 15d | 1 | 1.46mi |
HOA detail condo
- Monthly dues
- $665 · $7,980/yr
- Likely covers
- poolgym
- Assessments
- None detected in remarks — confirm with the listing agent.
Listing history 24 events
-
2026-06-21days on market $255,725 Active 35 DOM
-
2026-06-18days on market $255,725 Active 32 DOM
-
2026-06-17days on market $255,725 Active 31 DOM
-
2026-06-16days on market $255,725 Active 30 DOM
-
2026-06-15days on market $255,725 Active 29 DOM
-
2026-06-14days on market $255,725 Active 27 DOM
-
2026-06-10days on market $255,725 Active 24 DOM
-
2026-06-09days on market $255,725 Active 23 DOM
-
2026-06-08days on market $255,725 Active 22 DOM
-
2026-06-07days on market $255,725 Active 21 DOM
-
2026-06-03days on market $255,725 Active 17 DOM
-
2026-06-02days on market $255,725 Active 16 DOM
-
2026-06-01days on market $255,725 Active 15 DOM
-
2026-05-31days on market $255,725 Active 14 DOM
-
2026-05-30days on market $255,725 Active 13 DOM
-
2026-05-11price $255,725 499-char remark
Show marketing remark (499 chars)
Charming first floor condo located in the heart of Naples. Featuring two bedroom, two bathroom floorplan with 920 square feet of updated living space. Enjoy a modern kitchen, upgraded flooring and bathrooms, all completed by the peaceful lake view. Perfect situated just minutes from the beach, shopping's centers, dinning plus located within a highly desirable school zone. Community amenities includes 2 pools , tennis court, and a fitness center. A great blend of Comfort, Location and Lifestyle.
-
2026-04-03$265,000 Active 499-char remark
Show marketing remark (499 chars)
Charming first floor condo located in the heart of Naples. Featuring two bedroom, two bathroom floorplan with 920 square feet of updated living space. Enjoy a modern kitchen, upgraded flooring and bathrooms, all completed by the peaceful lake view. Perfect situated just minutes from the beach, shopping's centers, dinning plus located within a highly desirable school zone. Community amenities includes 2 pools , tennis court, and a fitness center. A great blend of Comfort, Location and Lifestyle.
-
2026-04-03$255,725 Active
Show marketing remark (499 chars)
Charming first floor condo located in the heart of Naples. Featuring two bedroom, two bathroom floorplan with 920 square feet of updated living space. Enjoy a modern kitchen, upgraded flooring and bathrooms, all completed by the peaceful lake view. Perfect situated just minutes from the beach, shopping's centers, dinning plus located within a highly desirable school zone. Community amenities includes 2 pools , tennis court, and a fitness center. A great blend of Comfort, Location and Lifestyle.
-
2026-03-31historical
-
2025-02-10$265,000 Active
-
2009-11-10soldstatus $60,000
-
2009-11-06soldstatus $60,000
-
2009-08-03$69,900
-
2008-08-04$110,000
ⓘ Source: listings_history table (triggers on properties + properties_extension) + one-shot
backfill from property_details.listing_events for pre-trigger history.
Tax reassessment forecast FL · Resets to sale price
- Current annual tax
- $1,751 · $146/mo
- Projected year-2 tax
- $2,123 · $177/mo
- Expected delta
- +$372/yr (+$31/mo · 21.2%)
ⓘ Screening estimate from a state-policy table — verify with the county assessor before closing.
Climate risk First Street
- Flood 4/10 Moderate FEMA zone X (shaded) · 18% chance over 30 yrs
- Wildfire 1/10 Low
- Heat 10/10 Extreme 7 d/yr ≥107°F today · 30 d/yr by 30 yrs out
- Wind 10/10 Extreme 99% chance of damaging wind over 30 yrs
- Air quality 2/10 Low 2 unhealthy d/yr today · 2 by 30 yrs out
Nearby sold comps map
Loading sold comps map…
Walkable amenities ~0.75 mi
Loading nearby amenities…
Taxation est. · year 1
- Rental income
- $25,727
- − Mortgage interest
- −$14,325
- − Property taxes
- −$1,751
- − Insurance
- −$1,279
- − Repairs & maintenance
- −$2,058
- − Management
- −$2,058
- − HOA
- −$7,980
- − Depreciation
- −$7,439
- Taxable loss
- −$11,163
- Est. tax savings @ 24.0%
- +$2,679
- After-tax cash flow
- $-4,099/yr
For passive investors: Depreciation is non-cash, so a rental often shows a tax loss while cash-flowing — sheltering income. Rental losses are passive: they offset passive income freely, and up to $25,000/yr can offset ordinary (W-2) income if you actively participate and your MAGI is under $100k (phasing out to $0 by $150k); unused losses carry forward. On sale, claimed depreciation is recaptured at up to 25%, and gains may owe capital-gains tax (a 1031 exchange can defer both). Figures are a year-1 estimate at your 24.0% rate — not tax advice; consult a CPA.
Schools (NCES district)
- District
- Collier
- NCES district ID
- 1200330
- Math proficiency
- 60% ▼ -4.00%
- Reading proficiency
- 56% ▼ -2.00%
- Median HH income
- $58,275
- Composite
- 50.23/100
- National rank
- #1892
- State rank
- #16 of 73 in FL
Livability — Pine Ridge
- Score
- 67/100
- State rank
- #565
- US rank
- #10798
Category grades
Schools grade is shown separately in the Schools card above.
Census & demographics
- County
- Collier County · 396,295 people
- City population
- 18,514
- Metro
- Naples-Marco Island, FL
- Population (ZIP)
- 27,273
- Household income
- $92,259
- Rent vs Own
- Severe rent burden
- 1712.0
Population outlook (Collier County) Hauer SSP2
- Today (2025)
- 420,858 people
- By 2030
- 450,054 · +6.9%
- By 2040
- 502,232 · +19.3%
- By 2050
- 544,932 · +29.5%
- By 2075
- 627,203 · +49.0%
- By 2100
- 659,015 · +56.6%
Race, ethnicity, and origin ACS 2023
- Neighborhood character
- Predominantly White (78%)
- Race & ethnicity
- White 78% Hispanic / Latino 11% Two or more races 9% Black 4% Asian 4%
- Hispanic origin (detail)
- Mexican 1% Puerto Rican 1% Cuban 3%
- Common ancestry
- Romanian 5% Scotch-Irish 3% Lithuanian 2%
- Foreign-born
- 20% · Canada, Jamaica, Vietnam
- Languages at home
- 77% English-only · Spanish 10% Other Indo-European 5% Russian/Polish/Slavic 3%
Political lean MEDSL · Collier
- 2024 margin
- Solid R (+33.1) · D 33.1% · R 66.2%
- 2008→2024 swing
- -10.6pp toward R · 2008: -22.5pp · 2024: -33.1pp
- All cycles
- 2024: R+33.1 2020: R+24.7 2016: R+26.0 2012: R+30.1 2008: R+22.5
Not yet ingested
- Civics
- —
Market trends
- HPI YoY
- ▲ 0.29%
- Current HPI
- 279.357
- Rent YoY
- ▲ 0.92%
- Metro
- Naples-Marco Island, FL
- State GDP YoY
- ▲ 3.28%
- F500 in state
- 36
Industry mix (Fortune 500 HQ in FL)
| Industry | F500 HQs | Revenue |
|---|---|---|
| Industrial Technology | 2 | $29B |
|
||
| Insurance | 2 | $17B |
|
||
| Retail | 1 | $60B |
|
||
| Technology Distribution | 1 | $58B |
|
||
| Homebuilding | 1 | $35B |
|
||
| Technology Manufacturing | 1 | $35B |
|
||
Price history
+132.5% since first listed9 events — show timeline
- 2026-05-11 Price Changed $255,725 NAPLESMLS
- 2026-04-03 Listed $255,725 MARMLS
- 2026-04-03 Listed $265,000 NAPLESMLS
- 2026-03-31 Listing Removed — NAPLESMLS
- 2025-02-10 Listed $265,000 NAPLESMLS
- 2009-11-10 Sold (Public Records) $60,000 Public Records
- 2009-11-06 Sold (MLS) $60,000 NAPLESMLS
- 2009-08-03 Listed $69,900 NAPLESMLS
- 2008-08-04 Listed $110,000 NAPLESMLS
Property tax history
+8.7%/yrLatest (2025): $1,751 · +4.1% YoY. Source: county tax records.
Cash-flow waterfall
monthlySold comps — $/sqft
last 12 mo · ≤1 miLoading sold comps…