 Fourplex
1269 SE 8th Ter · Cape Coral, FL
Flood risk 5/10 · Moderate
- FEMA flood zone
- X (shaded)
- Chance of flooding over 30 yrs
- 0.36%
- Est. flood insurance / yr
- $507 – $1,088
Fire risk 2/10 · Minimal
- Est. fire insurance / yr
- $947 – $1,759
Heat risk 10/10 · Severe
- Hot days now (above 106°F)
- 7 days/yr
- Hot days in 30 yrs
- 30 days/yr
Wind risk 10/10 · Severe
- Chance of severe wind over 30 yrs
- 99.0%
Air-quality risk 2/10 · Minimal
- Unhealthy air days now
- 1 days/yr
- Unhealthy air days in 30 yrs
- 1 days/yr
Risk factors via First Street. Map © Google.
Why this score? — see what drove the D grade
The composite is a weighted blend of 9 inputs, each scored 0–100. Each bar is that input's sub-score; the figure is the points it added to the 100-point composite (weight × sub-score).
- Cash flow +15.0/30.0
- ARV discount +7.5/15.0
- DSCR +4.6/10.0
- Schools +4.1/10.0
- Livability +3.9/5.0
- 1% rule +3.8/10.0
- Condition / age +2.5/5.0
- Rent growth +0.7/5.0
- Appreciation +0.0/10.0
$659,995
🖨 Deal sheet (PDF) 📄 Offer letter ✓ Due diligence
Multi-family units
County records classify this as Multi-Family (2-4 Unit). Listing-text estimate: 4 units. confirmed
Listing remarks MLS
CENTRAL CAPE ! Walk to the Hospital, close to the mall, parks and all the restaurants !! LARGE Corner lot with shade trees and a location any tenant would like to call HOME. All tile floors, central air and eat in kitchens. SEPARATE water & electric meters and a common COIN laundry $$$ !!! Existing lease rents below current market rates. Excellent, quiet, well vetted tenants in place. (being Professionally managed) * * * * open AVAILABLE!!! * * * *
Key facts
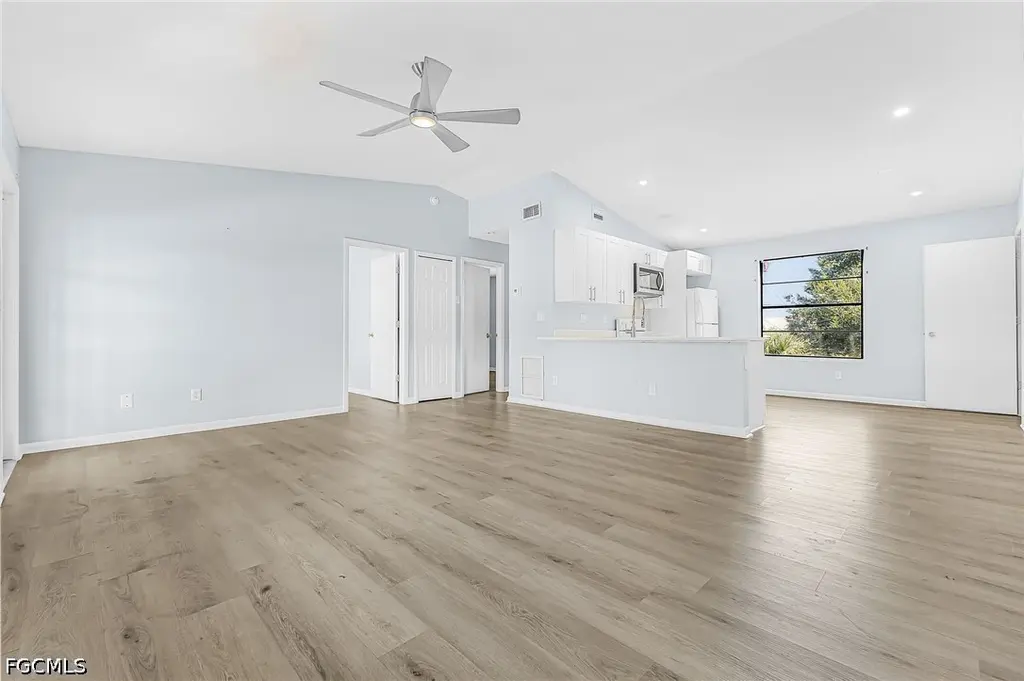
- Open-concept layouts
- Privacy fence
- Updated bathrooms
Tags
Property features AI
Finance
- Other: Pets allowed
- Financial info: Gross scheduled income: $67,200; Operating expenses: $13,301; Unit rents reported around $1,500–$1,600 each (pro forma matches actual rents)
- HOA & community: Non-gated community; No association fee listed
Exterior
- Parking: Parking details not provided
- Security: No security features listed
- Utilities: Cable available; Sewer assessment paid; Water assessment paid; Tenant pays water
- Home design: Multifamily building with 4 total units; Resale property; Zoned RML
- Construction: Stucco construction; Shingle roof
- Exterior features: No notable exterior amenities listed; Oversized lot; Public maintained road
Interior
- Kitchen: Microwave; Range; Refrigerator
- Bedrooms: Four 2-bedroom units (each unit unfurnished)
- Flooring: Vinyl
- Bathrooms: Four full bathrooms (one per unit)
- Heating & cooling: Central heating (electric); Central air conditioning (electric)
- Interior features: Vinyl flooring
- Laundry & utility: Common laundry (in some units)
Neighborhood map
What this means for you Summary
Snapshot
- This is a 4 × 2-bed/1.0-bath units multifamily listed at $660k.
Deal economics
- At list price, monthly cash flow is $207 ($2k/yr) — positive. Per door: $52/mo.
- The deal already cash-flows at list — no discount required.
- To meet the 1% rule (rent ≥ 1% of price), the offer needs to be $581k (12.0% below list).
- Recommended offer: $581k (12.0% below list) — sets the bar for 1% rule.
- Cap rate 6.7% vs local median 3.1% in Cape Coral — top-decile yield for the area; either an underpriced asset or a hidden risk that comps aren't pricing in. Stress-test before assuming the spread holds.
Location & tenants
- Location reads 77/100 on livability (#208 in FL, #3,098 nationally) — a middle-class / working-renter tenant base. Strengths: housing A+, health & safety A+, amenities B+; Watch: commute F.
- Lee (suburban): math 47% / reading 50% proficiency, ranked #42 of 73 in FL (top 58%) — families likely to look elsewhere, expect single-tenant / working-renter base with shorter leases.
- Zoned schools: Gulf Elementary School (math 70% / reading 65%, grade B+, #435 of 2,144 statewide, top 21%, 1,231 students, 38% FRL); Challenger Middle School (math 59% / reading 56%, grade B, #157 of 571 statewide, top 28%, 1,124 students, 50% FRL); Ida S. Baker High School (math 44% / reading 47%, grade D-, #223 of 667 statewide, top 34%, 1,933 students, 39% FRL) — zoned schools average 42% FRL vs 57% district-wide (15 pts lower); this property's tenant base skews higher-income than the district average.
- Market conditions: Rents falling (-7.1%/yr); 476 active listings in the ZIP; 2 comparable units currently listed for rent nearby; 15,411 units permitted in Lee County in 2024 (4,686 in 5+ unit buildings).
- At $5,806/mo this rent would consume 99% of the median local household income ($71k/yr) (locally 1246% of renters already pay >50% of income on rent) — very limited rent-growth headroom before tenants either downsize or default.
Forward outlook
- Local home prices are declining (-3.0%/yr); year-one equity from $5k of loan paydown is wiped out by about $20k of value loss. Plan a longer hold.
- Lee County population projected at +44% by 2050 — long-run rental-demand tailwind backs the buy-and-hold thesis.
Negotiation context
- Only 1 days on market — expect competitive offers; lowballing is unlikely to land.
- 7 sale attempts since 19y ago with the ask held roughly flat each time — persistent listings suggest the price (not the market) is what's stuck; bring a comps-based counter.
Risks & watch-outs
- Climate carrying-cost: moderate flood risk; severe wind risk, 99% chance of damaging wind over 30y; extreme-heat days projected 7→30/yr by 2055 (HVAC capex compounding) — expect insurance premiums to compound above CPI over the hold.
Questions for the listing agent
- Can we see the unit-by-unit rent roll, current vacancy, and any below-market leases? What's the average tenancy length?
- What capital expenditures (roof, boiler, parking lot, exteriors) have been made in the last 5 years, and what's planned in the next 2?
- Is there a deadline driving the sale (1031 exchange, divorce, estate, relocation)? That informs how much negotiation room exists.
- Schools are B-rated — typically a magnet for longer-tenancy family renters. What's the average tenant stay here, and is there a school-zone premium baked into asking?
- The area grade is low — what's the realistic commute time and amenity access for the typical tenant pool here? Any planned neighborhood developments (good or bad) we should know about?
- What's the average days-on-market for RENTAL listings here right now (not sales)? A rising rental-DOM trend means longer vacancies and softer asking-rent achievability than the comps imply.
- What's the recent tenant-quality profile in this submarket — average credit score on applications, eviction rate, late-payment / NSF rate, and stable-employment percentage? A property-management company in the area should have these aggregated.
- How much new apartment / multifamily construction is in the pipeline within 1–3 miles? Heavy new supply (>2% of stock underway) typically softens rents 12–24 months out; light construction supports rent growth.
Investment metrics
- 1% rule
- 0.88% ✗
- Cap rate
- 6.67%
- Cash-on-cash
- 1.35%
- DSCR
- 1.06
- GRM
- 9.5
CMA / ARV
No comps found within radius.
Projected returns pro-forma
-3.0% appreciation · 0.0% rent growth · sell at horizon
- IRR
- -17.5%
- Equity multiple
- 0.40×
- Total profit
- $-110,782
- Equity at exit
- $98,407
- IRR
- -16.2%
- Equity multiple
- 0.21×
- Total profit
- $-145,317
- Equity at exit
- $57,064
Cash invested: $184,799 (down + closing). Projections, not guarantees.
Landlord ↔ Tenant lean methodology
- Overall (STATE)
- 87 Strongly Landlord-Friendly
- State Florida
- 87 Strongly Landlord-Friendly · R+3
- County
- — inherits STATE
- City
- — inherits STATE
ZIP-level market 33990
- Rents YoY
- -7.1%
- Active inventory
- 476
- Price-to-rent
- 37.9×
Monthly cashflow live
- Estimated rent
- $5,806 high interval (Pro) →
- Mortgage (P&I)
- −$3,461
- Tax from tax record
- −$643 /mo · $7,720/yr
- Insurance
- −$275
- HOA
- −$0
- Vacancy / Maint / Mgmt
- −$1,219
- Net cashflow
- $207
Break-even live
Sensitivity live
| Price | -10% $581 | -5% $394 | +0% $207 | +5% $21 | +10% $-166 |
|---|---|---|---|---|---|
| Rent | -10% $-251 | -5% $-22 | +0% $207 | +5% $437 | +10% $666 |
| Rate | -1.0pp $540 | -0.5pp $375 | base $207 | +0.5pp $36 | +1.0pp $-138 |
4-unit breakdown (identical units grouped — click to expand)
| Units | Beds | Baths | Est. rent |
|---|---|---|---|
| 4× units | 2 | 1 | $5,808 |
| #1 | 2 | 1 | $1,452 |
| #2 | 2 | 1 | $1,452 |
| #3 | 2 | 1 | $1,452 |
| #4 | 2 | 1 | $1,452 |
| Total (4 units) | $5,806 | ||
UW: 25.0% down · 7.5% · 30yr · 1.5% tax · 5.0% vac · 8.0% maint · 8.0% mgmt
Financing live
Cash to close
- Down payment
- $164,999
- Closing costs
- $19,800
- Reserves months
- —
- Total cash needed
- —
Loan-product check · same deal, 3 products live
Conventional
25% down · 7.5% · 30yr
- Down + closing
- —
- Monthly P&I
- —
- Monthly cashflow
- —
- DSCR
- —
- Eligible?
- —
Personal DTI + credit; lowest rate.
DSCR
20% down · 8.5% · 30yr
- Down + closing
- —
- Monthly P&I
- —
- Monthly cashflow
- —
- DSCR
- —
- Eligible?
- —
No personal income docs; deal must DSCR.
Hard money
10% down · 12.0% · 12mo
- Down + closing
- —
- Monthly P&I
- —
- Monthly cashflow
- —
- DSCR
- —
- Eligible?
- —
Short-term bridge; refi at stabilization.
Rent comps 2 comps
| Address | Beds | Baths | Sqft | Rent | $/sqft | DOM | Units | Dist |
|---|---|---|---|---|---|---|---|---|
| 15 SE 12th Ave Cape Coral, FL | 5.0 | 2.5 | 2507 | $2,436 | $0.97 | 5d | 1 | 0.99mi |
| 1901 SE 15th Pl Unit A Cape Coral, FL | 4.0 | 2.0 | 2970 | $1,595 | $0.54 | 25d | 1 | 1.39mi |
Listing history 1 events
-
2026-05-31status $659,995 Pending 1 DOM
ⓘ Source: listings_history table (triggers on properties + properties_extension) + one-shot
backfill from property_details.listing_events for pre-trigger history.
Tax reassessment forecast FL · Resets to sale price
- Current annual tax
- $7,720 · $643/mo
- Projected year-2 tax
- $7,720 · $643/mo
- Expected delta
- $0/yr ($0/mo · 0.0%)
ⓘ Screening estimate from a state-policy table — verify with the county assessor before closing.
Climate risk First Street
- Flood 5/10 Major FEMA zone X (shaded) · 36% chance over 30 yrs
- Wildfire 2/10 Low
- Heat 10/10 Extreme 7 d/yr ≥106°F today · 30 d/yr by 30 yrs out
- Wind 10/10 Extreme 99% chance of damaging wind over 30 yrs
- Air quality 2/10 Low 1 unhealthy d/yr today · 1 by 30 yrs out
Nearby sold comps map
Loading sold comps map…
Walkable amenities ~0.75 mi
Loading nearby amenities…
Taxation est. · year 1
- Rental income
- $69,672
- − Mortgage interest
- −$36,970
- − Property taxes
- −$7,720
- − Insurance
- −$3,300
- − Repairs & maintenance
- −$5,574
- − Management
- −$5,574
- − Depreciation
- −$19,200
- Taxable loss
- −$8,665
- Est. tax savings @ 24.0%
- +$2,080
- After-tax cash flow
- $4,568/yr
For passive investors: Depreciation is non-cash, so a rental often shows a tax loss while cash-flowing — sheltering income. Rental losses are passive: they offset passive income freely, and up to $25,000/yr can offset ordinary (W-2) income if you actively participate and your MAGI is under $100k (phasing out to $0 by $150k); unused losses carry forward. On sale, claimed depreciation is recaptured at up to 25%, and gains may owe capital-gains tax (a 1031 exchange can defer both). Figures are a year-1 estimate at your 24.0% rate — not tax advice; consult a CPA.
Schools (NCES district)
- District
- Lee
- NCES district ID
- 1201080
- Math proficiency
- 47% ▼ -11.00%
- Reading proficiency
- 50% ▼ -4.00%
- Median HH income
- $49,518
- Composite
- 41.49/100
- National rank
- #3458
- State rank
- #42 of 73 in FL
Livability — Cape Coral
- Score
- 77/100
- State rank
- #208
- US rank
- #3098
Category grades
Schools grade is shown separately in the Schools card above.
Census & demographics
- Census place
- Cape Coral, FL
- County
- Lee County · 788,662 people
- City population
- 217,388
- Metro
- Cape Coral-Fort Myers, FL
- Population (ZIP)
- 34,713
- Household income
- $70,665
- Rent vs Own
- Severe rent burden
- 1246.0
Population outlook (Lee County) Hauer SSP2
- Today (2025)
- 871,946 people
- By 2030
- 955,468 · +9.6%
- By 2040
- 1,113,587 · +27.7%
- By 2050
- 1,256,891 · +44.1%
- By 2075
- 1,560,270 · +78.9%
- By 2100
- 1,726,848 · +98.0%
Race, ethnicity, and origin ACS 2023
- Neighborhood character
- Majority White (64%)
- Race & ethnicity
- White 64% Hispanic / Latino 26% Two or more races 17% Asian 3% Black 3%
- Hispanic origin (detail)
- Mexican 4% Puerto Rican 5% Cuban 8% Dominican 2%
- Common ancestry
- Romanian 3% Lithuanian 3% Italian 3%
- Foreign-born
- 20% · Canada, Jamaica, China
- Languages at home
- 74% English-only · Spanish 20% Other Indo-European 2% Russian/Polish/Slavic 1%
Political lean MEDSL · Lee
- 2024 margin
- Strong R (+28.4) · D 35.5% · R 63.9%
- 2008→2024 swing
- -18.0pp toward R · 2008: -10.4pp · 2024: -28.4pp
- All cycles
- 2024: R+28.4 2020: R+19.2 2016: R+20.4 2012: R+16.6 2008: R+10.4
Not yet ingested
- Civics
- —
Market trends
- HPI YoY
- ▼ -196.42%
- Current HPI
- 289.1969
- Rent YoY
- ▼ -7.11%
- Metro
- Cape Coral-Fort Myers, FL
- State GDP YoY
- ▲ 3.28%
- F500 in state
- 36
Industry mix (Fortune 500 HQ in FL)
| Industry | F500 HQs | Revenue |
|---|---|---|
| Industrial Technology | 2 | $29B |
|
||
| Insurance | 2 | $17B |
|
||
| Retail | 1 | $60B |
|
||
| Technology Distribution | 1 | $58B |
|
||
| Homebuilding | 1 | $35B |
|
||
| Technology Manufacturing | 1 | $35B |
|
||
Price history
+450.0% since first listed24 events — show timeline
- 2026-05-30 Pending — FORTMLS
- 2026-05-29 Listed $659,995 FORTMLS
- 2024-08-14 Rental Removed $1,600 NAPLESMLS
- 2024-06-06 Listed for Rent $1,600 NAPLESMLS
- 2022-02-21 Sold (Public Records) $660,000 Public Records
- 2022-02-15 Sold (MLS) $660,000 FORTMLS
- 2022-01-22 Pending — FORTMLS
- 2022-01-17 Price Changed $679,900 FORTMLS
- 2021-12-29 Relisted — FORTMLS
- 2021-12-28 Pending — FORTMLS
- 2021-12-16 Price Changed $689,000 FORTMLS
- 2021-12-15 Relisted — FORTMLS
- 2021-09-10 Pending — FORTMLS
- 2021-09-10 Price Changed $675,000 FORTMLS
- 2021-08-30 Relisted — FORTMLS
- 2021-07-29 Pending — FORTMLS
- 2021-07-16 Listed $599,900 FORTMLS
- 2010-07-06 Sold (Public Records) $160,000 Public Records
- 2010-06-30 Sold (MLS) $160,000 FORTMLS
- 2009-10-13 Sold (Public Records) $100,000 Public Records
- 2007-09-21 Listing Removed — FORTMLS
- 2007-03-21 Listed $449,000 FORTMLS
- 1991-05-06 Sold (Public Records) $145,000 Public Records
- 1987-02-17 Sold (Public Records) $120,000 Public Records
Property tax history
+6.5%/yrLatest (2025): $7,720 · +0.7% YoY. Source: county tax records.
Cash-flow waterfall
monthlySold comps — $/sqft
last 12 mo · ≤1 miLoading sold comps…