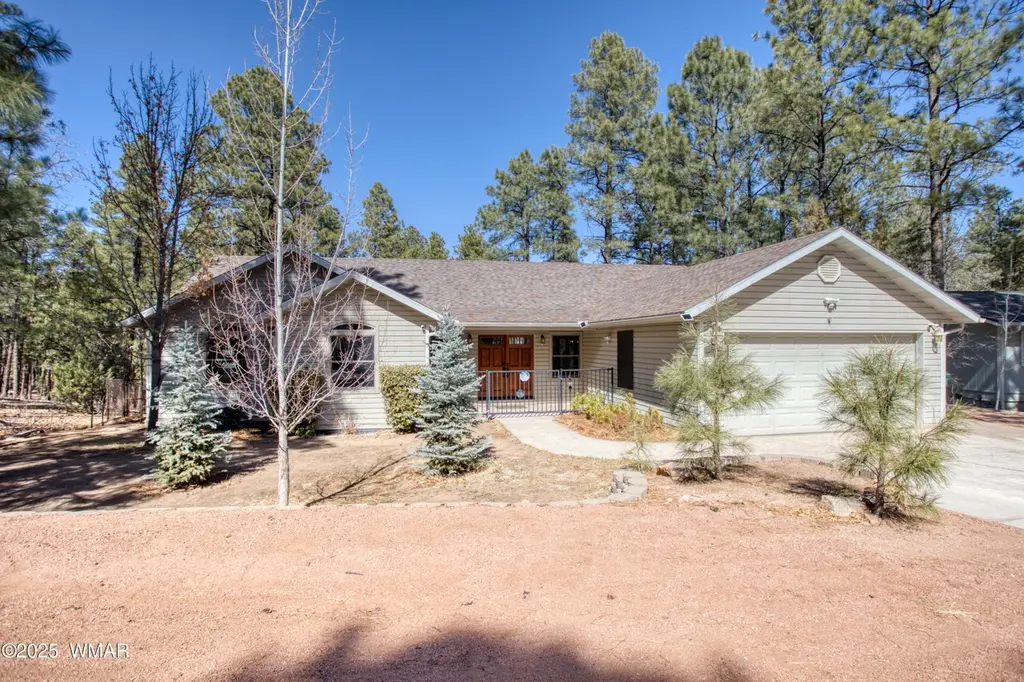
1420 N 41St Dr · Show Low, AZ
Flood risk 1/10 · Minimal
- FEMA flood zone
- X (unshaded)
- Chance of flooding over 30 yrs
- 0.0%
- Est. flood insurance / yr
- $507 – $1,088
Fire risk 5/10 · Moderate
- Est. fire insurance / yr
- $610 – $1,132
Heat risk 2/10 · Minimal
- Hot days now (above 89°F)
- 7 days/yr
- Hot days in 30 yrs
- 19 days/yr
Wind risk 1/10 · Minimal
- Chance of severe wind over 30 yrs
- —
Air-quality risk 2/10 · Minimal
- Unhealthy air days now
- 1 days/yr
- Unhealthy air days in 30 yrs
- 1 days/yr
Risk factors via First Street. Map © Google.
Why this score? — see what drove the F grade
The composite is a weighted blend of 9 inputs, each scored 0–100. Each bar is that input's sub-score; the figure is the points it added to the 100-point composite (weight × sub-score).
- ARV discount +15.0/15.0
- Cash flow +3.3/30.0
- Livability +3.2/5.0
- Schools +3.0/10.0
- Rent growth +2.5/5.0
- Condition / age +2.5/5.0
- 1% rule +0.0/10.0
- DSCR +0.0/10.0
- Appreciation +0.0/10.0
$598,000
🖨 Deal sheet 📄 Offer letter ✓ Due diligence
Listing remarks MLS
**NEW ROOF** Space, Privacy & Versatility are key in this thoughtfully designed Country Club Manor gem! Step inside to an open floor plan, perfect for easy living and entertaining. The main level features a spacious kitchen with a double oven, a primary bedroom with an en-suite, guest rooms, a guest bathroom, and a versatile office space. Downstairs, you'll find a generous walk-out living area, complete with a second kitchen, stainless steel countertops, additional bedrooms, a bathroom, laundry, and plenty of storage space. Outside, enjoy a large covered deck overlooking a private, fenced yard with fruit trees and towering pines--an ideal space for relaxation or entertaining. Recent upgrades include energy-efficient Anderson windows & doors, new metal railings on the deck & patio,
Key facts
- Second kitchen
- Walk-out living area
- Large covered deck
Tags
Neighborhood map
What this means for you Summary
Snapshot
- This is a 5-bed/3.0-bath single-family listed at $598k.
Deal economics
- At list price, monthly cash flow is $-2k ($-22k/yr) — negative.
- To cash-flow at today's rent, offer at most $268k (55.1% below list).
- To meet the 1% rule (rent ≥ 1% of price), the offer needs to be $220k (63.2% below list).
- Recommended offer: $220k (63.2% below list) — sets the bar for 1% rule.
- Cap rate 2.5% vs local median 3.3% in Show Low — below-typical yield; the buyer is paying a premium for something (appreciation thesis, condition, location) that the cap rate doesn't capture.
Location & tenants
- Location reads 65/100 on livability (#90 in AZ) — a middle-class / working-renter tenant base. Strengths: cost of living A+, housing A+; Watch: employment D, crime F, amenities F.
- Show Low Unified District (4393) (rural): math 32% / reading 39% proficiency, ranked #89 of 249 in AZ (top 36%) — families likely to look elsewhere, expect single-tenant / working-renter base with shorter leases.
- Market conditions: 891 active listings in the ZIP; 485 units permitted in Navajo County in 2024 (11 in 5+ unit buildings).
Forward outlook
- Local home prices are declining (-3.0%/yr); year-one equity from $4k of loan paydown is wiped out by about $18k of value loss. Plan a longer hold.
- Navajo County population projected at -16% by 2050 — secular population decline; favor cash flow + early exit over multi-decade hold.
Negotiation context
- It's been on market 97 days — a 9% lower offer ($544k) is reasonable based on typical stale-listing flexibility.
- 2 sale attempts since 2y ago; this cycle's ask has dropped $52k (8%) from the opening price — seller is motivated, your offer sets the floor, not the list.
- Current owner paid $315k; list at $598k implies a 90% gain — meaningful room to come down on a strong offer.
Risks & watch-outs
- Climate carrying-cost: moderate wildfire risk — expect insurance premiums to compound above CPI over the hold.
Questions for the listing agent
- What do current leases actually rent for vs. the listed asking? Can we see a recent rent roll and the last 12 months of T-12 income?
- It's been on market 97 days. Have you received any prior offers? Is the seller open to a 63% concession, seller financing, or rate buy-down credit?
- Why hasn't it sold? Are there any deal-killer items the seller is aware of (foundation, flood, title, zoning, code violations)?
- Is there a deadline driving the sale (1031 exchange, divorce, estate, relocation)? That informs how much negotiation room exists.
- Schools are B-rated — typically a magnet for longer-tenancy family renters. What's the average tenant stay here, and is there a school-zone premium baked into asking?
- Crime grade is F in this area — have there been break-ins, vandalism, or insurance claims at this property in the last 3 years? What carrier currently insures it and at what premium?
- The area grade is low — what's the realistic commute time and amenity access for the typical tenant pool here? Any planned neighborhood developments (good or bad) we should know about?
- What's the average days-on-market for RENTAL listings here right now (not sales)? A rising rental-DOM trend means longer vacancies and softer asking-rent achievability than the comps imply.
- What's the recent tenant-quality profile in this submarket — average credit score on applications, eviction rate, late-payment / NSF rate, and stable-employment percentage? A property-management company in the area should have these aggregated.
- How much new for-sale + rental construction is in the pipeline within 1–3 miles? Heavy new supply typically softens prices + rents 12–24 months out; constrained supply supports both.
Investment metrics
- 1% rule
- 0.37% ✗
- Cap rate
- 2.55%
- Cash-on-cash
- -13.37%
- DSCR
- 0.41
- GRM
- 22.6
CMA / ARV
- ARV (median comp)
- $827,400
- List price
- $598,000
- Delta
- -27.73%
- Verdict
- UNDERPRICED
- Comps
- 20 within 1.0 mi
Show comp detail 1 sale within ~0.75 mi
| Address | Dist | Beds/Ba | Sqft | Sold | Price | $/sf | Match |
|---|---|---|---|---|---|---|---|
| 4530 W Fox Glove Ln | 0.69mi | 4/4.5 (-1) | 4,077 (-3%) | 18mo | $1,250,000 | $307 | 37 |
Match score weights: distance 35% · size 25% · config 20% · recency 20%. Top-matched comps best support the ARV.
Projected returns pro-forma
-3.0% appreciation · 3.0% rent growth · sell at horizon
- IRR
- -41.5%
- Equity multiple
- -0.29×
- Total profit
- $-216,010
- Equity at exit
- $89,164
- IRR
- -70.1%
- Equity multiple
- -1.04×
- Total profit
- $-342,274
- Equity at exit
- $51,704
Cash invested: $167,440 (down + closing). Projections, not guarantees.
Landlord ↔ Tenant lean methodology
- Overall (STATE)
- 87 Strongly Landlord-Friendly
- State Arizona
- 87 Strongly Landlord-Friendly · R+3
- County
- — inherits STATE
- City
- — inherits STATE
ZIP-level market 85901
- Home prices YoY
- -14.5%
- Active inventory
- 891
- Price-to-rent
- 22.6×
Monthly cashflow live
- Estimated rent
- $2,203 medium interval (Pro) →
- Mortgage (P&I)
- −$3,136
- Tax from tax record
- −$221 /mo · $2,652/yr
- Insurance
- −$249
- HOA
- −$0
- Vacancy / Maint / Mgmt
- −$463
- Net cashflow
- $-1,866
Break-even live
UW: 25.0% down · 7.5% · 30yr · 1.5% tax · 5.0% vac · 8.0% maint · 8.0% mgmt
Financing live
Cash to close
- Down payment
- $149,500
- Closing costs
- $17,940
- Reserves months
- —
- Total cash needed
- —
Loan-product check · same deal, 3 products live
Conventional
25% down · 7.5% · 30yr
- Down + closing
- —
- Monthly P&I
- —
- Monthly cashflow
- —
- DSCR
- —
- Eligible?
- —
Personal DTI + credit; lowest rate.
DSCR
20% down · 8.5% · 30yr
- Down + closing
- —
- Monthly P&I
- —
- Monthly cashflow
- —
- DSCR
- —
- Eligible?
- —
No personal income docs; deal must DSCR.
Hard money
10% down · 12.0% · 12mo
- Down + closing
- —
- Monthly P&I
- —
- Monthly cashflow
- —
- DSCR
- —
- Eligible?
- —
Short-term bridge; refi at stabilization.
Listing history 26 events
-
2026-06-19days on market $598,000 Active 97 DOM
-
2026-06-18days on market $598,000 Active 96 DOM
-
2026-06-17days on market $598,000 Active 95 DOM
-
2026-06-16days on market $598,000 Active 94 DOM
-
2026-06-15days on market $598,000 Active 93 DOM
-
2026-06-14days on market $598,000 Active 91 DOM
-
2026-06-13price $598,000 Active 90 DOM
-
2026-06-12days on market $650,000 Active 90 DOM
-
2026-06-09days on market $650,000 Active 87 DOM
-
2026-06-08days on market $650,000 Active 86 DOM
-
2026-06-07days on market $650,000 Active 85 DOM
-
2026-06-07days on market $650,000 Active 84 DOM
-
2026-06-04days on market $650,000 Active 81 DOM
-
2026-06-02days on market $650,000 Active 80 DOM
-
2026-06-01days on market $650,000 Active 79 DOM
-
2026-05-31days on market $650,000 Active 78 DOM
-
2026-05-31days on market $650,000 Active 77 DOM
-
2026-03-15$650,000 Active 803-char remark
Show marketing remark (803 chars)
**NEW ROOF** Space, Privacy & Versatility are key in this thoughtfully designed Country Club Manor gem! Step inside to an open floor plan, perfect for easy living and entertaining. The main level features a spacious kitchen with a double oven, a primary bedroom with an en-suite, guest rooms, a guest bathroom, and a versatile office space. Downstairs, you'll find a generous walk-out living area, complete with a second kitchen, stainless steel countertops, additional bedrooms, a bathroom, laundry, and plenty of storage space. Outside, enjoy a large covered deck overlooking a private, fenced yard with fruit trees and towering pines--an ideal space for relaxation or entertaining. Recent upgrades include energy-efficient Anderson windows & doors, new metal railings on the deck & patio,
-
2025-11-04price $689,000
-
2025-07-14price $694,000
-
2025-06-12price $699,000
-
2024-10-23historical
-
2024-07-19price $875,000
-
2024-07-19price $875,000
-
2024-07-04$899,000 Active
-
2009-07-17soldstatus $315,000
ⓘ Source: listings_history table (triggers on properties + properties_extension) + one-shot
backfill from property_details.listing_events for pre-trigger history.
Tax reassessment forecast AZ · Resets to sale price
- Current annual tax
- $2,652 · $221/mo
- Projected year-2 tax
- $3,947 · $329/mo
- Expected delta
- +$1,295/yr (+$108/mo · 48.8%)
ⓘ Screening estimate from a state-policy table — verify with the county assessor before closing.
Climate risk First Street
- Flood 1/10 Low FEMA zone X (unshaded) · 0% chance over 30 yrs
- Wildfire 5/10 Major
- Heat 2/10 Low 7 d/yr ≥89°F today · 19 d/yr by 30 yrs out
- Wind 1/10 Low
- Air quality 2/10 Low 1 unhealthy d/yr today · 1 by 30 yrs out
Nearby sold comps map
Loading sold comps map…
Walkable amenities ~0.75 mi
Loading nearby amenities…
Taxation est. · year 1
- Rental income
- $26,440
- − Mortgage interest
- −$33,497
- − Property taxes
- −$2,652
- − Insurance
- −$2,990
- − Repairs & maintenance
- −$2,115
- − Management
- −$2,115
- − Depreciation
- −$17,396
- Taxable loss
- −$34,327
- Est. tax savings @ 24.0%
- +$8,238
- After-tax cash flow
- $-14,148/yr
For passive investors: Depreciation is non-cash, so a rental often shows a tax loss while cash-flowing — sheltering income. Rental losses are passive: they offset passive income freely, and up to $25,000/yr can offset ordinary (W-2) income if you actively participate and your MAGI is under $100k (phasing out to $0 by $150k); unused losses carry forward. On sale, claimed depreciation is recaptured at up to 25%, and gains may owe capital-gains tax (a 1031 exchange can defer both). Figures are a year-1 estimate at your 24.0% rate — not tax advice; consult a CPA.
Schools (NCES district)
- District
- Show Low Unified District (4393)
- NCES district ID
- 0407700
- Math proficiency
- 32% ▼ -9.00%
- Reading proficiency
- 39% ▼ -4.00%
- Median HH income
- $41,240
- Composite
- 29.9/100
- National rank
- #6387
- State rank
- #89 of 249 in AZ
Livability — Show Low
- Score
- 65/100
- State rank
- #90
- US rank
- #13573
Category grades
Schools grade is shown separately in the Schools card above.
Census & demographics
- Census place
- Show Low, AZ
- City population
- 18,821
- Population (ZIP)
- 18,821
Population outlook (Navajo County) Hauer SSP2
- Today (2025)
- 105,760 people
- By 2030
- 103,301 · -2.3%
- By 2040
- 97,070 · -8.2%
- By 2050
- 88,850 · -16.0%
- By 2075
- 65,180 · -38.4%
- By 2100
- 37,281 · -64.7%
Race, ethnicity, and origin ACS 2023
- Neighborhood character
- Predominantly White (77%)
- Race & ethnicity
- White 77% Hispanic / Latino 16% Two or more races 11% Native American 2%
- Hispanic origin (detail)
- Mexican 12%
- Common ancestry
- Slovak 2% Lithuanian 2% Italian 2%
- Foreign-born
- 4% · Canada
- Languages at home
- 92% English-only · Spanish 7% Tagalog/Filipino 1%
Political lean MEDSL · Navajo
- 2024 margin
- R (+17.2) · D 40.9% · R 58.1%
- 2008→2024 swing
- -5.5pp toward R · 2008: -11.7pp · 2024: -17.2pp
- All cycles
- 2024: R+17.2 2020: R+8.2 2016: R+7.9 2012: R+8.4 2008: R+11.7
Not yet ingested
- Civics
- —
Market trends
- HPI YoY
- ▼ -65.52%
- Current HPI
- 386.3007
- Rent YoY
- —
- Metro
- —
- State GDP YoY
- ▲ 4.54%
- F500 in state
- 20
Industry mix (Fortune 500 HQ in AZ)
| Industry | F500 HQs | Revenue |
|---|---|---|
| Technology | 2 | $13B |
|
||
| Mining / Metals | 1 | $23B |
|
||
| Environmental Services | 1 | $16B |
|
||
| Metals / Steel | 1 | $14B |
|
||
| Technology Distribution | 1 | $9B |
|
||
| Homebuilding | 1 | $8B |
|
||
Price history
+106.3% since first listed9 events — show timeline
- 2026-03-15 Listed $650,000 WMMLS
- 2025-11-04 Price Changed $689,000 WMMLS
- 2025-07-14 Price Changed $694,000 WMMLS
- 2025-06-12 Price Changed $699,000 WMMLS
- 2024-10-23 Listing Removed — ARMLS
- 2024-07-19 Price Changed $875,000 WMMLS
- 2024-07-19 Price Changed $875,000 ARMLS
- 2024-07-04 Listed $899,000 ARMLS
- 2009-07-17 Sold (Public Records) $315,000 Public Records
Property tax history
+4.0%/yrLatest (2025): $2,652 · +4.3% YoY. Source: county tax records.
Cash-flow waterfall
monthlySold comps — $/sqft
last 12 mo · ≤1 miLoading sold comps…