 Multi-family
14 Stevens St · Glens Falls, NY
Flood risk 1/10 · Minimal
- FEMA flood zone
- X
- Chance of flooding over 30 yrs
- 0.0%
- Est. flood insurance / yr
- $473 – $860
Fire risk 2/10 · Minimal
- Est. fire insurance / yr
- $691 – $1,283
Heat risk 3/10 · Minor
- Hot days now (above 96°F)
- 7 days/yr
- Hot days in 30 yrs
- 16 days/yr
Wind risk 2/10 · Minimal
- Chance of severe wind over 30 yrs
- 3.0%
Air-quality risk 1/10 · Minimal
- Unhealthy air days now
- 0 days/yr
- Unhealthy air days in 30 yrs
- 0 days/yr
Risk factors via First Street. Map © Google.
Why this score? — see what drove the B grade
The composite is a weighted blend of 9 inputs, each scored 0–100. Each bar is that input's sub-score; the figure is the points it added to the 100-point composite (weight × sub-score).
- Cash flow +30.0/30.0
- 1% rule +10.0/10.0
- DSCR +10.0/10.0
- ARV discount +7.5/15.0
- Livability +4.2/5.0
- Schools +4.1/10.0
- Rent growth +2.5/5.0
- Condition / age +2.5/5.0
- Appreciation +0.0/10.0
$105,000
🖨 Deal sheet (PDF) 📄 Offer letter ✓ Due diligence
Multi-family units
County records classify this as Multi-Family (2-4 Unit). Listing-text estimate: 1 unit. estimate disagrees with records
Listing remarks MLS
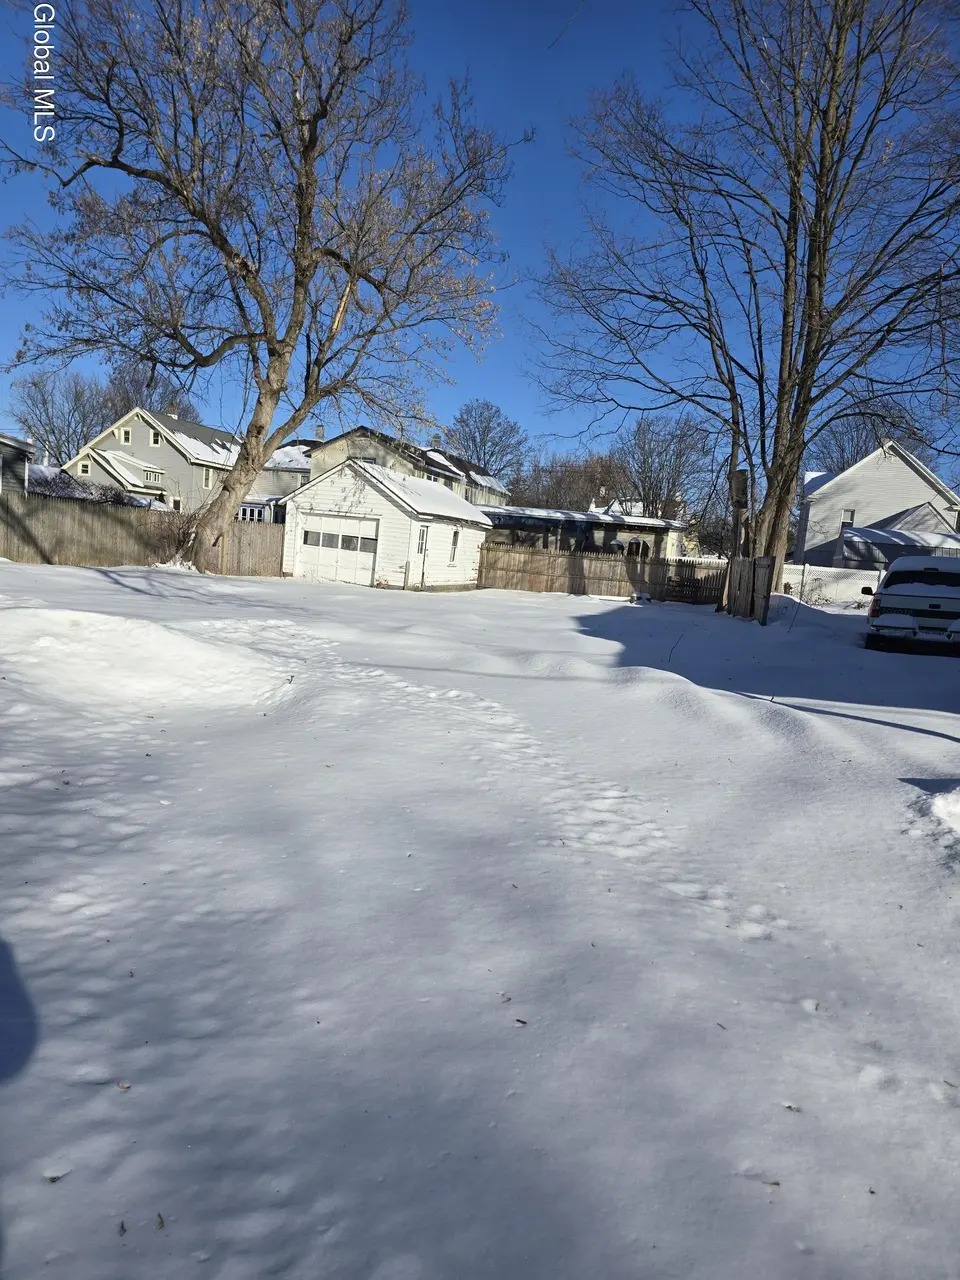
Prime location! That is all you will think pulling up to this lot to build your new home. You couldn't ask for a better location in this walking district. There are not too many spot like this available. Previously this had a duplex on site and the Garage is remaining. The land had been filled in since the fire and is ready to be built on.
Key facts
- Garage remaining
- Walking district
- Prime location
Tags
Neighborhood map
What this means for you Summary
Snapshot
- This is a 4-bed/2.0-bath multifamily listed at $105k.
Deal economics
- At list price, monthly cash flow is $1k ($12k/yr) — positive.
- The deal already cash-flows at list — no discount required.
- Meets the 1% rule at list price ($2k rent vs $105k).
- Recommended offer: $92k (12.0% below list) — sets the bar for market timing.
- Cap rate 17.8% vs local median 4.8% in Glens Falls — top-decile yield for the area; either an underpriced asset or a hidden risk that comps aren't pricing in. Stress-test before assuming the spread holds.
Location & tenants
- Location reads 83/100 on livability (#60 in NY, #894 nationally) — a professional / high-income tenant draw. Strengths: crime A+, amenities A+, housing A+.
- Glens Falls City School District (urban): math 44% / reading 53% proficiency, ranked #416 of 590 in NY (top 70%) — families likely to look elsewhere, expect single-tenant / working-renter base with shorter leases.
- Market conditions: 56 active listings in the ZIP; 1 comparable units currently listed for rent nearby; 180 units permitted in Warren County in 2024 (40 in 5+ unit buildings).
- This rent runs 39% of the median local income ($68k/yr) — at the standard rent-burdened threshold; future hikes will face affordability resistance.
Forward outlook
- Local home prices are declining (-3.0%/yr); year-one equity from $726 of loan paydown is wiped out by about $3k of value loss. Plan a longer hold.
- Warren County population projected at -19% by 2050 — secular population decline; favor cash flow + early exit over multi-decade hold.
- At projected returns (-3.0% appreciation + 3.0% rent growth), your $29k cash investment doubles in ~3 years — after that, you're playing with house money.
Negotiation context
- It's been on market 136 days — a 12% lower offer ($92k) is reasonable based on typical stale-listing flexibility.
Questions for the listing agent
- It's been on market 136 days. Have you received any prior offers? Is the seller open to a 12% concession, seller financing, or rate buy-down credit?
- Why hasn't it sold? Are there any deal-killer items the seller is aware of (foundation, flood, title, zoning, code violations)?
- Is there a deadline driving the sale (1031 exchange, divorce, estate, relocation)? That informs how much negotiation room exists.
- What's the average days-on-market for RENTAL listings here right now (not sales)? A rising rental-DOM trend means longer vacancies and softer asking-rent achievability than the comps imply.
- What's the recent tenant-quality profile in this submarket — average credit score on applications, eviction rate, late-payment / NSF rate, and stable-employment percentage? A property-management company in the area should have these aggregated.
- How much new apartment / multifamily construction is in the pipeline within 1–3 miles? Heavy new supply (>2% of stock underway) typically softens rents 12–24 months out; light construction supports rent growth.
Investment metrics
- 1% rule
- 2.09% ✓
- Cap rate
- 17.83%
- Cash-on-cash
- 41.22%
- DSCR
- 2.83
- GRM
- 4.0
CMA / ARV
- ARV (median comp)
- $273,386
- List price
- $105,000
- Delta
- -61.59%
- Verdict
- UNDERPRICED
- Comps
- 20 within 1.0 mi
Show comp detail 9 sales within ~0.75 mi
| Address | Dist | Beds/Ba | Sqft | Sold | Price | $/sf | Match |
|---|---|---|---|---|---|---|---|
| 89 Montcalm St | 0.07mi | 4/3.0 | 1,792 (0%) | 18mo | $274,900 | $153 | 78 |
| 65 1st St | 0.30mi | 4/3.0 | 1,792 (0%) | 6mo | $297,900 | $166 | 77 |
| 143 Sherman Ave | 0.18mi | 3/2.0 (-1) | 1,711 (-4%) | 13mo | $280,000 | $164 | 68 |
| 20 Elizabeth St | 0.26mi | 4/2.5 | 1,867 (+4%) | 17mo | $330,000 | $177 | 65 |
| 26 Knight St | 0.71mi | 4/2.0 | 1,634 (-9%) | 2mo | $152,000 | $93 | 51 |
| 33 Grant Ave | 0.50mi | 4/2.0 | 1,688 (-6%) | 24mo | $290,000 | $172 | 47 |
| 5 Division St | 0.46mi | 4/2.0 | 1,624 (-9%) | 19mo | $120,000 | $74 | 47 |
| 7 Mission St | 0.29mi | 5/2.0 (+1) | 1,576 (-12%) | 19mo | $185,000 | $117 | 45 |
| 5 Second St | 0.52mi | 3/2.0 (-1) | 1,700 (-5%) | 22mo | $229,000 | $135 | 44 |
Match score weights: distance 35% · size 25% · config 20% · recency 20%. Top-matched comps best support the ARV.
Projected returns pro-forma
-3.0% appreciation · 3.0% rent growth · sell at horizon
- IRR
- 37.8%
- Equity multiple
- 2.61×
- Total profit
- $47,336
- Equity at exit
- $15,656
- IRR
- 44.3%
- Equity multiple
- 5.22×
- Total profit
- $124,173
- Equity at exit
- $9,078
Cash invested: $29,400 (down + closing). Projections, not guarantees.
Landlord ↔ Tenant lean methodology
- Overall (STATE)
- 15 Strongly Tenant-Friendly
- State New York
- 15 Strongly Tenant-Friendly · D+10
- County
- — inherits STATE
- City
- — inherits STATE
ZIP-level market 12801
- Home prices YoY
- -13.7%
- Active inventory
- 56
- Price-to-rent
- 4.0×
Monthly cashflow live
- Estimated rent
- $2,197 medium interval (Pro) →
- Mortgage (P&I)
- −$551
- Tax est. 1.5%
- −$131 /mo · $1,575/yr
- Insurance
- −$44
- HOA
- −$0
- Vacancy / Maint / Mgmt
- −$461
- Net cashflow
- $1,010
Break-even live
Sensitivity live
| Price | -10% $1,082 | -5% $1,046 | +0% $1,010 | +5% $974 | +10% $937 |
|---|---|---|---|---|---|
| Rent | -10% $836 | -5% $923 | +0% $1,010 | +5% $1,097 | +10% $1,183 |
| Rate | -1.0pp $1,063 | -0.5pp $1,037 | base $1,010 | +0.5pp $983 | +1.0pp $955 |
UW: 25.0% down · 7.5% · 30yr · 1.5% tax · 5.0% vac · 8.0% maint · 8.0% mgmt
Financing live
Cash to close
- Down payment
- $26,250
- Closing costs
- $3,150
- Reserves months
- —
- Total cash needed
- —
Loan-product check · same deal, 3 products live
Conventional
25% down · 7.5% · 30yr
- Down + closing
- —
- Monthly P&I
- —
- Monthly cashflow
- —
- DSCR
- —
- Eligible?
- —
Personal DTI + credit; lowest rate.
DSCR
20% down · 8.5% · 30yr
- Down + closing
- —
- Monthly P&I
- —
- Monthly cashflow
- —
- DSCR
- —
- Eligible?
- —
No personal income docs; deal must DSCR.
Hard money
10% down · 12.0% · 12mo
- Down + closing
- —
- Monthly P&I
- —
- Monthly cashflow
- —
- DSCR
- —
- Eligible?
- —
Short-term bridge; refi at stabilization.
Rent comps 1 comps
| Address | Beds | Baths | Sqft | Rent | $/sqft | DOM | Units | Dist |
|---|---|---|---|---|---|---|---|---|
| 492 Glen St Glens Falls, NY | 3.0 | 1.5 | 1912 | $2,650 | $1.39 | 44d | 1 | 0.64mi |
Listing history 17 events
-
2026-06-19days on market $105,000 Active 136 DOM
-
2026-06-18days on market $105,000 Active 135 DOM
-
2026-06-17days on market $105,000 Active 134 DOM
-
2026-06-16days on market $105,000 Active 133 DOM
-
2026-06-15days on market $105,000 Active 132 DOM
-
2026-06-14days on market $105,000 Active 130 DOM
-
2026-06-12days on market $105,000 Active 129 DOM
-
2026-06-09days on market $105,000 Active 126 DOM
-
2026-06-08days on market $105,000 Active 125 DOM
-
2026-06-07days on market $105,000 Active 124 DOM
-
2026-06-04days on market $105,000 Active 120 DOM
-
2026-06-02days on market $105,000 Active 119 DOM
-
2026-06-01days on market $105,000 Active 118 DOM
-
2026-05-31days on market $105,000 Active 117 DOM
-
2026-05-31days on market $105,000 Active 116 DOM
-
2026-04-14price $105,000 341-char remark
Show marketing remark (341 chars)
Prime location! That is all you will think pulling up to this lot to build your new home. You couldn't ask for a better location in this walking district. There are not too many spot like this available. Previously this had a duplex on site and the Garage is remaining. The land had been filled in since the fire and is ready to be built on.
-
2026-02-03$120,000 Active 341-char remark
Show marketing remark (341 chars)
Prime location! That is all you will think pulling up to this lot to build your new home. You couldn't ask for a better location in this walking district. There are not too many spot like this available. Previously this had a duplex on site and the Garage is remaining. The land had been filled in since the fire and is ready to be built on.
ⓘ Source: listings_history table (triggers on properties + properties_extension) + one-shot
backfill from property_details.listing_events for pre-trigger history.
Climate risk First Street
- Flood 1/10 Low FEMA zone X · 0% chance over 30 yrs
- Wildfire 2/10 Low
- Heat 3/10 Moderate 7 d/yr ≥96°F today · 16 d/yr by 30 yrs out
- Wind 2/10 Low 3% chance of damaging wind over 30 yrs
- Air quality 1/10 Low 0 unhealthy d/yr today · 0 by 30 yrs out
Nearby sold comps map
Loading sold comps map…
Walkable amenities ~0.75 mi
Loading nearby amenities…
Taxation est. · year 1
- Rental income
- $26,362
- − Mortgage interest
- −$5,882
- − Property taxes
- −$1,575
- − Insurance
- −$525
- − Repairs & maintenance
- −$2,109
- − Management
- −$2,109
- − Depreciation
- −$3,055
- Taxable income
- $11,108
- Est. tax owed @ 24.0%
- −$2,666
- After-tax cash flow
- $9,452/yr
For passive investors: Depreciation is non-cash, so a rental often shows a tax loss while cash-flowing — sheltering income. Rental losses are passive: they offset passive income freely, and up to $25,000/yr can offset ordinary (W-2) income if you actively participate and your MAGI is under $100k (phasing out to $0 by $150k); unused losses carry forward. On sale, claimed depreciation is recaptured at up to 25%, and gains may owe capital-gains tax (a 1031 exchange can defer both). Figures are a year-1 estimate at your 24.0% rate — not tax advice; consult a CPA.
Schools (NCES district)
- District
- Glens Falls City School District
- NCES district ID
- 3612240
- Math proficiency
- 44% ▼ -8.00%
- Reading proficiency
- 53% ▲ 6.00%
- Median HH income
- $48,216
- Composite
- 41.34/100
- National rank
- #3499
- State rank
- #416 of 590 in NY
Livability — Glens Falls
- Score
- 83/100
- State rank
- #60
- US rank
- #894
Category grades
Schools grade is shown separately in the Schools card above.
Census & demographics
- Census place
- Glens Falls, NY
- County
- Warren County · 14,628 people
- City population
- 14,628
- Metro
- Glens Falls, NY
- Population (ZIP)
- 14,628
- Household income
- $67,577
- Rent vs Own
- Severe rent burden
- 866.0
Population outlook (Warren County) Hauer SSP2
- Today (2025)
- 62,372 people
- By 2030
- 60,491 · -3.0%
- By 2040
- 55,616 · -10.8%
- By 2050
- 50,437 · -19.1%
- By 2075
- 40,843 · -34.5%
- By 2100
- 31,159 · -50.0%
Race, ethnicity, and origin ACS 2023
- Neighborhood character
- Predominantly White (90%)
- Race & ethnicity
- White 90% Two or more races 6% Hispanic / Latino 3% Black 2%
- Common ancestry
- Lithuanian 9% Romanian 5% Slovak 5%
- Foreign-born
- 3% · Canada, Dominican Republic
- Languages at home
- 97% English-only · Spanish 1% German/W. Germanic 1%
Political lean MEDSL · Warren
- 2024 margin
- Toss-up / Even · D 47.9% · R 52.1%
- 2008→2024 swing
- -6.9pp toward R · 2008: 2.6pp · 2024: -4.2pp
- All cycles
- 2024: R+4.2 2020: R+0.2 2016: R+10.6 2012: D+2.1 2008: D+2.6
Not yet ingested
- Civics
- —
Market trends
- HPI YoY
- ▼ -52.28%
- Current HPI
- 330.581
- Rent YoY
- —
- Metro
- Glens Falls, NY
- State GDP YoY
- ▲ 2.60%
- F500 in state
- 92
Industry mix (Fortune 500 HQ in NY)
| Industry | F500 HQs | Revenue |
|---|---|---|
| Financial Services | 10 | $950B |
|
||
| Consumer Goods | 9 | $162B |
|
||
| Insurance | 4 | $225B |
|
||
| Telecommunications | 2 | $144B |
|
||
| Pharmaceuticals | 2 | $112B |
|
||
| Media / Entertainment | 2 | $69B |
|
||
Price history
-12.5% since first listed2 events — show timeline
- 2026-04-14 Price Changed $105,000 Global MLS
- 2026-02-03 Listed $120,000 Global MLS
Property tax history
+10.5%/yrLatest (2025): $5,664 · +1.0% YoY. Source: county tax records.
Cash-flow waterfall
monthlySold comps — $/sqft
last 12 mo · ≤1 miLoading sold comps…