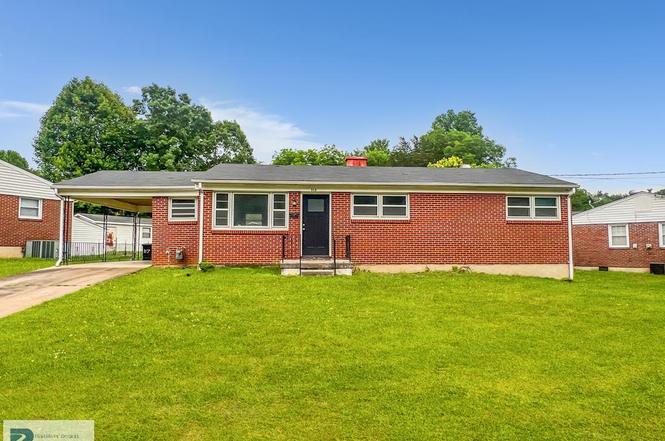
117 Capri Ct · Danville, VA
Flood risk 1/10 · Minimal
- FEMA flood zone
- X (unshaded)
- Chance of flooding over 30 yrs
- 0.0%
- Est. flood insurance / yr
- $473 – $860
Fire risk 1/10 · Minimal
- Est. fire insurance / yr
- $666 – $1,236
Heat risk 6/10 · Moderate
- Hot days now (above 105°F)
- 7 days/yr
- Hot days in 30 yrs
- 18 days/yr
Wind risk 3/10 · Minor
- Chance of severe wind over 30 yrs
- 7.0%
Air-quality risk 2/10 · Minimal
- Unhealthy air days now
- 0 days/yr
- Unhealthy air days in 30 yrs
- 1 days/yr
Risk factors via First Street. Map © Google.
Why this score? — see what drove the F grade
The composite is a weighted blend of 9 inputs, each scored 0–100. Each bar is that input's sub-score; the figure is the points it added to the 100-point composite (weight × sub-score).
- Cash flow +11.4/30.0
- Livability +3.9/5.0
- DSCR +3.3/10.0
- Schools +3.0/10.0
- Rent growth +2.5/5.0
- Condition / age +2.5/5.0
- 1% rule +2.1/10.0
- ARV discount +0.0/15.0
- Appreciation +0.0/10.0
$185,000
🖨 Deal sheet (PDF) 📄 Offer letter ✓ Due diligence
Listing remarks MLS
Perfect starter home 3BR, 1 BA freshly painted ready for a new family. Kitchen has granite countertops, new LVP flooring . Bath has new fixtures. Conveniently located just off Westover & Riverside Dr. Close to schools, shopping and medical offices. Unfinished basement with laundry and plenty of room for storage. Nice yard with little maintenance.
Key facts
- New kitchen
- Unfinished basement
- Hardwood floors
Tags
Property features AI
Exterior
- Parking: Attached parking
- Utilities: Public water; Public sewer
- Home design: Residential property
- Construction: Brick construction
- Exterior features: Front porch; Composition roof
Interior
- Kitchen: Includes dishwasher, electric range, microwave, refrigerator
- Bedrooms: Three main-level bedrooms
- Flooring: Tile; Hardwood; Vinyl
- Bathrooms: One full bathroom on the main level
- Heating & cooling: Natural gas heating
- Interior features: Dishwasher; Electric range; Microwave; Refrigerator; Full, unfinished basement with exterior entry
Neighborhood map
What this means for you Summary
Snapshot
- This is a 2-bed/1.0-bath single-family listed at $185k.
Deal economics
- At list price, monthly cash flow is $-65 ($-776/yr) — negative.
- To cash-flow at today's rent, offer at most $174k (6.2% below list).
- To meet the 1% rule (rent ≥ 1% of price), the offer needs to be $131k (29.1% below list).
- Recommended offer: $131k (29.1% below list) — sets the bar for 1% rule.
Location & tenants
- Location reads 77/100 on livability (#91 in VA, #2,952 nationally) — a middle-class / working-renter tenant base. Strengths: cost of living A+, housing A+, health & safety A+; Watch: amenities D+, crime D-, commute F.
- Danville City Public School District (town): math 30% / reading 44% proficiency, ranked #128 of 131 in VA (top 98%) — families likely to look elsewhere, expect single-tenant / working-renter base with shorter leases; 71% free/reduced lunch — lower-income household profile, screen leases tightly.
- Zoned schools: Park Avenue Elementary (math 12% / reading 32%, grade F, #1,069 of 1,108 statewide, top 97%, 366 students, 98% FRL); Westwood Middle (math 22% / reading 40%, grade F, #333 of 342 statewide, top 97%, 609 students, 90% FRL); George Washington High (math 44% / reading 54%, grade D, #300 of 319 statewide, top 94%, 1,309 students, 88% FRL) — zoned schools average 92% FRL vs 71% district-wide (21 pts higher); higher-poverty schools than district average — tighter screening recommended.
- Market conditions: 249 active listings in the ZIP; 2 comparable units currently listed for rent nearby; 54 units permitted in Danville city in 2024 (40 in 5+ unit buildings).
- This rent runs 31% of the median local income ($51k/yr) — at the standard rent-burdened threshold; future hikes will face affordability resistance.
Forward outlook
- Local home prices are declining (-3.0%/yr); year-one equity from $1k of loan paydown is wiped out by about $6k of value loss. Plan a longer hold.
- Danville County population projected to shrink 7% by 2050 — rents likely to lag national; underwrite the cash flow, not the appreciation.
Negotiation context
- Only 10 days on market — expect competitive offers; lowballing is unlikely to land.
- 3 sale attempts since 3y ago with the ask held roughly flat each time — persistent listings suggest the price (not the market) is what's stuck; bring a comps-based counter.
- Current owner paid $140k; 32% above their basis — modest negotiation headroom, anchor on the comps not their cost.
Risks & watch-outs
- Watch-outs: built in 1959 — expect roof / HVAC / electrical / plumbing capex.
- Climate carrying-cost: extreme-heat days projected 7→18/yr by 2055 (HVAC capex compounding) — expect insurance premiums to compound above CPI over the hold.
Questions for the listing agent
- What do current leases actually rent for vs. the listed asking? Can we see a recent rent roll and the last 12 months of T-12 income?
- Built in 1959 — when were the roof, HVAC, electrical panel, plumbing, and water heater last replaced?
- Is there a deadline driving the sale (1031 exchange, divorce, estate, relocation)? That informs how much negotiation room exists.
- Schools are B-rated — typically a magnet for longer-tenancy family renters. What's the average tenant stay here, and is there a school-zone premium baked into asking?
- Crime grade is D in this area — have there been break-ins, vandalism, or insurance claims at this property in the last 3 years? What carrier currently insures it and at what premium?
- The area grade is low — what's the realistic commute time and amenity access for the typical tenant pool here? Any planned neighborhood developments (good or bad) we should know about?
- What's the average days-on-market for RENTAL listings here right now (not sales)? A rising rental-DOM trend means longer vacancies and softer asking-rent achievability than the comps imply.
- What's the recent tenant-quality profile in this submarket — average credit score on applications, eviction rate, late-payment / NSF rate, and stable-employment percentage? A property-management company in the area should have these aggregated.
- How much new for-sale + rental construction is in the pipeline within 1–3 miles? Heavy new supply typically softens prices + rents 12–24 months out; constrained supply supports both.
Investment metrics
- 1% rule
- 0.71% ✗
- Cap rate
- 5.87%
- Cash-on-cash
- -1.50%
- DSCR
- 0.93
- GRM
- 11.8
CMA / ARV
- ARV (on-the-fly)
- $129,150
- Comps found
- 8
Show comp detail 8 sales within ~0.75 mi
| Address | Dist | Beds/Ba | Sqft | Sold | Price | $/sf | Match |
|---|---|---|---|---|---|---|---|
| 20 Baldwin St | 0.49mi | 3/1.0 (+1) | 1,020 (-0%) | 5mo | $123,500 | $121 | 68 |
| 145 Shady Ln | 0.53mi | 3/2.0 (+1) | 1,114 (+9%) | 0mo | $133,000 | $119 | 52 |
| 121 Huntington Pl | 0.39mi | 3/1.5 (+1) | 1,128 (+10%) | 9mo | $104,000 | $92 | 51 |
| 371 Barrett St | 0.50mi | 3/1.5 (+1) | 1,020 (-0%) | 24mo | $99,900 | $98 | 49 |
| 207 Stanley Dr | 0.58mi | 3/1.0 (+1) | 900 (-12%) | 4mo | $130,000 | $144 | 44 |
| 4180 Riverside Dr | 0.60mi | 2/2.0 | 1,122 (+10%) | 10mo | $275,000 | $245 | 44 |
| 119 Martin Ave | 0.74mi | 3/1.5 (+1) | 1,150 (+12%) | 4mo | $168,000 | $146 | 35 |
| 260 Turpin St | 0.75mi | 3/1.0 (+1) | 1,176 (+15%) | 12mo | $147,900 | $126 | 25 |
Match score weights: distance 35% · size 25% · config 20% · recency 20%. Top-matched comps best support the ARV.
Projected returns pro-forma
-3.0% appreciation · 3.0% rent growth · sell at horizon
- IRR
- -18.8%
- Equity multiple
- 0.34×
- Total profit
- $-34,184
- Equity at exit
- $27,584
- IRR
- -11.5%
- Equity multiple
- 0.32×
- Total profit
- $-35,432
- Equity at exit
- $15,995
Cash invested: $51,800 (down + closing). Projections, not guarantees.
Landlord ↔ Tenant lean methodology
- Overall (STATE)
- 55 Moderately Landlord-Leaning
- State Virginia
- 55 Moderately Landlord-Leaning · D+2
- County
- — inherits STATE
- City
- — inherits STATE
ZIP-level market 24541
- Home prices YoY
- -17.1%
- Active inventory
- 249
- Price-to-rent
- 11.8×
Monthly cashflow live
- Estimated rent
- $1,311 medium interval (Pro) →
- Mortgage (P&I)
- −$970
- Tax from tax record
- −$53 /mo · $637/yr
- Insurance
- −$77
- HOA
- −$0
- Vacancy / Maint / Mgmt
- −$275
- Net cashflow
- $-65
Break-even live
Sensitivity live
| Price | -10% $40 | -5% $-12 | +0% $-65 | +5% $-117 | +10% $-169 |
|---|---|---|---|---|---|
| Rent | -10% $-168 | -5% $-116 | +0% $-65 | +5% $-13 | +10% $39 |
| Rate | -1.0pp $29 | -0.5pp $-18 | base $-65 | +0.5pp $-113 | +1.0pp $-161 |
UW: 25.0% down · 7.5% · 30yr · 1.5% tax · 5.0% vac · 8.0% maint · 8.0% mgmt
Financing live
Cash to close
- Down payment
- $46,250
- Closing costs
- $5,550
- Reserves months
- —
- Total cash needed
- —
Loan-product check · same deal, 3 products live
Conventional
25% down · 7.5% · 30yr
- Down + closing
- —
- Monthly P&I
- —
- Monthly cashflow
- —
- DSCR
- —
- Eligible?
- —
Personal DTI + credit; lowest rate.
DSCR
20% down · 8.5% · 30yr
- Down + closing
- —
- Monthly P&I
- —
- Monthly cashflow
- —
- DSCR
- —
- Eligible?
- —
No personal income docs; deal must DSCR.
Hard money
10% down · 12.0% · 12mo
- Down + closing
- —
- Monthly P&I
- —
- Monthly cashflow
- —
- DSCR
- —
- Eligible?
- —
Short-term bridge; refi at stabilization.
Rent comps 2 comps
| Address | Beds | Baths | Sqft | Rent | $/sqft | DOM | Units | Dist |
|---|---|---|---|---|---|---|---|---|
| 671 Park Ave Danville, VA | 2.0 | 1.0 | 942 | $1,100 | $1.17 | 45d | 1 | 0.73mi |
| 119 Martin Ave Danville, VA | 3.0 | 1.5 | 1100 | $1,700 | $1.55 | 45d | 1 | 0.76mi |
Listing history 9 events
-
2026-06-21days on market $185,000 Active 10 DOM
-
2026-06-19days on market $185,000 Active 8 DOM
-
2026-06-18days on market $185,000 Active 7 DOM
-
2026-06-17days on market $185,000 Active 6 DOM
-
2026-06-16days on market $185,000 Active 5 DOM
-
2026-06-15days on market $185,000 Active 4 DOM
-
2026-06-14days on market $185,000 Active 2 DOM
-
2026-06-13remarks 196-char remark
-
2026-06-13$185,000 Active 1 DOM
ⓘ Source: listings_history table (triggers on properties + properties_extension) + one-shot
backfill from property_details.listing_events for pre-trigger history.
Tax reassessment forecast VA · Resets to sale price
- Current annual tax
- $637 · $53/mo
- Projected year-2 tax
- $1,517 · $126/mo
- Expected delta
- +$880/yr (+$73/mo · 138.3%)
ⓘ Screening estimate from a state-policy table — verify with the county assessor before closing.
Climate risk First Street
- Flood 1/10 Low FEMA zone X (unshaded) · 0% chance over 30 yrs
- Wildfire 1/10 Low
- Heat 6/10 Major 7 d/yr ≥105°F today · 18 d/yr by 30 yrs out
- Wind 3/10 Moderate 7% chance of damaging wind over 30 yrs
- Air quality 2/10 Low 0 unhealthy d/yr today · 1 by 30 yrs out
Nearby sold comps map
Loading sold comps map…
Walkable amenities ~0.75 mi
Loading nearby amenities…
Taxation est. · year 1
- Rental income
- $15,732
- − Mortgage interest
- −$10,363
- − Property taxes
- −$637
- − Insurance
- −$925
- − Repairs & maintenance
- −$1,259
- − Management
- −$1,259
- − Depreciation
- −$5,382
- Taxable loss
- −$4,092
- Est. tax savings @ 24.0%
- +$982
- After-tax cash flow
- $206/yr
For passive investors: Depreciation is non-cash, so a rental often shows a tax loss while cash-flowing — sheltering income. Rental losses are passive: they offset passive income freely, and up to $25,000/yr can offset ordinary (W-2) income if you actively participate and your MAGI is under $100k (phasing out to $0 by $150k); unused losses carry forward. On sale, claimed depreciation is recaptured at up to 25%, and gains may owe capital-gains tax (a 1031 exchange can defer both). Figures are a year-1 estimate at your 24.0% rate — not tax advice; consult a CPA.
Schools (NCES district)
- District
- Danville City Public School District
- NCES district ID
- 5101110
- Math proficiency
- 30% ▼ -22.00%
- Reading proficiency
- 44% ▼ -8.00%
- Median HH income
- $31,952
- Composite
- 30.23/100
- National rank
- #6298
- State rank
- #128 of 131 in VA
Livability — Danville
- Score
- 77/100
- State rank
- #91
- US rank
- #2952
Category grades
Schools grade is shown separately in the Schools card above.
Census & demographics
- Census place
- Danville, VA
- County
- Danville City · 59,055 people
- City population
- 59,055
- Metro
- Danville, VA
- Population (ZIP)
- 28,042
- Household income
- $51,427
- Rent vs Own
- Severe rent burden
- 1399.0
Population outlook (Danville County) Hauer SSP2
- Today (2025)
- 40,989 people
- By 2030
- 40,432 · -1.4%
- By 2040
- 39,255 · -4.2%
- By 2050
- 38,035 · -7.2%
- By 2075
- 35,612 · -13.1%
- By 2100
- 30,365 · -25.9%
Race, ethnicity, and origin ACS 2023
- Neighborhood character
- Diverse neighborhood (Simpson 0.59)
- Race & ethnicity
- White 50% Black 39% Two or more races 7% Hispanic / Latino 5% Asian 2%
- Common ancestry
- Slovak 2% Serbian 2% Lithuanian 1%
- Foreign-born
- 4% · Canada, Dominican Republic
- Languages at home
- 95% English-only · Spanish 4% Other Indo-European 1%
Political lean MEDSL · Danville
- 2024 margin
- Strong D (+21.1) · D 60.1% · R 39.0%
- 2008→2024 swing
- +1.9pp toward D · 2008: 19.1pp · 2024: 21.1pp
- All cycles
- 2024: D+21.1 2020: D+22.1 2016: D+19.9 2012: D+22.1 2008: D+19.1
Not yet ingested
- Civics
- —
Market trends
- HPI YoY
- ▼ -49.28%
- Current HPI
- 238.5992
- Rent YoY
- —
- Metro
- Danville, VA
- State GDP YoY
- ▲ 2.40%
- F500 in state
- 50
Industry mix (Fortune 500 HQ in VA)
| Industry | F500 HQs | Revenue |
|---|---|---|
| Aerospace / Defense | 4 | $236B |
|
||
| Technology / Defense | 3 | $32B |
|
||
| Financial Services | 2 | $176B |
|
||
| Utilities | 2 | $27B |
|
||
| Insurance | 2 | $25B |
|
||
| Technology | 2 | $15B |
|
||
Price history
+172.1% since first listed9 events — show timeline
- 2026-06-11 Listed $185,000 DRRAR
- 2024-03-14 Rental Removed $1,325 APPFOLIO
- 2023-12-01 Price Changed $1,325 APPFOLIO
- 2023-11-11 Listed for Rent $1,375 APPFOLIO
- 2023-10-30 Sold (Public Records) $140,000 Public Records
- 2023-10-26 Sold (MLS) $140,000 DRRAR
- 2023-09-23 Contingent — DRRAR
- 2023-09-11 Listed $159,900 DRRAR
- 2022-04-20 Sold (Public Records) $68,000 Public Records
Property tax history
+1.8%/yrLatest (2025): $637 · +0.0% YoY. Source: county tax records.
Cash-flow waterfall
monthlySold comps — $/sqft
last 12 mo · ≤1 miLoading sold comps…