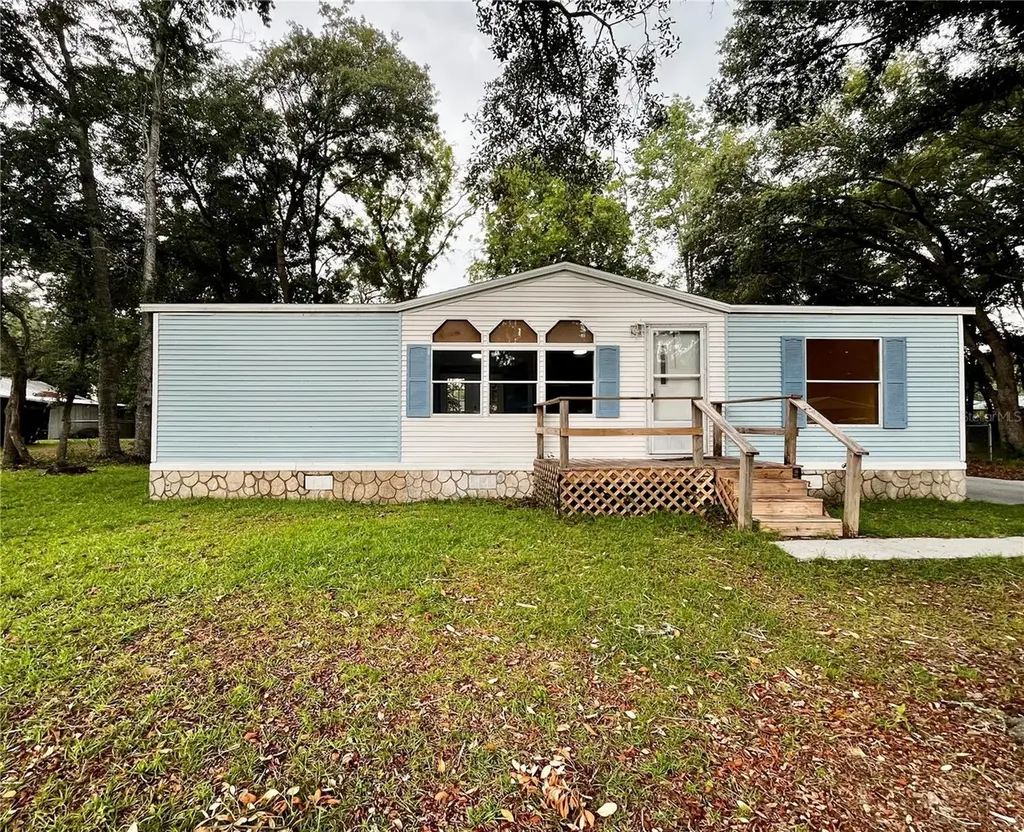
12100 SE 85th Ct · Silver Springs Shores, FL
Flood risk 1/10 · Minimal
- FEMA flood zone
- X (unshaded)
- Chance of flooding over 30 yrs
- 0.0%
- Est. flood insurance / yr
- $507 – $1,088
Fire risk 5/10 · Moderate
- Est. fire insurance / yr
- $947 – $1,759
Heat risk 8/10 · Major
- Hot days now (above 109°F)
- 7 days/yr
- Hot days in 30 yrs
- 21 days/yr
Wind risk 9/10 · Severe
- Chance of severe wind over 30 yrs
- 99.0%
Air-quality risk 3/10 · Minor
- Unhealthy air days now
- 2 days/yr
- Unhealthy air days in 30 yrs
- 2 days/yr
Risk factors via First Street. Map © Google.
Why this score? — see what drove the B grade
The composite is a weighted blend of 9 inputs, each scored 0–100. Each bar is that input's sub-score; the figure is the points it added to the 100-point composite (weight × sub-score).
- Cash flow +30.0/30.0
- ARV discount +15.0/15.0
- DSCR +10.0/10.0
- 1% rule +7.9/10.0
- Schools +3.6/10.0
- Livability +3.4/5.0
- Rent growth +2.5/5.0
- Condition / age +2.5/5.0
- Appreciation +0.0/10.0
$107,000
🖨 Deal sheet 📄 Offer letter ✓ Due diligence
Listing remarks
Under contract-accepting backup offers. Step inside this well maintained 1992 home in Belleview Ridge Estates. The roof was just replaced on June 11, 2026, HVAC was replaced in 2017 as well as the water heater, making this home nearly worry free. The open floor plan offers a seamless flow through the home into the spacious bedrooms and generous bathrooms. The back yard is fully fenced with chain link fence and the oversized back deck is a peaceful place to unwind after each day.
Key facts
- Open floor plan
- Oversized back deck
- 0.29 acre lot
Tags
Property features AI
Finance
- Other: Lot approximately 0.29 acres (90 x 140), cleared
- Financial info: No lease restrictions; Unfurnished
Exterior
- Parking: Paved access
- Utilities: Well water; Septic tank; Electricity connected
- Home design: Manufactured double wide; Residential property; One story; Faces east; Entry level: One
- Construction: Vinyl siding and frame construction; Shingle roof; Crawlspace foundation; Built as a manufactured home
- Exterior features: Deck; Front porch; French doors; Exterior lighting; Outdoor storage; Chain link fencing; Shed(s)
Interior
- Kitchen: Dishwasher; Range
- Bedrooms: 2 bedrooms
- Flooring: Carpet; Linoleum
- Bathrooms: 2 full bathrooms
- Heating & cooling: Central heating; Central air
- Interior features: Thermostat
- Laundry & utility: Laundry inside
Neighborhood map
What this means for you Summary
Snapshot
- This is a 2-bed/2.0-bath manufactured listed at $107k.
Deal economics
- At list price, monthly cash flow is $441 ($5k/yr) — positive.
- The deal already cash-flows at list — no discount required.
- Meets the 1% rule at list price ($1k rent vs $107k).
- Cap rate 11.2% vs local median 4.7% in Silver Springs Shores — top-decile yield for the area; either an underpriced asset or a hidden risk that comps aren't pricing in. Stress-test before assuming the spread holds.
Location & tenants
- Location reads 68/100 on livability (#527 in FL) — a middle-class / working-renter tenant base. Strengths: cost of living A+, housing A+, health & safety A-; Watch: crime C-, employment D, schools F.
- Marion (rural): math 42% / reading 43% proficiency, ranked #61 of 73 in FL (top 84%) — families likely to look elsewhere, expect single-tenant / working-renter base with shorter leases; 61% free/reduced lunch — lower-income household profile, screen leases tightly.
- Market conditions: 357 active listings in the ZIP; 2 comparable units currently listed for rent nearby; 7,071 units permitted in Marion County in 2024 (534 in 5+ unit buildings).
Forward outlook
- Local home prices are declining (-3.0%/yr); year-one equity from $740 of loan paydown is wiped out by about $3k of value loss. Plan a longer hold.
- Marion County population projected at +13% by 2050 — modest demand growth; plan on rents tracking national, not racing it.
- At projected returns (-3.0% appreciation + 3.0% rent growth), your $30k cash investment doubles in ~7 years — after that, you're playing with house money.
Negotiation context
- Only 1 days on market — expect competitive offers; lowballing is unlikely to land.
Risks & watch-outs
- Climate carrying-cost: severe wind risk, 99% chance of damaging wind over 30y; moderate wildfire risk; extreme-heat days projected 7→21/yr by 2055 (HVAC capex compounding) — expect insurance premiums to compound above CPI over the hold.
Questions for the listing agent
- Is there a deadline driving the sale (1031 exchange, divorce, estate, relocation)? That informs how much negotiation room exists.
- Schools are F-rated, which usually means shorter tenancies and higher turnover. Who's the typical renter profile here, and what's been the actual vacancy rate?
- What's the average days-on-market for RENTAL listings here right now (not sales)? A rising rental-DOM trend means longer vacancies and softer asking-rent achievability than the comps imply.
- What's the recent tenant-quality profile in this submarket — average credit score on applications, eviction rate, late-payment / NSF rate, and stable-employment percentage? A property-management company in the area should have these aggregated.
- How much new for-sale + rental construction is in the pipeline within 1–3 miles? Heavy new supply typically softens prices + rents 12–24 months out; constrained supply supports both.
Investment metrics
- 1% rule
- 1.29% ✓
- Cap rate
- 11.24%
- Cash-on-cash
- 17.68%
- DSCR
- 1.79
- GRM
- 6.4
CMA / ARV
- ARV (on-the-fly)
- $163,200
- Comps found
- 1
Show comp detail 1 sale within ~0.75 mi
| Address | Dist | Beds/Ba | Sqft | Sold | Price | $/sf | Match |
|---|---|---|---|---|---|---|---|
| 12415 SE 89th Ave | 0.52mi | 2/2.0 | 1,000 (+4%) | 12mo | $170,000 | $170 | 59 |
Match score weights: distance 35% · size 25% · config 20% · recency 20%. Top-matched comps best support the ARV.
Projected returns pro-forma
-3.0% appreciation · 3.0% rent growth · sell at horizon
- IRR
- 9.1%
- Equity multiple
- 1.36×
- Total profit
- $10,744
- Equity at exit
- $15,954
- IRR
- 18.3%
- Equity multiple
- 2.52×
- Total profit
- $45,424
- Equity at exit
- $9,251
Cash invested: $29,960 (down + closing). Projections, not guarantees.
Landlord ↔ Tenant lean methodology
- Overall (STATE)
- 87 Strongly Landlord-Friendly
- State Florida
- 87 Strongly Landlord-Friendly · R+3
- County
- — inherits STATE
- City
- — inherits STATE
ZIP-level market 34420
- Home prices YoY
- -32.8%
- Active inventory
- 357
- Price-to-rent
- 6.4×
Monthly cashflow live
- Estimated rent
- $1,383 medium interval (Pro) →
- Mortgage (P&I)
- −$561
- Tax from tax record
- −$46 /mo · $548/yr
- Insurance
- −$45
- HOA
- −$0
- Vacancy / Maint / Mgmt
- −$291
- Net cashflow
- $441
Break-even live
UW: 25.0% down · 7.5% · 30yr · 1.5% tax · 5.0% vac · 8.0% maint · 8.0% mgmt
Financing live
Cash to close
- Down payment
- $26,750
- Closing costs
- $3,210
- Reserves months
- —
- Total cash needed
- —
Loan-product check · same deal, 3 products live
Conventional
25% down · 7.5% · 30yr
- Down + closing
- —
- Monthly P&I
- —
- Monthly cashflow
- —
- DSCR
- —
- Eligible?
- —
Personal DTI + credit; lowest rate.
DSCR
20% down · 8.5% · 30yr
- Down + closing
- —
- Monthly P&I
- —
- Monthly cashflow
- —
- DSCR
- —
- Eligible?
- —
No personal income docs; deal must DSCR.
Hard money
10% down · 12.0% · 12mo
- Down + closing
- —
- Monthly P&I
- —
- Monthly cashflow
- —
- DSCR
- —
- Eligible?
- —
Short-term bridge; refi at stabilization.
Rent comps 2 comps
| Address | Beds | Baths | Sqft | Rent | $/sqft | DOM | Units | Dist |
|---|---|---|---|---|---|---|---|---|
| 11806 SE 72nd Terrace Rd Belleview, FL | 2.0 | 2.0 | 1011 | $1,500 | $1.48 | 21d | 1 | 1.17mi |
| 11709 SE 99th Ct Belleview, FL | 2.0 | 1.0 | 720 | $1,195 | $1.66 | 14d | 1 | 1.50mi |
Listing history 4 events
-
2026-06-14remarks 483-char remark
-
2026-06-14status $107,000 Pending 1 DOM
-
2026-06-13remarks 443-char remark
-
2026-06-13$107,000 Active 1 DOM
ⓘ Source: listings_history table (triggers on properties + properties_extension) + one-shot
backfill from property_details.listing_events for pre-trigger history.
Tax reassessment forecast FL · Resets to sale price
- Current annual tax
- $548 · $46/mo
- Projected year-2 tax
- $888 · $74/mo
- Expected delta
- +$340/yr (+$28/mo · 62.0%)
ⓘ Screening estimate from a state-policy table — verify with the county assessor before closing.
Climate risk First Street
- Flood 1/10 Low FEMA zone X (unshaded) · 0% chance over 30 yrs
- Wildfire 5/10 Major
- Heat 8/10 Severe 7 d/yr ≥109°F today · 21 d/yr by 30 yrs out
- Wind 9/10 Extreme 99% chance of damaging wind over 30 yrs
- Air quality 3/10 Moderate 2 unhealthy d/yr today · 2 by 30 yrs out
Nearby sold comps map
Loading sold comps map…
Walkable amenities ~0.75 mi
Loading nearby amenities…
Taxation est. · year 1
- Rental income
- $16,600
- − Mortgage interest
- −$5,994
- − Property taxes
- −$548
- − Insurance
- −$535
- − Repairs & maintenance
- −$1,328
- − Management
- −$1,328
- − Depreciation
- −$3,113
- Taxable income
- $3,754
- Est. tax owed @ 24.0%
- −$901
- After-tax cash flow
- $4,396/yr
For passive investors: Depreciation is non-cash, so a rental often shows a tax loss while cash-flowing — sheltering income. Rental losses are passive: they offset passive income freely, and up to $25,000/yr can offset ordinary (W-2) income if you actively participate and your MAGI is under $100k (phasing out to $0 by $150k); unused losses carry forward. On sale, claimed depreciation is recaptured at up to 25%, and gains may owe capital-gains tax (a 1031 exchange can defer both). Figures are a year-1 estimate at your 24.0% rate — not tax advice; consult a CPA.
Schools (NCES district)
- District
- Marion
- NCES district ID
- 1201260
- Math proficiency
- 42% ▼ -7.00%
- Reading proficiency
- 43% ▼ -4.00%
- Median HH income
- $40,015
- Composite
- 35.61/100
- National rank
- #4890
- State rank
- #61 of 73 in FL
Livability — Silver Springs Shores
- Score
- 68/100
- State rank
- #527
- US rank
- #9854
Category grades
Schools grade is shown separately in the Schools card above.
Census & demographics
- City population
- 34,665
- Population (ZIP)
- 19,167
Population outlook (Marion County) Hauer SSP2
- Today (2025)
- 365,905 people
- By 2030
- 376,768 · +3.0%
- By 2040
- 396,555 · +8.4%
- By 2050
- 412,723 · +12.8%
- By 2075
- 446,090 · +21.9%
- By 2100
- 436,193 · +19.2%
Race, ethnicity, and origin ACS 2023
- Neighborhood character
- Predominantly White (81%)
- Race & ethnicity
- White 81% Hispanic / Latino 12% Two or more races 10% Black 1%
- Hispanic origin (detail)
- Puerto Rican 7% Cuban 2%
- Common ancestry
- Lithuanian 4% Iranian 2% Romanian 2%
- Foreign-born
- 5% · Canada, Jamaica
- Languages at home
- 89% English-only · Spanish 7% Other Indo-European 2% German/W. Germanic 1%
Political lean MEDSL · Marion
- 2024 margin
- Solid R (+31.6) · D 33.8% · R 65.5%
- 2008→2024 swing
- -20.0pp toward R · 2008: -11.6pp · 2024: -31.6pp
- All cycles
- 2024: R+31.6 2020: R+25.9 2016: R+26.2 2012: R+16.2 2008: R+11.6
Not yet ingested
- Civics
- —
Market trends
- HPI YoY
- ▼ -120.90%
- Current HPI
- 247.3176
- Rent YoY
- —
- Metro
- —
- State GDP YoY
- ▲ 3.28%
- F500 in state
- 36
Industry mix (Fortune 500 HQ in FL)
| Industry | F500 HQs | Revenue |
|---|---|---|
| Industrial Technology | 2 | $29B |
|
||
| Insurance | 2 | $17B |
|
||
| Retail | 1 | $60B |
|
||
| Technology Distribution | 1 | $58B |
|
||
| Homebuilding | 1 | $35B |
|
||
| Technology Manufacturing | 1 | $35B |
|
||
Price history
1 event — show timeline
- 2026-06-12 Listed $107,000 Stellar MLS as Distributed by MLS Grid
Property tax history
+6.8%/yrLatest (2025): $548 · +68.8% YoY. Source: county tax records.
Cash-flow waterfall
monthlySold comps — $/sqft
last 12 mo · ≤1 miLoading sold comps…