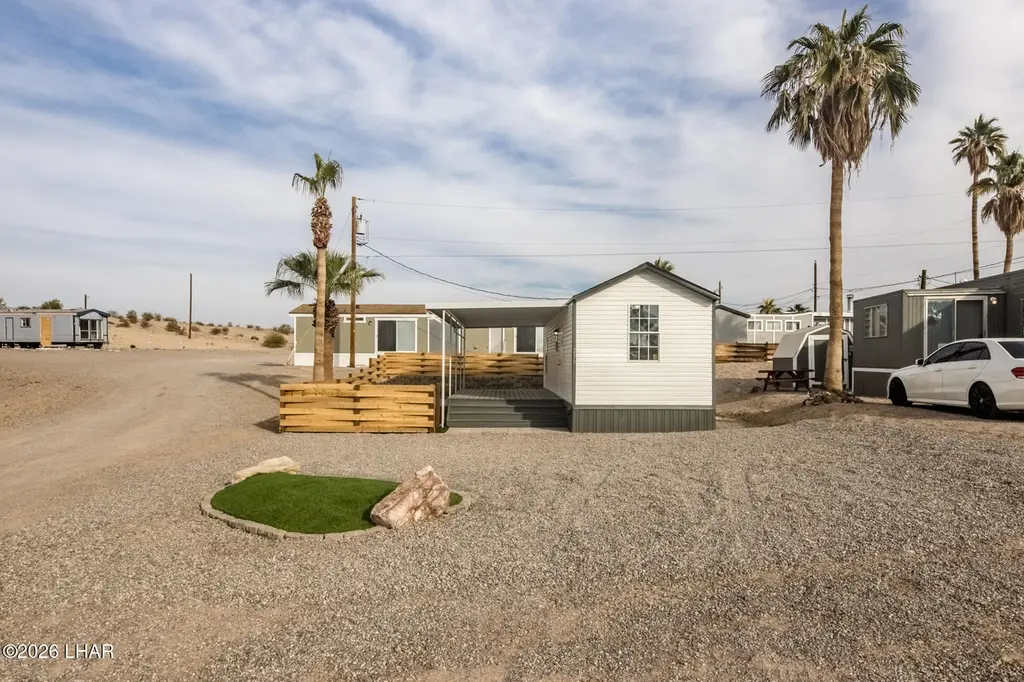
1100 Riverside Dr #216 · Crystal Beach, AZ
Flood risk 4/10 · Minor
- FEMA flood zone
- X (unshaded)
- Chance of flooding over 30 yrs
- 0.24%
- Est. flood insurance / yr
- $507 – $1,088
Fire risk 4/10 · Minor
- Est. fire insurance / yr
- $610 – $1,132
Heat risk 9/10 · Severe
- Hot days now (above 113°F)
- 7 days/yr
- Hot days in 30 yrs
- 17 days/yr
Wind risk 1/10 · Minimal
- Chance of severe wind over 30 yrs
- —
Air-quality risk 1/10 · Minimal
- Unhealthy air days now
- 0 days/yr
- Unhealthy air days in 30 yrs
- 0 days/yr
Risk factors via First Street. Map © Google.
Why this score? — see what drove the B- grade
The composite is a weighted blend of 9 inputs, each scored 0–100. Each bar is that input's sub-score; the figure is the points it added to the 100-point composite (weight × sub-score).
- Cash flow +30.0/30.0
- DSCR +10.0/10.0
- 1% rule +8.7/10.0
- ARV discount +7.5/15.0
- Condition / age +4.0/5.0
- Schools +3.4/10.0
- Rent growth +2.7/5.0
- Livability +2.6/5.0
- Appreciation +0.0/10.0
$89,900
🖨 Deal sheet 📄 Offer letter ✓ Due diligence
Listing remarks MLS
* Leased Land * This adorable remodeled 1 bedroom, 1 bathroom park model home offers 408 square feet of thoughtfully designed living space and is currently the most affordable home on the market. Located on a desirable corner lot in Castle Rock Estates, this home combines charm, functionality, and affordability in one neat package. The roof was recently redone, providing peace of mind for the next owner, and the home includes a brand-new washer and dryer for added convenience. The fenced yard creates a private outdoor space perfect for pets, entertaining. Inside, the home feels clean, updated, and completely move-in ready. Castle Rock Estates offers a predictable monthly space lease that includes water, sewer, and trash, making it easy to budget. The community is conveniently located on the north side of town, close to shopping, desert trails, and with great access to Castle Rock Beach -- ideal for full-time living or a winter retreat. Even better, the financing currently in place may be transferable to a qualified buyer, creating a rare opportunity to step into affordable homeownership with existing financing terms.
Key facts
- Fenced yard
- Corner lot
- Recently redone roof
Tags
Neighborhood map
What this means for you Summary
Snapshot
- This is a 1-bed/1.0-bath manufactured listed at $90k. Condition is rated good.
Deal economics
- At list price, monthly cash flow is $351 ($4k/yr) — positive.
- The deal already cash-flows at list — no discount required.
- Meets the 1% rule at list price ($1k rent vs $90k).
- Recommended offer: $82k (9.0% below list) — sets the bar for market timing.
Location & tenants
- Location reads 51/100 on livability (#317 in AZ) — a working-class tenant base; expect higher turnover. Strengths: cost of living A+; Watch: health & safety C-, schools F, crime F.
- Lake Havasu Unified District (4368) (urban): math 39% / reading 41% proficiency, ranked #66 of 249 in AZ (top 26%) — families likely to look elsewhere, expect single-tenant / working-renter base with shorter leases.
- Market conditions: Rents flat; 414 active listings in the ZIP; 2,543 units permitted in Mohave County in 2024 (33 in 5+ unit buildings).
Forward outlook
- Local home prices are declining (-3.0%/yr); year-one equity from $622 of loan paydown is wiped out by about $3k of value loss. Plan a longer hold.
- Mohave County population projected to shrink 6% by 2050 — rents likely to lag national; underwrite the cash flow, not the appreciation.
- At projected returns (-3.0% appreciation + 0.7% rent growth), your $25k cash investment doubles in ~10 years — after that, you're playing with house money.
Negotiation context
- It's been on market 112 days — a 9% lower offer ($82k) is reasonable based on typical stale-listing flexibility.
- 4 sale attempts since 4y ago; this cycle's ask has dropped $9k (9%) from the opening price — seller is motivated, your offer sets the floor, not the list.
Risks & watch-outs
- Climate carrying-cost: extreme-heat days projected 7→17/yr by 2055 (HVAC capex compounding) — expect insurance premiums to compound above CPI over the hold.
Questions for the listing agent
- It's been on market 112 days. Have you received any prior offers? Is the seller open to a 9% concession, seller financing, or rate buy-down credit?
- Why hasn't it sold? Are there any deal-killer items the seller is aware of (foundation, flood, title, zoning, code violations)?
- Is there a deadline driving the sale (1031 exchange, divorce, estate, relocation)? That informs how much negotiation room exists.
- Schools are F-rated, which usually means shorter tenancies and higher turnover. Who's the typical renter profile here, and what's been the actual vacancy rate?
- Crime grade is F in this area — have there been break-ins, vandalism, or insurance claims at this property in the last 3 years? What carrier currently insures it and at what premium?
- What's the average days-on-market for RENTAL listings here right now (not sales)? A rising rental-DOM trend means longer vacancies and softer asking-rent achievability than the comps imply.
- What's the recent tenant-quality profile in this submarket — average credit score on applications, eviction rate, late-payment / NSF rate, and stable-employment percentage? A property-management company in the area should have these aggregated.
- How much new for-sale + rental construction is in the pipeline within 1–3 miles? Heavy new supply typically softens prices + rents 12–24 months out; constrained supply supports both.
Investment metrics
- 1% rule
- 1.37% ✓
- Cap rate
- 10.98%
- Cash-on-cash
- 16.73%
- DSCR
- 1.74
- GRM
- 6.1
CMA / ARV
No comps found within radius.
Projected returns pro-forma
-3.0% appreciation · 0.66% rent growth · sell at horizon
- IRR
- 5.2%
- Equity multiple
- 1.20×
- Total profit
- $4,973
- Equity at exit
- $13,404
- IRR
- 12.4%
- Equity multiple
- 1.88×
- Total profit
- $22,102
- Equity at exit
- $7,773
Cash invested: $25,172 (down + closing). Projections, not guarantees.
Landlord ↔ Tenant lean methodology
- Overall (STATE)
- 87 Strongly Landlord-Friendly
- State Arizona
- 87 Strongly Landlord-Friendly · R+3
- County
- — inherits STATE
- City
- — inherits STATE
ZIP-level market 86404
- Home prices YoY
- -32.0%
- Rents YoY
- 0.7%
- Active inventory
- 414
- Price-to-rent
- 6.1×
Monthly cashflow live
- Estimated rent
- $1,231 medium interval (Pro) →
- Mortgage (P&I)
- −$471
- Tax est. 1.5%
- −$112 /mo · $1,348/yr
- Insurance
- −$37
- HOA
- −$0
- Vacancy / Maint / Mgmt
- −$258
- Net cashflow
- $351
Break-even live
UW: 25.0% down · 7.5% · 30yr · 1.5% tax · 5.0% vac · 8.0% maint · 8.0% mgmt
Financing live
Cash to close
- Down payment
- $22,475
- Closing costs
- $2,697
- Reserves months
- —
- Total cash needed
- —
Loan-product check · same deal, 3 products live
Conventional
25% down · 7.5% · 30yr
- Down + closing
- —
- Monthly P&I
- —
- Monthly cashflow
- —
- DSCR
- —
- Eligible?
- —
Personal DTI + credit; lowest rate.
DSCR
20% down · 8.5% · 30yr
- Down + closing
- —
- Monthly P&I
- —
- Monthly cashflow
- —
- DSCR
- —
- Eligible?
- —
No personal income docs; deal must DSCR.
Hard money
10% down · 12.0% · 12mo
- Down + closing
- —
- Monthly P&I
- —
- Monthly cashflow
- —
- DSCR
- —
- Eligible?
- —
Short-term bridge; refi at stabilization.
Listing history 21 events
-
2026-06-18days on market $89,900 Active 112 DOM
-
2026-06-17days on market $89,900 Active 111 DOM
-
2026-06-16days on market $89,900 Active 110 DOM
-
2026-06-15days on market $89,900 Active 109 DOM
-
2026-06-14days on market $89,900 Active 107 DOM
-
2026-06-13days on market $89,900 Active 106 DOM
-
2026-06-10days on market $89,900 Active 104 DOM
-
2026-06-09days on market $89,900 Active 103 DOM
-
2026-06-08days on market $89,900 Active 102 DOM
-
2026-06-07days on market $89,900 Active 101 DOM
-
2026-06-03days on market $89,900 Active 97 DOM
-
2026-06-02days on market $89,900 Active 96 DOM
-
2026-06-01days on market $89,900 Active 95 DOM
-
2026-05-31days on market $89,900 Active 94 DOM
-
2026-05-30days on market $89,900 Active 93 DOM
-
2026-04-28price $89,900 1135-char remark
Show marketing remark (1135 chars)
* Leased Land * This adorable remodeled 1 bedroom, 1 bathroom park model home offers 408 square feet of thoughtfully designed living space and is currently the most affordable home on the market. Located on a desirable corner lot in Castle Rock Estates, this home combines charm, functionality, and affordability in one neat package. The roof was recently redone, providing peace of mind for the next owner, and the home includes a brand-new washer and dryer for added convenience. The fenced yard creates a private outdoor space perfect for pets, entertaining. Inside, the home feels clean, updated, and completely move-in ready. Castle Rock Estates offers a predictable monthly space lease that includes water, sewer, and trash, making it easy to budget. The community is conveniently located on the north side of town, close to shopping, desert trails, and with great access to Castle Rock Beach -- ideal for full-time living or a winter retreat. Even better, the financing currently in place may be transferable to a qualified buyer, creating a rare opportunity to step into affordable homeownership with existing financing terms.
-
2026-02-26$99,000 Active 1135-char remark
Show marketing remark (1135 chars)
* Leased Land * This adorable remodeled 1 bedroom, 1 bathroom park model home offers 408 square feet of thoughtfully designed living space and is currently the most affordable home on the market. Located on a desirable corner lot in Castle Rock Estates, this home combines charm, functionality, and affordability in one neat package. The roof was recently redone, providing peace of mind for the next owner, and the home includes a brand-new washer and dryer for added convenience. The fenced yard creates a private outdoor space perfect for pets, entertaining. Inside, the home feels clean, updated, and completely move-in ready. Castle Rock Estates offers a predictable monthly space lease that includes water, sewer, and trash, making it easy to budget. The community is conveniently located on the north side of town, close to shopping, desert trails, and with great access to Castle Rock Beach -- ideal for full-time living or a winter retreat. Even better, the financing currently in place may be transferable to a qualified buyer, creating a rare opportunity to step into affordable homeownership with existing financing terms.
-
2023-07-06status Active
-
2023-07-05status Pending
-
2023-04-04$109,700 Active
-
2022-12-09$98,000 Active
ⓘ Source: listings_history table (triggers on properties + properties_extension) + one-shot
backfill from property_details.listing_events for pre-trigger history.
Climate risk First Street
- Flood 4/10 Moderate FEMA zone X (unshaded) · 24% chance over 30 yrs
- Wildfire 4/10 Moderate
- Heat 9/10 Extreme 7 d/yr ≥113°F today · 17 d/yr by 30 yrs out
- Wind 1/10 Low
- Air quality 1/10 Low 0 unhealthy d/yr today · 0 by 30 yrs out
Nearby sold comps map
Loading sold comps map…
Walkable amenities ~0.75 mi
Loading nearby amenities…
Taxation est. · year 1
- Rental income
- $14,768
- − Mortgage interest
- −$5,036
- − Property taxes
- −$1,348
- − Insurance
- −$450
- − Repairs & maintenance
- −$1,181
- − Management
- −$1,181
- − Depreciation
- −$2,615
- Taxable income
- $2,956
- Est. tax owed @ 24.0%
- −$710
- After-tax cash flow
- $3,502/yr
For passive investors: Depreciation is non-cash, so a rental often shows a tax loss while cash-flowing — sheltering income. Rental losses are passive: they offset passive income freely, and up to $25,000/yr can offset ordinary (W-2) income if you actively participate and your MAGI is under $100k (phasing out to $0 by $150k); unused losses carry forward. On sale, claimed depreciation is recaptured at up to 25%, and gains may owe capital-gains tax (a 1031 exchange can defer both). Figures are a year-1 estimate at your 24.0% rate — not tax advice; consult a CPA.
Condition & rehab AI · 13 photos
This remodeled park model home is in good condition with recent updates, making it move-in ready and a great investment opportunity.
Value-add opportunities
- Resale paint exterior — enhances curb appeal
- Resale trim around windows — improves home's appearance
- Both install new outdoor lighting — enhances curb appeal and safety
- Both landscape front yard — enhances curb appeal and creates a welcoming environment
Renovation cost estimate screening
Value-add ROI direction
- Resale paint exterior — enhances curb appeal ↑
- Resale trim around windows — improves home's appearance ↑
- Both install new outdoor lighting — enhances curb appeal and safety ↑
- Both landscape front yard — enhances curb appeal and creates a welcoming environment ↑
ⓘ Cost ranges are severity-bucket heuristics (US national rule-of-thumb). Get contractor quotes + a written scope before underwriting a rehab budget.
Schools (NCES district)
- District
- Lake Havasu Unified District (4368)
- NCES district ID
- 0404280
- Math proficiency
- 39% ▼ -16.00%
- Reading proficiency
- 41% ▼ -8.00%
- Median HH income
- $43,993
- Composite
- 33.92/100
- National rank
- #5339
- State rank
- #66 of 249 in AZ
Livability — Crystal Beach
- Score
- 51/100
- State rank
- #317
- US rank
- #25251
Category grades
Schools grade is shown separately in the Schools card above.
Census & demographics
- County
- Mohave County · 181,906 people
- Metro
- Lake Havasu City-Kingman, AZ
- Population (ZIP)
- 19,234
- Household income
- $72,910
- Rent vs Own
- Severe rent burden
- 343.0
Population outlook (Mohave County) Hauer SSP2
- Today (2025)
- 209,184 people
- By 2030
- 209,674 · +0.2%
- By 2040
- 205,897 · -1.6%
- By 2050
- 196,810 · -5.9%
- By 2075
- 169,454 · -19.0%
- By 2100
- 136,630 · -34.7%
Race, ethnicity, and origin ACS 2023
- Neighborhood character
- Predominantly White (83%)
- Race & ethnicity
- White 83% Hispanic / Latino 12% Two or more races 6%
- Hispanic origin (detail)
- Mexican 10%
- Common ancestry
- Romanian 3% Portuguese 3% Slovak 3%
- Foreign-born
- 5% · Canada
- Languages at home
- 94% English-only · Spanish 5%
Political lean MEDSL · Mohave
- 2024 margin
- Solid R (+55.8) · D 21.8% · R 77.6%
- 2008→2024 swing
- -22.9pp toward R · 2008: -32.9pp · 2024: -55.8pp
- All cycles
- 2024: R+55.8 2020: R+51.3 2016: R+51.5 2012: R+42.6 2008: R+32.9
Not yet ingested
- Civics
- —
Market trends
- HPI YoY
- ▼ -189.23%
- Current HPI
- 402.8832
- Rent YoY
- ▲ 0.66%
- Metro
- Lake Havasu City-Kingman, AZ
- State GDP YoY
- ▲ 4.54%
- F500 in state
- 20
Industry mix (Fortune 500 HQ in AZ)
| Industry | F500 HQs | Revenue |
|---|---|---|
| Technology | 2 | $13B |
|
||
| Mining / Metals | 1 | $23B |
|
||
| Environmental Services | 1 | $16B |
|
||
| Metals / Steel | 1 | $14B |
|
||
| Technology Distribution | 1 | $9B |
|
||
| Homebuilding | 1 | $8B |
|
||
Price history
-8.3% since first listed6 events — show timeline
- 2026-04-28 Price Changed $89,900 LHAR
- 2026-02-26 Listed $99,000 LHAR
- 2023-07-06 Relisted — LHAR
- 2023-07-05 Pending — LHAR
- 2023-04-04 Listed $109,700 LHAR
- 2022-12-09 Listed $98,000 LHAR
Cash-flow waterfall
monthlySold comps — $/sqft
last 12 mo · ≤1 miLoading sold comps…