 🏗️ New Construction
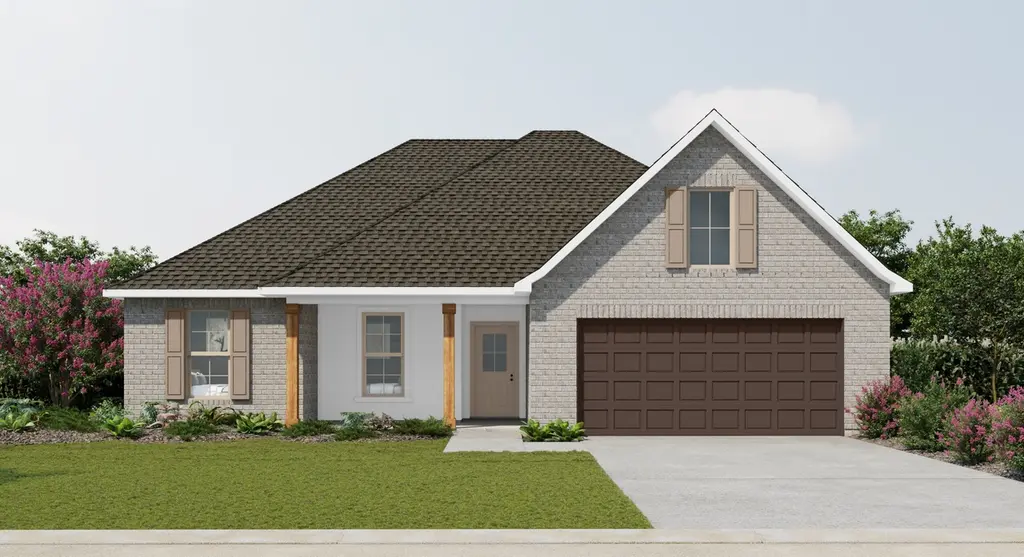
Ravenswood V A Plan · Sterlington, LA
Flood risk No data
- FEMA flood zone
- —
- Chance of flooding over 30 yrs
- —
- Est. flood insurance / yr
- —
Fire risk No data
- Est. fire insurance / yr
- —
Heat risk No data
- Hot days now (above threshold)
- —
- Hot days in 30 yrs
- —
Wind risk No data
- Chance of severe wind over 30 yrs
- —
Air-quality risk No data
- Unhealthy air days now
- —
- Unhealthy air days in 30 yrs
- —
Risk factors via First Street. Map © Google.
Why this score? — see what drove the D grade
The composite is a weighted blend of 9 inputs, each scored 0–100. Each bar is that input's sub-score; the figure is the points it added to the 100-point composite (weight × sub-score).
- Appreciation +10.0/10.0
- Cash flow +9.6/30.0
- ARV discount +7.5/15.0
- Livability +3.5/5.0
- Schools +3.2/10.0
- 1% rule +2.9/10.0
- DSCR +2.7/10.0
- Rent growth +2.5/5.0
- Condition / age +1.0/5.0
$268,990
🖨 Deal sheet 📄 Offer letter ✓ Due diligence
Listing remarks MLS
- Open Floor Plan - Four Bedrooms, Two Bathrooms - Brick and Stucco Exterior - Master garden tub - Separate master shower - Double master vanity - Canned lighting in kitchen - Covered rear patio - Two car garage
Key facts
- 2 garage spots
- Listed 953 days
Neighborhood map
What this means for you Summary
Snapshot
- This is a 4-bed/2.0-bath single-family listed at $269k. Condition is rated poor.
Deal economics
- At list price, monthly cash flow is $-217 ($-3k/yr) — negative.
- The deal already cash-flows at list — no discount required.
- To meet the 1% rule (rent ≥ 1% of price), the offer needs to be $250k (7.1% below list).
- Recommended offer: $237k (12.0% below list) — sets the bar for market timing.
Location & tenants
- Location reads 70/100 on livability (#60 in LA) — a middle-class / working-renter tenant base. Strengths: cost of living A+, housing A+, schools A-; Watch: health & safety D, amenities F, commute F.
- Ouachita Parish (suburban): math 31% / reading 45% proficiency, ranked #26 of 98 in LA (top 26%) — families likely to look elsewhere, expect single-tenant / working-renter base with shorter leases.
- Market conditions: 189 active listings in the ZIP; 1 comparable units currently listed for rent nearby; 345 units permitted in Ouachita Parish in 2024 (0 in 5+ unit buildings).
Forward outlook
- In year one you build about $34k of equity ($2k loan paydown + $32k appreciation (10.0% local appreciation)).
- By year 2, paydown + projected appreciation supports a ~$55k cash-out refi (75% LTV) — recoverable capital for the next deal without selling this one.
Negotiation context
- It's been on market 954 days — a 12% lower offer ($237k) is reasonable based on typical stale-listing flexibility.
Questions for the listing agent
- What do current leases actually rent for vs. the listed asking? Can we see a recent rent roll and the last 12 months of T-12 income?
- It's been on market 954 days. Have you received any prior offers? Is the seller open to a 12% concession, seller financing, or rate buy-down credit?
- Have any recent inspections been done? Can we get a copy of the seller's disclosures and any deferred-maintenance estimates?
- Why hasn't it sold? Are there any deal-killer items the seller is aware of (foundation, flood, title, zoning, code violations)?
- Is there a deadline driving the sale (1031 exchange, divorce, estate, relocation)? That informs how much negotiation room exists.
- Schools are A-rated — typically a magnet for longer-tenancy family renters. What's the average tenant stay here, and is there a school-zone premium baked into asking?
- The area grade is low — what's the realistic commute time and amenity access for the typical tenant pool here? Any planned neighborhood developments (good or bad) we should know about?
- What's the average days-on-market for RENTAL listings here right now (not sales)? A rising rental-DOM trend means longer vacancies and softer asking-rent achievability than the comps imply.
- What's the recent tenant-quality profile in this submarket — average credit score on applications, eviction rate, late-payment / NSF rate, and stable-employment percentage? A property-management company in the area should have these aggregated.
- How much new for-sale + rental construction is in the pipeline within 1–3 miles? Heavy new supply typically softens prices + rents 12–24 months out; constrained supply supports both.
Investment metrics
- 1% rule
- 0.79% ✗
- Cap rate
- 5.47%
- Cash-on-cash
- -2.93%
- DSCR
- 0.87
- GRM
- 10.6
CMA / ARV
- ARV (median comp)
- $317,204
- List price
- $268,990
- Delta
- -15.20%
- Verdict
- UNDERPRICED
- Comps
- 20 within 1.0 mi
Show comp detail 12 sales within ~0.75 mi
| Address | Dist | Beds/Ba | Sqft | Sold | Price | $/sf | Match |
|---|---|---|---|---|---|---|---|
| 301 Southern Grove Rd | 0.15mi | 3/2.0 (-1) | 1,926 (+2%) | 10mo | $280,000 | $145 | 76 |
| 304 Southern Grove Rd | 0.13mi | 3/2.0 (-1) | 2,020 (+7%) | 4mo | $289,000 | $143 | 74 |
| 107 Vieux Carre | 0.19mi | 3/2.0 (-1) | 1,800 (-4%) | 8mo | $315,000 | $175 | 72 |
| 211 Barker Dr | 0.48mi | 4/2.0 | 1,838 (-2%) | 2mo | $290,000 | $158 | 71 |
| 202 Thatcher Ln | 0.55mi | 4/2.0 | 1,863 (-1%) | 3mo | $305,000 | $164 | 70 |
| 302 Winkler Way | 0.33mi | 4/2.5 | 1,968 (+4%) | 13mo | $322,900 | $164 | 65 |
| 207 Winkler Way | 0.46mi | 3/2.0 (-1) | 1,967 (+4%) | 4mo | $305,000 | $155 | 63 |
| 207 Lynnhaven St | 0.15mi | 3/2.0 (-1) | 1,618 (-14%) | 10mo | $236,000 | $146 | 56 |
| 123 Vieux Carre Pl | 0.26mi | 3/2.0 (-1) | 1,675 (-11%) | 12mo | $325,000 | $194 | 55 |
| 121 Vieux Carre | 0.25mi | 3/2.0 (-1) | 1,680 (-11%) | 13mo | $325,000 | $193 | 54 |
| 414 Thatcher Ln | 0.22mi | 5/2.5 (+1) | 2,109 (+12%) | 11mo | $335,000 | $159 | 54 |
| 212 Hoover Dr | 0.50mi | 4/2.0 | 1,706 (-10%) | 10mo | $270,000 | $158 | 52 |
Match score weights: distance 35% · size 25% · config 20% · recency 20%. Top-matched comps best support the ARV.
Projected returns pro-forma
10.0% appreciation · 3.0% rent growth · sell at horizon
- IRR
- 22.2%
- Equity multiple
- 2.79×
- Total profit
- $158,967
- Equity at exit
- $285,762
- IRR
- 19.9%
- Equity multiple
- 6.39×
- Total profit
- $479,080
- Equity at exit
- $616,257
Cash invested: $88,817 (down + closing). Projections, not guarantees.
Landlord ↔ Tenant lean methodology
- Overall (STATE)
- 90 Strongly Landlord-Friendly
- State Louisiana
- 90 Strongly Landlord-Friendly · R+12
- County
- — inherits STATE
- City
- — inherits STATE
ZIP-level market 71280
- Home prices YoY
- 4.1%
- Active inventory
- 189
- Price-to-rent
- 9.0×
Monthly cashflow live
- Estimated rent
- $2,500 medium interval (Pro) →
- Mortgage (P&I)
- −$1,663
- Tax est. 1.5%
- −$397 /mo · $4,758/yr
- Insurance
- −$132
- HOA
- −$0
- Vacancy / Maint / Mgmt
- −$525
- Net cashflow
- $-217
Break-even live
UW: 25.0% down · 7.5% · 30yr · 1.5% tax · 5.0% vac · 8.0% maint · 8.0% mgmt
Financing live
Cash to close
- Down payment
- $79,301
- Closing costs
- $9,516
- Reserves months
- —
- Total cash needed
- —
Loan-product check · same deal, 3 products live
Conventional
25% down · 7.5% · 30yr
- Down + closing
- —
- Monthly P&I
- —
- Monthly cashflow
- —
- DSCR
- —
- Eligible?
- —
Personal DTI + credit; lowest rate.
DSCR
20% down · 8.5% · 30yr
- Down + closing
- —
- Monthly P&I
- —
- Monthly cashflow
- —
- DSCR
- —
- Eligible?
- —
No personal income docs; deal must DSCR.
Hard money
10% down · 12.0% · 12mo
- Down + closing
- —
- Monthly P&I
- —
- Monthly cashflow
- —
- DSCR
- —
- Eligible?
- —
Short-term bridge; refi at stabilization.
Rent comps 1 comps
| Address | Beds | Baths | Sqft | Rent | $/sqft | DOM | Units | Dist |
|---|---|---|---|---|---|---|---|---|
| 115 Lynnhaven St Monroe, LA | 3.0 | 2.0 | 1710 | $2,500 | $1.46 | 43d | 1 | 0.11mi |
Listing history 19 events
-
2026-06-19days on market $268,990 Active 954 DOM
-
2026-06-18days on market $268,990 Active 953 DOM
-
2026-06-17days on market $268,990 Active 952 DOM
-
2026-06-16days on market $268,990 Active 951 DOM
-
2026-06-15days on market $268,990 Active 950 DOM
-
2026-06-14days on market $268,990 Active 948 DOM
-
2026-06-13days on market $268,990 Active 947 DOM
-
2026-06-10days on market $268,990 Active 945 DOM
-
2026-06-09days on market $268,990 Active 944 DOM
-
2026-06-08days on market $268,990 Active 943 DOM
-
2026-06-07days on market $268,990 Active 942 DOM
-
2026-06-03days on market $268,990 Active 938 DOM
-
2026-06-02days on market $268,990 Active 937 DOM
-
2026-06-01days on market $268,990 Active 936 DOM
-
2026-05-31days on market $268,990 Active 935 DOM
-
2026-05-30days on market $268,990 Active 934 DOM
-
2026-04-14price $268,990 214-char remark
Show marketing remark (214 chars)
- Open Floor Plan - Four Bedrooms, Two Bathrooms - Brick and Stucco Exterior - Master garden tub - Separate master shower - Double master vanity - Canned lighting in kitchen - Covered rear patio - Two car garage
-
2023-11-20price $266,990 214-char remark
Show marketing remark (214 chars)
- Open Floor Plan - Four Bedrooms, Two Bathrooms - Brick and Stucco Exterior - Master garden tub - Separate master shower - Double master vanity - Canned lighting in kitchen - Covered rear patio - Two car garage
-
2023-11-08$260,990 Active 214-char remark
Show marketing remark (214 chars)
- Open Floor Plan - Four Bedrooms, Two Bathrooms - Brick and Stucco Exterior - Master garden tub - Separate master shower - Double master vanity - Canned lighting in kitchen - Covered rear patio - Two car garage
ⓘ Source: listings_history table (triggers on properties + properties_extension) + one-shot
backfill from property_details.listing_events for pre-trigger history.
Nearby sold comps map
Loading sold comps map…
Walkable amenities ~0.75 mi
Loading nearby amenities…
Taxation est. · year 1
- Rental income
- $30,000
- − Mortgage interest
- −$17,768
- − Property taxes
- −$4,758
- − Insurance
- −$1,586
- − Repairs & maintenance
- −$2,400
- − Management
- −$2,400
- − Depreciation
- −$9,228
- Taxable loss
- −$8,140
- Est. tax savings @ 24.0%
- +$1,954
- After-tax cash flow
- $-652/yr
For passive investors: Depreciation is non-cash, so a rental often shows a tax loss while cash-flowing — sheltering income. Rental losses are passive: they offset passive income freely, and up to $25,000/yr can offset ordinary (W-2) income if you actively participate and your MAGI is under $100k (phasing out to $0 by $150k); unused losses carry forward. On sale, claimed depreciation is recaptured at up to 25%, and gains may owe capital-gains tax (a 1031 exchange can defer both). Figures are a year-1 estimate at your 24.0% rate — not tax advice; consult a CPA.
Condition & rehab AI · 3 photos
The provided images and listing remarks indicate a conceptual design, not a real property. No physical property is visible, and the condition cannot be assessed. The property appears to be a large, open field with no structure or landscaping.
Schools (NCES district)
- District
- Ouachita Parish
- NCES district ID
- 2201200
- Math proficiency
- 31% ▼ -38.00%
- Reading proficiency
- 45% ▼ -31.00%
- Median HH income
- $43,316
- Composite
- 32.14/100
- National rank
- #5791
- State rank
- #26 of 98 in LA
Livability — Sterlington
- Score
- 70/100
- State rank
- #60
- US rank
- #7741
Category grades
Schools grade is shown separately in the Schools card above.
Census & demographics
- Population (ZIP)
- 4,999
Population outlook (Ouachita County) Hauer SSP2
- Today (2025)
- 163,370 people
- By 2030
- 165,520 · +1.3%
- By 2040
- 167,652 · +2.6%
- By 2050
- 166,699 · +2.0%
- By 2075
- 156,348 · -4.3%
- By 2100
- 134,102 · -17.9%
Race, ethnicity, and origin ACS 2023
- Neighborhood character
- Predominantly White (74%)
- Race & ethnicity
- White 74% Black 21% Hispanic / Latino 4%
- Common ancestry
- Lithuanian 4% Iranian 2% Danish 1%
- Foreign-born
- 3% · Canada, Jamaica
- Languages at home
- 98% English-only · Spanish 2%
Political lean MEDSL · Ouachita
- 2024 margin
- Strong R (+27.9) · D 35.5% · R 63.3% · Other 1.2%
- 2008→2024 swing
- -2.7pp toward R · 2008: -25.2pp · 2024: -27.9pp
- All cycles
- 2024: R+27.9 2020: R+23.6 2016: R+25.4 2012: R+20.9 2008: R+25.2
Not yet ingested
- Civics
- —
Market trends
- HPI YoY
- ▲ 11.14%
- Current HPI
- 283.4492
- Rent YoY
- —
- Metro
- —
- State GDP YoY
- ▲ 3.29%
- F500 in state
- 10
Industry mix (Fortune 500 HQ in LA)
| Industry | F500 HQs | Revenue |
|---|---|---|
| Telecommunications | 2 | $23B |
|
||
| Utilities | 1 | $12B |
|
||
| Wholesale / Distribution | 1 | $5B |
|
||
| Advertising | 1 | $2B |
|
||
Price history
+3.1% since first listed3 events — show timeline
- 2026-04-14 Price Changed $268,990 Zillow
- 2023-11-20 Price Changed $266,990 Zillow
- 2023-11-08 Listed $260,990 Zillow
Cash-flow waterfall
monthlySold comps — $/sqft
last 12 mo · ≤1 miLoading sold comps…