 Fourplex
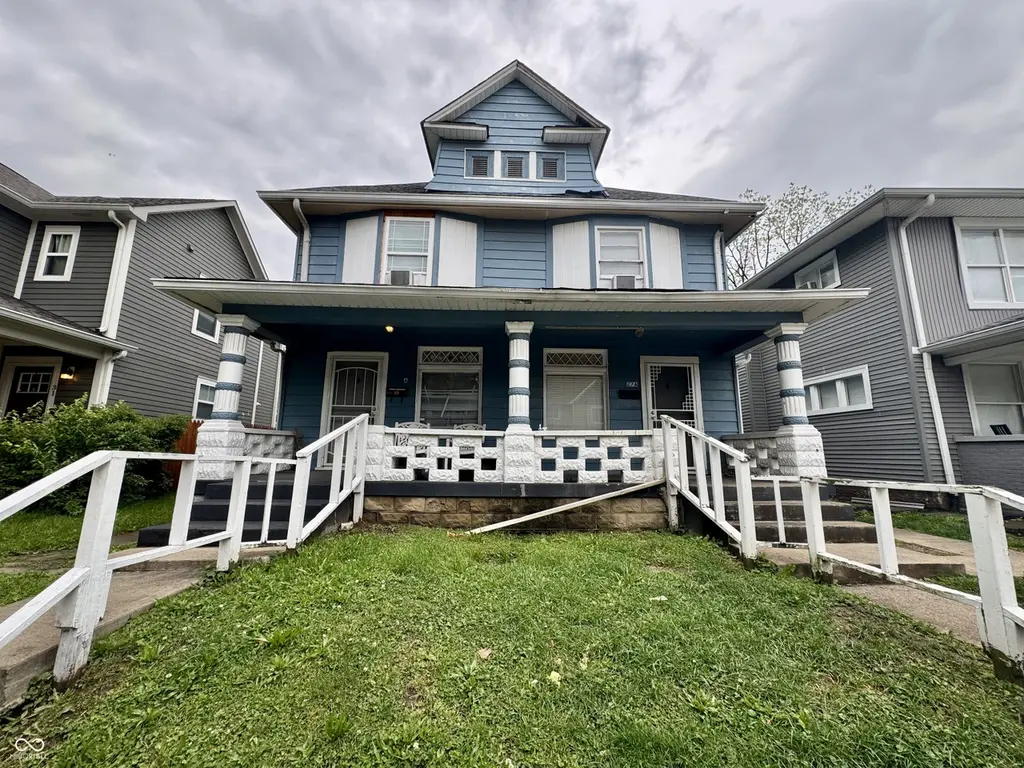
27 Parkview Ave · Indianapolis city (balance), IN
Flood risk 1/10 · Minimal
- FEMA flood zone
- X (unshaded)
- Chance of flooding over 30 yrs
- 0.0%
- Est. flood insurance / yr
- $473 – $860
Fire risk 1/10 · Minimal
- Est. fire insurance / yr
- $717 – $1,331
Heat risk 4/10 · Minor
- Hot days now (above 101°F)
- 7 days/yr
- Hot days in 30 yrs
- 19 days/yr
Wind risk 2/10 · Minimal
- Chance of severe wind over 30 yrs
- —
Air-quality risk 4/10 · Minor
- Unhealthy air days now
- 5 days/yr
- Unhealthy air days in 30 yrs
- 7 days/yr
Risk factors via First Street. Map © Google.
Why this score? — see what drove the B- grade
The composite is a weighted blend of 9 inputs, each scored 0–100. Each bar is that input's sub-score; the figure is the points it added to the 100-point composite (weight × sub-score).
- Cash flow +30.0/30.0
- 1% rule +10.0/10.0
- DSCR +10.0/10.0
- ARV discount +7.5/15.0
- Rent growth +4.3/5.0
- Livability +2.5/5.0
- Condition / age +2.5/5.0
- Schools +1.4/10.0
- Appreciation +0.0/10.0
$225,000
🖨 Deal sheet 📄 Offer letter ✓ Due diligence
Multi-family units
County records classify this as Multi-Family (2-4 Unit). Listing-text estimate: 4 units. confirmed
Listing remarks MLS
Listing for comp purposes only.
Key facts
- Remodeled kitchens
- Charming quadplex
- Remodeled bathrooms
Tags
Property features AI
Finance
- Other: Total of 4 units; At least one unit rents for $900/month (1-bedroom, monthly rent)
- Financial info: Gross scheduled income reported at $40,500; Reported expenses $6,851; Owner pays insurance, lawn care, taxes, sewer, trash collection, and water
- HOA & community: Not low-maintenance lifestyle
Exterior
- Utilities: Municipal water; Municipal sewer; No solid waste service listed
- Home design: Residential income property (quadruplex); Two levels
- Construction: Lot about 0.09 acre
- Exterior features: Converted property
Interior
- Kitchen: Unit kitchens present (at least one 1-bedroom unit noted)
- Bedrooms: Four total units (one 1-bedroom unit specified — 2 levels)
- Heating & cooling: Forced air heating; Window air conditioning units
- Interior features: Smoke alarm; Has basement
- Laundry & utility: No on-site laundry facilities
Neighborhood map
What this means for you Summary
Snapshot
- This is a 4 × 1-bed/1-bath units multifamily listed at $225k.
Deal economics
- At list price, monthly cash flow is $1k ($17k/yr) — positive. Per door: $359/mo.
- The deal already cash-flows at list — no discount required.
- Meets the 1% rule at list price ($4k rent vs $225k).
- Cap rate 14.0% vs local median 4.4% in Indianapolis city (balance) — top-decile yield for the area; either an underpriced asset or a hidden risk that comps aren't pricing in. Stress-test before assuming the spread holds.
Location & tenants
- Location reads: area grade B — affects rentability + tenant quality, not the cash-flow math above.
- Indianapolis Public Schools (urban): math 14% / reading 20% proficiency, ranked #286 of 301 in IN (top 95%) — low school quality limits family demand, transient renter base, plan for 1-2y turnover; 77% free/reduced lunch — lower-income household profile, screen leases tightly.
- Market conditions: Rents rising fast (+7.3%/yr); 480 active listings in the ZIP; 40 comparable units currently listed for rent nearby; rentals at typical pace (median 24d on market — plan ~3-4 weeks tenant-placement turnaround); 42% of comp listings sitting > 30 days — soft ceiling on asking rent; 1,906 units permitted in Marion County in 2024 (621 in 5+ unit buildings).
- At $3,893/mo this rent would consume 95% of the median local household income ($49k/yr) (locally 1906% of renters already pay >50% of income on rent) — very limited rent-growth headroom before tenants either downsize or default.
Forward outlook
- Local home prices are declining (-3.0%/yr); year-one equity from $2k of loan paydown is wiped out by about $7k of value loss. Plan a longer hold.
- Marion County population projected at +18% by 2050 — long-run rental-demand tailwind backs the buy-and-hold thesis.
- At projected returns (-3.0% appreciation + 7.3% rent growth), your $63k cash investment doubles in ~4 years — after that, you're playing with house money.
Negotiation context
- Only 4 days on market — expect competitive offers; lowballing is unlikely to land.
- 5 sale attempts since 20y ago with the ask held roughly flat each time — persistent listings suggest the price (not the market) is what's stuck; bring a comps-based counter.
- Current owner paid $10k; list at $225k implies a 2150% gain — meaningful room to come down on a strong offer.
Risks & watch-outs
- Watch-outs: built in 1911 — expect roof / HVAC / electrical / plumbing capex.
Questions for the listing agent
- Can we see the unit-by-unit rent roll, current vacancy, and any below-market leases? What's the average tenancy length?
- What capital expenditures (roof, boiler, parking lot, exteriors) have been made in the last 5 years, and what's planned in the next 2?
- Built in 1911 — when were the roof, HVAC, electrical panel, plumbing, and water heater last replaced?
- Is there a deadline driving the sale (1031 exchange, divorce, estate, relocation)? That informs how much negotiation room exists.
- What's the average days-on-market for RENTAL listings here right now (not sales)? A rising rental-DOM trend means longer vacancies and softer asking-rent achievability than the comps imply.
- What's the recent tenant-quality profile in this submarket — average credit score on applications, eviction rate, late-payment / NSF rate, and stable-employment percentage? A property-management company in the area should have these aggregated.
- How much new apartment / multifamily construction is in the pipeline within 1–3 miles? Heavy new supply (>2% of stock underway) typically softens rents 12–24 months out; light construction supports rent growth.
Investment metrics
- 1% rule
- 1.73% ✓
- Cap rate
- 13.95%
- Cash-on-cash
- 27.36%
- DSCR
- 2.22
- GRM
- 4.8
CMA / ARV
- ARV (on-the-fly)
- $145,314
- Comps found
- 8
Show comp detail 8 sales within ~0.75 mi
| Address | Dist | Beds/Ba | Sqft | Sold | Price | $/sf | Match |
|---|---|---|---|---|---|---|---|
| 1712 E Maryland St | 0.30mi | 2/3.0 (+1) | 1,299 (+5%) | 4mo | $226,000 | $174 | 55 |
| 224 N Tacoma Ave | 0.41mi | 2/2.0 (+1) | 1,200 (-3%) | 2mo | $140,000 | $117 | 54 |
| 228 N Tacoma Ave | 0.41mi | 1/2.0 | 1,200 (-3%) | 2mo | $140,000 | $117 | 53 |
| 422-424 Villa Ave | 0.56mi | 2/2.0 (+1) | 1,248 (+0%) | 2mo | $199,900 | $160 | 52 |
| 421 Villa Ave | 0.56mi | 2/2.0 (+1) | 1,186 (-4%) | 0mo | $140,000 | $118 | 46 |
| 1916 E Maryland St | 0.27mi | 2/2.0 (+1) | 1,100 (-11%) | 7mo | $80,000 | $73 | 42 |
| 37 S Rural St | 0.59mi | 1/2.0 | 1,108 (-11%) | 7mo | $58,330 | $53 | 29 |
| 245 S Rural St | 0.66mi | 1/2.0 | 1,400 (+13%) | 14mo | $110,000 | $79 | 17 |
Match score weights: distance 35% · size 25% · config 20% · recency 20%. Top-matched comps best support the ARV.
Projected returns pro-forma
-3.0% appreciation · 7.31% rent growth · sell at horizon
- IRR
- 26.3%
- Equity multiple
- 2.15×
- Total profit
- $72,746
- Equity at exit
- $33,548
- IRR
- 36.6%
- Equity multiple
- 5.14×
- Total profit
- $260,603
- Equity at exit
- $19,454
Cash invested: $63,000 (down + closing). Projections, not guarantees.
Landlord ↔ Tenant lean methodology
- Overall (STATE)
- 90 Strongly Landlord-Friendly
- State Indiana
- 90 Strongly Landlord-Friendly · R+11
- County
- — inherits STATE
- City
- — inherits STATE
ZIP-level market 46201
- Home prices YoY
- -33.9%
- Rents YoY
- 7.3%
- Active inventory
- 480
- Price-to-rent
- 19.3×
Monthly cashflow live
- Estimated rent
- $3,893 high interval (Pro) →
- Mortgage (P&I)
- −$1,180
- Tax from tax record
- −$365 /mo · $4,386/yr
- Insurance
- −$94
- HOA
- −$0
- Vacancy / Maint / Mgmt
- −$818
- Net cashflow
- $1,436
Break-even live
4-unit breakdown (identical units grouped — click to expand)
| Units | Beds | Baths | Est. rent |
|---|---|---|---|
| 4× units | 1 | 1 | $3,892 |
| #1 | 1 | 1 | $973 |
| #2 | 1 | 1 | $973 |
| #3 | 1 | 1 | $973 |
| #4 | 1 | 1 | $973 |
| Total (4 units) | $3,893 | ||
UW: 25.0% down · 7.5% · 30yr · 1.5% tax · 5.0% vac · 8.0% maint · 8.0% mgmt
Financing live
Cash to close
- Down payment
- $56,250
- Closing costs
- $6,750
- Reserves months
- —
- Total cash needed
- —
Loan-product check · same deal, 3 products live
Conventional
25% down · 7.5% · 30yr
- Down + closing
- —
- Monthly P&I
- —
- Monthly cashflow
- —
- DSCR
- —
- Eligible?
- —
Personal DTI + credit; lowest rate.
DSCR
20% down · 8.5% · 30yr
- Down + closing
- —
- Monthly P&I
- —
- Monthly cashflow
- —
- DSCR
- —
- Eligible?
- —
No personal income docs; deal must DSCR.
Hard money
10% down · 12.0% · 12mo
- Down + closing
- —
- Monthly P&I
- —
- Monthly cashflow
- —
- DSCR
- —
- Eligible?
- —
Short-term bridge; refi at stabilization.
Rent comps 40 comps
| Address | Beds | Baths | Sqft | Rent | $/sqft | DOM | Units | Dist |
|---|---|---|---|---|---|---|---|---|
| 228 N Randolph St Indianapolis, IN | 2.0 | 2.0 | 1008 | $1,695 | $1.68 | 43d | 1 | 0.15mi |
| 225 N Hamilton Ave Indianapolis, IN | 2.0 | 2.0 | 1008 | $1,695 | $1.68 | 43d | 1 | 0.19mi |
| 1529 E Ohio St Indianapolis, IN | 2.0 | 1.0 | 1118 | $1,299 | $1.16 | 43d | 1 | 0.29mi |
| 1718 Southeastern Ave Indianapolis, IN | 1.0 | 1.0 | 700 | $1,080 | $1.54 | 43d | 1 | 0.33mi |
| 2015 Southeastern Ave Unit 2015 Indianapolis, IN | 2.0 | 2.5 | 1350 | $2,200 | $1.63 | 23d | 1 | 0.37mi |
| 437 N State Ave Indianapolis, IN | 2.0 | 1.5 | 933 | $1,350 | $1.45 | 12d | 1 | 0.38mi |
| 437 N State Ave Indianapolis, IN | 2.0 | 1.5 | 933 | $1,500 | $1.61 | 43d | 1 | 0.38mi |
| 437 N State Ave Indianapolis, IN | 2.0 | 1.5 | 933 | $1,350 | $1.45 | 23d | 1 | 0.38mi |
| 225 Hamilton Ave Indianapolis, IN | 2.0 | 2.0 | 1008 | $1,695 | $1.68 | 43d | 1 | 0.40mi |
| 245 S Randolph St Indianapolis, IN | 2.0 | 1.0 | 720 | $750 | $1.04 | 43d | 1 | 0.40mi |
| 247 S Randolph St Indianapolis, IN | 2.0 | 1.0 | 720 | $750 | $1.04 | 43d | 1 | 0.41mi |
| 224 N Tacoma Ave Unit B TACOMA Indianapolis, IN | 1.0 | 1.0 | 1200 | $799 | $0.67 | 7d | 1 | 0.41mi |
| 332 N Arsenal Ave Unit A Indianapolis, IN | 2.0 | 1.0 | 750 | $1,150 | $1.53 | 7d | 1 | 0.42mi |
| 330 N Arsenal Ave Unit B Indianapolis, IN | 2.0 | 1.0 | 700 | $1,100 | $1.57 | 7d | 1 | 0.42mi |
| 471 N State Ave Apt 4 Indianapolis, IN | 1.0 | 1.0 | 800 | $865 | $1.08 | 20d | 1 | 0.45mi |
| 1515 E Michigan St Apt 2 Indianapolis, IN | 1.0 | 1.0 | 700 | $825 | $1.18 | 20d | 1 | 0.53mi |
| 420 Harlan St Indianapolis, IN | 2.0 | 2.0 | 1260 | $1,500 | $1.19 | 23d | 1 | 0.53mi |
| 1404 E Vermont St Indianapolis, IN | 2.0 | 2.5 | 1353 | $1,950 | $1.44 | 43d | 1 | 0.54mi |
| 49 S Rural St Indianapolis, IN | 2.0 | 1.5 | 750 | $950 | $1.27 | 10d | 1 | 0.58mi |
| 313 Eastern Ave Indianapolis, IN | 2.0 | 1.0 | 1040 | $950 | $0.91 | 21d | 1 | 0.58mi |
| 621 Tecumseh St Indianapolis, IN | 2.0 | 1.0 | 726 | $1,025 | $1.41 | 43d | 1 | 0.63mi |
| 1117 E Market St Indianapolis, IN | 2.0 | 1.0–2.0 | 803 | $1,592 | $1.98 | 2d | 15 | 0.63mi |
| 518 S State Ave Indianapolis, IN | 2.0 | 1.0 | 900 | $725 | $0.81 | 43d | 1 | 0.64mi |
| 2320 Spann Ave Indianapolis, IN | 2.0 | 2.0 | 1219 | $1,795 | $1.47 | 16d | 1 | 0.66mi |
| 330 S Rural St Indianapolis, IN | 2.0 | 1.0 | 960 | $1,050 | $1.09 | 7d | 1 | 0.69mi |
| 1145 Bates St Indianapolis, IN | 2.0 | 1.0 | 1065 | $1,500 | $1.41 | 21d | 1 | 0.70mi |
| 784 Woodruff Place Middle Dr Indianapolis, IN | 1.0 | 1.0 | 750 | $1,300 | $1.73 | 43d | 1 | 0.72mi |
| 2810 E Michigan St Unit C Indianapolis, IN | 2.0 | 1.5 | 949 | $1,350 | $1.42 | 43d | 1 | 0.74mi |
| 2814 E Michigan St Unit D Indianapolis, IN | 2.0 | 1.5 | 949 | $1,350 | $1.42 | 43d | 1 | 0.74mi |
| 235 N Oakland Ave Indianapolis, IN | 2.0 | 1.0 | 800 | $1,000 | $1.25 | 43d | 1 | 0.78mi |
| 408 N Oakland Ave Unit A Indianapolis, IN | 2.0 | 2.0 | 1100 | $995 | $0.90 | 17d | 1 | 0.81mi |
| 1449 Fletcher Ave Indianapolis, IN | 2.0 | 2.0 | 1000 | $2,000 | $2.00 | 17d | 1 | 0.81mi |
| 28 S Dearborn St Unit B Indianapolis, IN | 2.0 | 1.5 | 1166 | $1,150 | $0.99 | 23d | 1 | 0.86mi |
| 301 S Gray St Indianapolis, IN | 2.0 | 1.0 | 841 | $1,025 | $1.22 | 23d | 1 | 0.89mi |
| 1118 E Saint Clair St Indianapolis, IN | 2.0 | 2.0 | 984 | $2,200 | $2.24 | 43d | 1 | 0.91mi |
| 1148 Fletcher Ave Indianapolis, IN | 2.0 | 1.0 | 900 | $1,800 | $2.00 | 17d | 1 | 0.92mi |
| 2116 Woodlawn Ave Indianapolis, IN | 2.0 | 2.0 | 1054 | $1,175 | $1.11 | 7d | 1 | 0.93mi |
| 1730 Alloy Dr Indianapolis, IN | 2.0 | 2.5 | 1350 | $2,400 | $1.78 | 23d | 1 | 0.94mi |
| 2230 Woodlawn Ave Indianapolis, IN | 2.0 | 1.0 | 924 | $1,350 | $1.46 | 43d | 1 | 0.95mi |
| 340 S Dearborn St Indianapolis, IN | 2.0 | 1.0 | 873 | $1,180 | $1.35 | 23d | 1 | 0.95mi |
Listing history 10 events
-
2026-05-20status Pending
-
2026-05-16$225,000 Active
-
2015-07-15soldstatus $10,000 Sold 31-char remark
Show marketing remark (31 chars)
Listing for comp purposes only.
-
2015-05-22$10,000 31-char remark
Show marketing remark (31 chars)
Listing for comp purposes only.
-
2015-05-20historical
-
2015-05-20$10,000
-
2008-02-21soldstatus $10,100
-
2007-12-31$13,900
-
2007-04-21historical
-
2006-04-25$89,850
ⓘ Source: listings_history table (triggers on properties + properties_extension) + one-shot
backfill from property_details.listing_events for pre-trigger history.
Tax reassessment forecast IN · Partial reset (capped growth)
- Current annual tax
- $4,386 · $365/mo
- Projected year-2 tax
- $4,386 · $365/mo
- Expected delta
- $0/yr ($0/mo · 0.0%)
ⓘ Screening estimate from a state-policy table — verify with the county assessor before closing.
Climate risk First Street
- Flood 1/10 Low FEMA zone X (unshaded) · 0% chance over 30 yrs
- Wildfire 1/10 Low
- Heat 4/10 Moderate 7 d/yr ≥101°F today · 19 d/yr by 30 yrs out
- Wind 2/10 Low
- Air quality 4/10 Moderate 5 unhealthy d/yr today · 7 by 30 yrs out
Nearby sold comps map
Loading sold comps map…
Walkable amenities ~0.75 mi
Loading nearby amenities…
Taxation est. · year 1
- Rental income
- $46,716
- − Mortgage interest
- −$12,603
- − Property taxes
- −$4,386
- − Insurance
- −$1,125
- − Repairs & maintenance
- −$3,737
- − Management
- −$3,737
- − Depreciation
- −$6,545
- Taxable income
- $14,582
- Est. tax owed @ 24.0%
- −$3,500
- After-tax cash flow
- $13,736/yr
For passive investors: Depreciation is non-cash, so a rental often shows a tax loss while cash-flowing — sheltering income. Rental losses are passive: they offset passive income freely, and up to $25,000/yr can offset ordinary (W-2) income if you actively participate and your MAGI is under $100k (phasing out to $0 by $150k); unused losses carry forward. On sale, claimed depreciation is recaptured at up to 25%, and gains may owe capital-gains tax (a 1031 exchange can defer both). Figures are a year-1 estimate at your 24.0% rate — not tax advice; consult a CPA.
Schools (NCES district)
- District
- Indianapolis Public Schools
- NCES district ID
- 1804770
- Math proficiency
- 14% ▼ -7.00%
- Reading proficiency
- 20% ▼ -3.00%
- Median HH income
- $32,034
- Composite
- 13.69/100
- National rank
- #9499
- State rank
- #286 of 301 in IN
Livability — Indianapolis city (balance)
No livability data for this city. (Only ~50 U.S. cities are tracked.)
Census & demographics
- Census place
- Indianapolis city (balance), IN
- County
- Marion County · 998,460 people
- City population
- 881,119
- Metro
- Indianapolis-Carmel-Anderson, IN
- Population (ZIP)
- 30,335
- Household income
- $49,195
- Rent vs Own
- Severe rent burden
- 1906.0
Population outlook (Marion County) Hauer SSP2
- Today (2025)
- 1,025,572 people
- By 2030
- 1,065,727 · +3.9%
- By 2040
- 1,141,577 · +11.3%
- By 2050
- 1,208,920 · +17.9%
- By 2075
- 1,367,288 · +33.3%
- By 2100
- 1,438,201 · +40.2%
Race, ethnicity, and origin ACS 2023
- Neighborhood character
- Diverse neighborhood (Simpson 0.63)
- Race & ethnicity
- White 53% Hispanic / Latino 23% Black 18% Two or more races 9%
- Hispanic origin (detail)
- Mexican 14% Puerto Rican 2%
- Common ancestry
- Slovak 2% Lithuanian 2% Italian 1%
- Foreign-born
- 9% · Canada
- Languages at home
- 81% English-only · Spanish 17%
Political lean MEDSL · Marion
- 2024 margin
- Strong D (+27.7) · D 63.0% · R 35.3% · Other 1.7%
- 2008→2024 swing
- -0.7pp no change · 2008: 28.4pp · 2024: 27.7pp
- All cycles
- 2024: D+27.7 2020: D+29.1 2016: D+22.8 2012: D+22.2 2008: D+28.4
Not yet ingested
- Civics
- —
Market trends
- HPI YoY
- ▼ -192.51%
- Current HPI
- 375.0969
- Rent YoY
- ▲ 7.31%
- Metro
- Indianapolis-Carmel-Anderson, IN
- State GDP YoY
- ▲ 2.90%
- F500 in state
- 18
Industry mix (Fortune 500 HQ in IN)
| Industry | F500 HQs | Revenue |
|---|---|---|
| Industrial Machinery | 2 | $37B |
|
||
| Healthcare | 1 | $177B |
|
||
| Pharmaceuticals | 1 | $45B |
|
||
| Metals / Steel | 1 | $18B |
|
||
| Agriculture | 1 | $17B |
|
||
| Packaging | 1 | $12B |
|
||
Price history
+150.4% since first listed10 events — show timeline
- 2026-05-20 Pending — MIBOR as Distributed by MLS Grid
- 2026-05-16 Listed $225,000 MIBOR as Distributed by MLS Grid
- 2015-07-15 Sold (MLS) $10,000 MIBOR as Distributed by MLS Grid
- 2015-05-22 Listed $10,000 MIBOR as Distributed by MLS Grid
- 2015-05-20 Listing Removed — MIBOR as Distributed by MLS Grid
- 2015-05-20 Listed $10,000 MIBOR as Distributed by MLS Grid
- 2008-02-21 Sold (MLS) $10,100 MIBOR as Distributed by MLS Grid
- 2007-12-31 Listed $13,900 MIBOR as Distributed by MLS Grid
- 2007-04-21 Listing Removed — MIBOR as Distributed by MLS Grid
- 2006-04-25 Listed $89,850 MIBOR as Distributed by MLS Grid
Property tax history
+11.6%/yrLatest (2025): $4,386 · -8.8% YoY. Source: county tax records.
Cash-flow waterfall
monthlySold comps — $/sqft
last 12 mo · ≤1 miLoading sold comps…