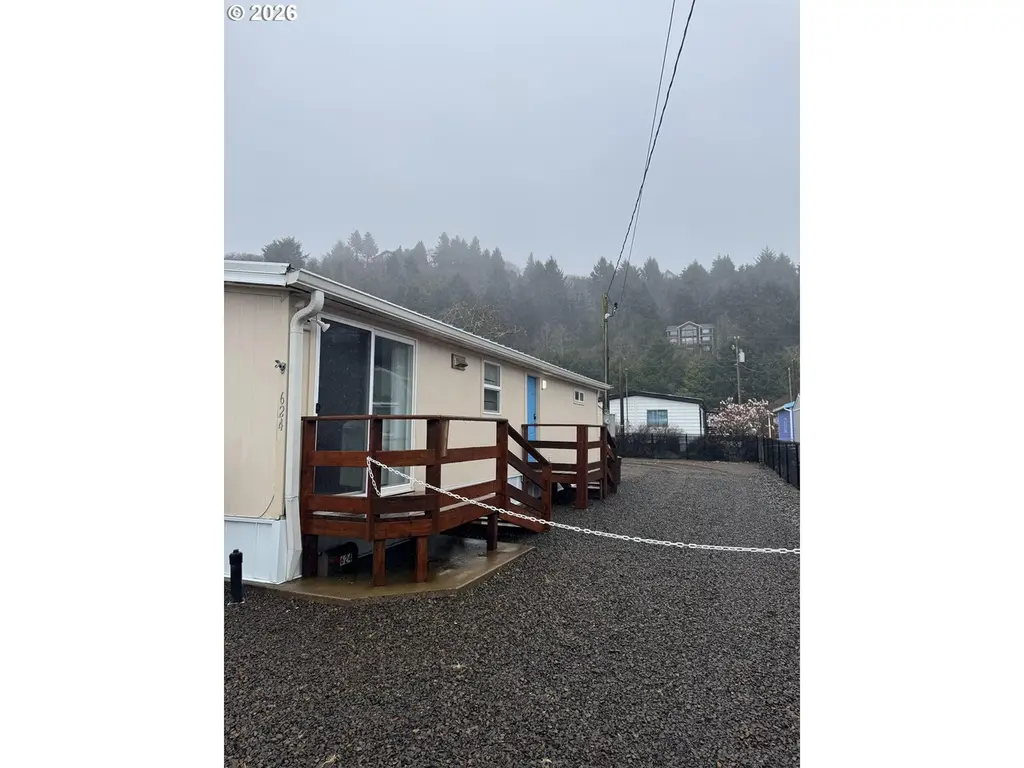
624 S Dolphin St S · Rockaway Beach, OR
Flood risk 4/10 · Minor
- FEMA flood zone
- X (unshaded)
- Chance of flooding over 30 yrs
- 0.22%
- Est. flood insurance / yr
- $473 – $860
Fire risk 2/10 · Minimal
- Est. fire insurance / yr
- $498 – $926
Heat risk 1/10 · Minimal
- Hot days now (above 76°F)
- 9 days/yr
- Hot days in 30 yrs
- 20 days/yr
Wind risk 1/10 · Minimal
- Chance of severe wind over 30 yrs
- —
Air-quality risk 6/10 · Moderate
- Unhealthy air days now
- 8 days/yr
- Unhealthy air days in 30 yrs
- 9 days/yr
Risk factors via First Street. Map © Google.
Why this score? — see what drove the B grade
The composite is a weighted blend of 9 inputs, each scored 0–100. Each bar is that input's sub-score; the figure is the points it added to the 100-point composite (weight × sub-score).
- Cash flow +30.0/30.0
- 1% rule +10.0/10.0
- DSCR +10.0/10.0
- ARV discount +7.5/15.0
- Schools +4.2/10.0
- Livability +3.7/5.0
- Rent growth +2.5/5.0
- Condition / age +2.5/5.0
- Appreciation +0.0/10.0
$299,000
🖨 Deal sheet (PDF) 📄 Offer letter ✓ Due diligence
Listing remarks MLS
Fisherman's delight with room to store your Boat and RV. Professionally renovated home located three blocks to the beach. Light and Bright 2 bedroom 1 full bath open floor plan. Refreshed interior with new windows and custom accordion blinds new kitchen counters, subway tile backsplash and farm sink. New appliances include a refrigerator, dishwasher, range-oven, microwave oven, garbage disposal and water heater. New LED lighting throughout with adjustable brightness feature. Hardy Metal roof adds peace of mind. Handy NEW LEAF GUTTER SYSTEM with warranty and New Tuff Shed to store toys. Turn Key amenities include a potable ice maker, dishware, utensils, liens and etc.
Key facts
- Open floor plan
- Tuff shed
- New siding
Tags
Neighborhood map
What this means for you Summary
Snapshot
- This is a 2-bed/2.0-bath manufactured listed at $299k.
Deal economics
- At list price, monthly cash flow is $2k ($23k/yr) — positive.
- The deal already cash-flows at list — no discount required.
- Meets the 1% rule at list price ($5k rent vs $299k).
- Recommended offer: $263k (12.0% below list) — sets the bar for market timing.
- Cap rate 14.1% vs local median 6.6% in Rockaway Beach — top-decile yield for the area; either an underpriced asset or a hidden risk that comps aren't pricing in. Stress-test before assuming the spread holds.
Location & tenants
- Location reads 74/100 on livability (#94 in OR, #4,777 nationally) — a middle-class / working-renter tenant base. Strengths: crime A+, housing A+, cost of living A-; Watch: health & safety C-, employment D, amenities F.
- Neah-Kah-Nie SD 56 (rural): math 39% / reading 55% proficiency, ranked #62 of 183 in OR (top 34%) — families likely to look elsewhere, expect single-tenant / working-renter base with shorter leases.
- Market conditions: 130 active listings in the ZIP; 2 comparable units currently listed for rent nearby; 86 units permitted in Tillamook County in 2024 (0 in 5+ unit buildings).
Forward outlook
- Local home prices are declining (-3.0%/yr); year-one equity from $2k of loan paydown is wiped out by about $9k of value loss. Plan a longer hold.
- Tillamook County population projected at +3% by 2050 — modest demand growth; plan on rents tracking national, not racing it.
- At projected returns (-3.0% appreciation + 3.0% rent growth), your $84k cash investment doubles in ~5 years — after that, you're playing with house money.
Negotiation context
- It's been on market 158 days — a 12% lower offer ($263k) is reasonable based on typical stale-listing flexibility.
- 10 sale attempts since 9y ago; this cycle's ask has dropped $20k (6%) from the opening price — seller is motivated, your offer sets the floor, not the list.
- Current owner paid $243k; 23% above their basis — modest negotiation headroom, anchor on the comps not their cost.
Questions for the listing agent
- It's been on market 158 days. Have you received any prior offers? Is the seller open to a 12% concession, seller financing, or rate buy-down credit?
- Why hasn't it sold? Are there any deal-killer items the seller is aware of (foundation, flood, title, zoning, code violations)?
- Is there a deadline driving the sale (1031 exchange, divorce, estate, relocation)? That informs how much negotiation room exists.
- What's the average days-on-market for RENTAL listings here right now (not sales)? A rising rental-DOM trend means longer vacancies and softer asking-rent achievability than the comps imply.
- What's the recent tenant-quality profile in this submarket — average credit score on applications, eviction rate, late-payment / NSF rate, and stable-employment percentage? A property-management company in the area should have these aggregated.
- How much new for-sale + rental construction is in the pipeline within 1–3 miles? Heavy new supply typically softens prices + rents 12–24 months out; constrained supply supports both.
Investment metrics
- 1% rule
- 1.57% ✓
- Cap rate
- 14.07%
- Cash-on-cash
- 27.77%
- DSCR
- 2.24
- GRM
- 5.3
CMA / ARV
- ARV (median comp)
- $184,324
- List price
- $299,000
- Delta
- 62.21%
- Verdict
- OVERPRICED
- Comps
- 5 within 1.0 mi
Show comp detail 6 sales within ~0.75 mi
| Address | Dist | Beds/Ba | Sqft | Sold | Price | $/sf | Match |
|---|---|---|---|---|---|---|---|
| 923 S Harbor St | 0.28mi | 3/2.0 (+1) | 924 (-4%) | 8mo | $189,000 | $205 | 69 |
| 930 S Easy St | 0.25mi | 2/1.0 | 917 (-4%) | 20mo | $240,000 | $262 | 60 |
| 1098 S Harbor St | 0.41mi | 2/1.0 | 924 (-4%) | 20mo | $200,000 | $216 | 54 |
| 8035 Hollyhock St | 0.57mi | 2/2.0 | 1,092 (+14%) | 9mo | $245,500 | $225 | 43 |
| 176 S Coral St | 0.52mi | 2/2.0 | 1,080 (+12%) | 20mo | $265,000 | $245 | 38 |
| 145 S Dolphin St | 0.55mi | 3/2.0 (+1) | 1,100 (+15%) | 22mo | $315,000 | $286 | 27 |
Match score weights: distance 35% · size 25% · config 20% · recency 20%. Top-matched comps best support the ARV.
Projected returns pro-forma
-3.0% appreciation · 3.0% rent growth · sell at horizon
- IRR
- 21.8%
- Equity multiple
- 1.89×
- Total profit
- $74,831
- Equity at exit
- $44,582
- IRR
- 29.9%
- Equity multiple
- 3.67×
- Total profit
- $223,583
- Equity at exit
- $25,852
Cash invested: $83,720 (down + closing). Projections, not guarantees.
Landlord ↔ Tenant lean methodology
- Overall (STATE)
- 28 Tenant-Leaning
- State Oregon
- 28 Tenant-Leaning · D+6
- County
- — inherits STATE
- City
- — inherits STATE
ZIP-level market 97136
- Home prices YoY
- -34.6%
- Active inventory
- 130
- Price-to-rent
- 5.3×
Monthly cashflow live
- Estimated rent
- $4,682 medium interval (Pro) →
- Mortgage (P&I)
- −$1,568
- Tax from tax record
- −$69 /mo · $826/yr
- Insurance
- −$125
- HOA
- −$0
- Vacancy / Maint / Mgmt
- −$983
- Net cashflow
- $1,937
Break-even live
Sensitivity live
| Price | -10% $2,107 | -5% $2,022 | +0% $1,937 | +5% $1,853 | +10% $1,768 |
|---|---|---|---|---|---|
| Rent | -10% $1,568 | -5% $1,753 | +0% $1,937 | +5% $2,122 | +10% $2,307 |
| Rate | -1.0pp $2,088 | -0.5pp $2,014 | base $1,937 | +0.5pp $1,860 | +1.0pp $1,781 |
UW: 25.0% down · 7.5% · 30yr · 1.5% tax · 5.0% vac · 8.0% maint · 8.0% mgmt
Financing live
Cash to close
- Down payment
- $74,750
- Closing costs
- $8,970
- Reserves months
- —
- Total cash needed
- —
Loan-product check · same deal, 3 products live
Conventional
25% down · 7.5% · 30yr
- Down + closing
- —
- Monthly P&I
- —
- Monthly cashflow
- —
- DSCR
- —
- Eligible?
- —
Personal DTI + credit; lowest rate.
DSCR
20% down · 8.5% · 30yr
- Down + closing
- —
- Monthly P&I
- —
- Monthly cashflow
- —
- DSCR
- —
- Eligible?
- —
No personal income docs; deal must DSCR.
Hard money
10% down · 12.0% · 12mo
- Down + closing
- —
- Monthly P&I
- —
- Monthly cashflow
- —
- DSCR
- —
- Eligible?
- —
Short-term bridge; refi at stabilization.
Rent comps 2 comps
| Address | Beds | Baths | Sqft | Rent | $/sqft | DOM | Units | Dist |
|---|---|---|---|---|---|---|---|---|
| 145 N Dolphin St Rockaway Beach, OR | 2.0 | 2.0 | 1020 | $6,000 | $5.88 | 45d | 1 | 0.70mi |
| 406 N 3rd Ave Rockaway Beach, OR | 2.0 | 1.0 | 762 | $3,000 | $3.94 | 45d | 1 | 0.75mi |
Listing history 36 events
-
2026-06-09statusdays on market $299,000 Pending 158 DOM
-
2026-06-08days on market $299,000 Active 157 DOM
-
2026-06-08days on market $299,000 Active 156 DOM
-
2026-06-07days on market $299,000 Active 155 DOM
-
2026-06-04days on market $299,000 Active 152 DOM
-
2026-06-02days on market $299,000 Active 151 DOM
-
2026-06-01days on market $299,000 Active 150 DOM
-
2026-05-31days on market $299,000 Active 149 DOM
-
2026-03-26price $299,000 675-char remark
Show marketing remark (675 chars)
Fisherman's delight with room to store your Boat and RV. Professionally renovated home located three blocks to the beach. Light and Bright 2 bedroom 1 full bath open floor plan. Refreshed interior with new windows and custom accordion blinds new kitchen counters, subway tile backsplash and farm sink. New appliances include a refrigerator, dishwasher, range-oven, microwave oven, garbage disposal and water heater. New LED lighting throughout with adjustable brightness feature. Hardy Metal roof adds peace of mind. Handy NEW LEAF GUTTER SYSTEM with warranty and New Tuff Shed to store toys. Turn Key amenities include a potable ice maker, dishware, utensils, liens and etc.
-
2026-01-02$319,000 Active 675-char remark
Show marketing remark (675 chars)
Fisherman's delight with room to store your Boat and RV. Professionally renovated home located three blocks to the beach. Light and Bright 2 bedroom 1 full bath open floor plan. Refreshed interior with new windows and custom accordion blinds new kitchen counters, subway tile backsplash and farm sink. New appliances include a refrigerator, dishwasher, range-oven, microwave oven, garbage disposal and water heater. New LED lighting throughout with adjustable brightness feature. Hardy Metal roof adds peace of mind. Handy NEW LEAF GUTTER SYSTEM with warranty and New Tuff Shed to store toys. Turn Key amenities include a potable ice maker, dishware, utensils, liens and etc.
-
2025-08-20price $349,000
-
2025-08-14$369,000 Active
-
2025-07-14$369,000 Active
-
2024-05-24soldstatus $243,000 Closed
-
2024-05-24soldstatus $243,000 Closed
-
2024-05-24soldstatus $243,000 Closed
-
2024-05-24soldstatus $243,000
-
2024-05-09status Pending
-
2024-05-09price $269,900
-
2024-05-09status Pending - Accepting Backups
-
2024-04-24status Active
-
2024-04-24status Active
-
2024-04-15status Pending
-
2024-04-15status Pending - Accepting Backups
-
2024-04-11price $269,900
-
2024-04-11price $269,900
-
2024-03-28price $279,900
-
2024-03-28price $279,900
-
2024-03-14$289,900 Active
-
2024-03-14$289,900 Active
-
2024-01-18$225,000 Active
-
2018-03-13soldstatus $80,750
-
2018-03-13soldstatus $80,750
-
2017-10-18$80,750
-
2017-10-18$80,750
-
2000-07-14soldstatus $75,000
ⓘ Source: listings_history table (triggers on properties + properties_extension) + one-shot
backfill from property_details.listing_events for pre-trigger history.
Tax reassessment forecast OR · Resets to sale price
- Current annual tax
- $826 · $69/mo
- Projected year-2 tax
- $2,900 · $242/mo
- Expected delta
- +$2,075/yr (+$173/mo · 251.2%)
ⓘ Screening estimate from a state-policy table — verify with the county assessor before closing.
Climate risk First Street
- Flood 4/10 Moderate FEMA zone X (unshaded) · 22% chance over 30 yrs
- Wildfire 2/10 Low
- Heat 1/10 Low 9 d/yr ≥76°F today · 20 d/yr by 30 yrs out
- Wind 1/10 Low
- Air quality 6/10 Major 8 unhealthy d/yr today · 9 by 30 yrs out
Nearby sold comps map
Loading sold comps map…
Walkable amenities ~0.75 mi
Loading nearby amenities…
Taxation est. · year 1
- Rental income
- $56,185
- − Mortgage interest
- −$16,749
- − Property taxes
- −$826
- − Insurance
- −$1,495
- − Repairs & maintenance
- −$4,495
- − Management
- −$4,495
- − Depreciation
- −$8,698
- Taxable income
- $19,428
- Est. tax owed @ 24.0%
- −$4,663
- After-tax cash flow
- $18,587/yr
For passive investors: Depreciation is non-cash, so a rental often shows a tax loss while cash-flowing — sheltering income. Rental losses are passive: they offset passive income freely, and up to $25,000/yr can offset ordinary (W-2) income if you actively participate and your MAGI is under $100k (phasing out to $0 by $150k); unused losses carry forward. On sale, claimed depreciation is recaptured at up to 25%, and gains may owe capital-gains tax (a 1031 exchange can defer both). Figures are a year-1 estimate at your 24.0% rate — not tax advice; consult a CPA.
Schools (NCES district)
- District
- Neah-Kah-Nie SD 56
- NCES district ID
- 4108650
- Math proficiency
- 39% ▼ -4.00%
- Reading proficiency
- 55% ▼ -4.00%
- Median HH income
- $42,437
- Composite
- 41.68/100
- National rank
- #7205
- State rank
- #62 of 183 in OR
Livability — Rockaway Beach
- Score
- 74/100
- State rank
- #94
- US rank
- #4777
Category grades
Schools grade is shown separately in the Schools card above.
Census & demographics
- Census place
- Rockaway Beach, OR
- Population (ZIP)
- 2,422
Population outlook (Tillamook County) Hauer SSP2
- Today (2025)
- 26,318 people
- By 2030
- 26,603 · +1.1%
- By 2040
- 26,898 · +2.2%
- By 2050
- 27,129 · +3.1%
- By 2075
- 27,858 · +5.9%
- By 2100
- 26,212 · -0.4%
Race, ethnicity, and origin ACS 2023
- Neighborhood character
- Predominantly White (94%)
- Race & ethnicity
- White 94% Hispanic / Latino 2% Two or more races 2% Asian 1%
- Common ancestry
- Slovak 4% Iranian 4% Portuguese 3%
- Foreign-born
- 2% · Canada
- Languages at home
- 93% English-only · Spanish 4% French/Haitian/Cajun 1% Other Indo-European 1%
Political lean MEDSL · Tillamook
- 2024 margin
- Toss-up / Even · D 47.9% · R 49.2% · Other 2.9%
- 2008→2024 swing
- -11.2pp toward R · 2008: 9.9pp · 2024: -1.4pp
- All cycles
- 2024: R+1.4 2020: R+1.7 2016: R+5.9 2012: D+4.7 2008: D+9.9
Not yet ingested
- Civics
- —
Market trends
- HPI YoY
- ▼ -121.02%
- Current HPI
- 228.3227
- Rent YoY
- —
- Metro
- —
- State GDP YoY
- ▲ 2.05%
- F500 in state
- 2
Industry mix (Fortune 500 HQ in OR)
| Industry | F500 HQs | Revenue |
|---|---|---|
| Consumer Goods | 1 | $51B |
|
||
Price history
+298.7% since first listed28 events — show timeline
- 2026-03-26 Price Changed $299,000 RMLS
- 2026-01-02 Listed $319,000 RMLS
- 2025-08-20 Price Changed $349,000 OCMLS
- 2025-08-14 Listed $369,000 OCMLS
- 2025-07-14 Listed $369,000 OCMLS
- 2024-05-24 Sold (Public Records) $243,000 Public Records
- 2024-05-24 Sold (MLS) $243,000 RMLS
- 2024-05-24 Sold (MLS) $243,000 OCMLS
- 2024-05-24 Sold (MLS) $243,000 OCMLS
- 2024-05-09 Pending — RMLS
- 2024-05-09 Price Changed $269,900 OCMLS
- 2024-05-09 Pending — OCMLS
- 2024-04-24 Relisted — RMLS
- 2024-04-24 Relisted — OCMLS
- 2024-04-15 Pending — RMLS
- 2024-04-15 Pending — OCMLS
- 2024-04-11 Price Changed $269,900 RMLS
- 2024-04-11 Price Changed $269,900 OCMLS
- 2024-03-28 Price Changed $279,900 RMLS
- 2024-03-28 Price Changed $279,900 OCMLS
- 2024-03-14 Listed $289,900 RMLS
- 2024-03-14 Listed $289,900 OCMLS
- 2024-01-18 Listed $225,000 OCMLS
- 2018-03-13 Sold (MLS) $80,750 OCMLS
- 2018-03-13 Sold (MLS) $80,750 RMLS
- 2017-10-18 Listed $80,750 OCMLS
- 2017-10-18 Listed $80,750 RMLS
- 2000-07-14 Sold (Public Records) $75,000 Public Records
Property tax history
+4.7%/yrLatest (2025): $826 · +8.5% YoY. Source: county tax records.
Cash-flow waterfall
monthlySold comps — $/sqft
last 12 mo · ≤1 miLoading sold comps…