 🏢 Co-op
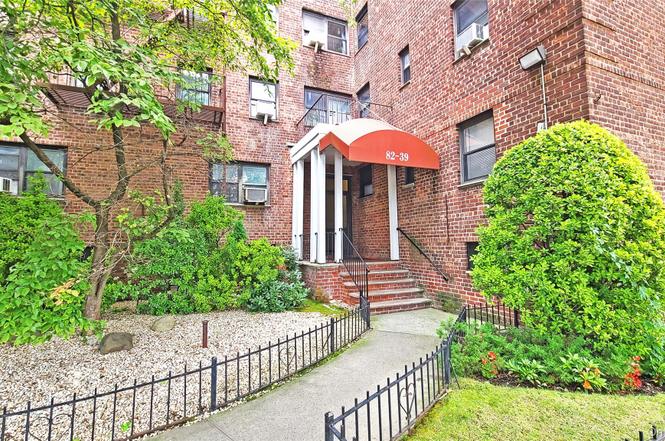
82-39 134th St Unit 1H · New York, NY
Flood risk 1/10 · Minimal
- FEMA flood zone
- X (unshaded)
- Chance of flooding over 30 yrs
- 0.0%
- Est. flood insurance / yr
- $507 – $1,088
Fire risk 1/10 · Minimal
- Est. fire insurance / yr
- $691 – $1,283
Heat risk 6/10 · Moderate
- Hot days now (above 99°F)
- 6 days/yr
- Hot days in 30 yrs
- 13 days/yr
Wind risk 6/10 · Moderate
- Chance of severe wind over 30 yrs
- 51.0%
Air-quality risk 4/10 · Minor
- Unhealthy air days now
- 6 days/yr
- Unhealthy air days in 30 yrs
- 6 days/yr
Risk factors via First Street. Map © Google.
Why this score? — see what drove the B grade
The composite is a weighted blend of 9 inputs, each scored 0–100. Each bar is that input's sub-score; the figure is the points it added to the 100-point composite (weight × sub-score).
- Cash flow +30.0/30.0
- 1% rule +10.0/10.0
- DSCR +10.0/10.0
- ARV discount +7.5/15.0
- Schools +5.0/10.0
- Livability +3.8/5.0
- Rent growth +3.0/5.0
- Condition / age +2.5/5.0
- Appreciation +0.0/10.0
$155,000
🖨 Deal sheet (PDF) 📄 Offer letter ✓ Due diligence
Listing remarks
This one-bedroom, one-bathroom unit presents an outstanding opportunity with remarkable renovation potential. An ideal entry point into cooperative ownership, allowing savvy buyers to customize and enhance the space according to their vision while capitalizing on the prime location. The spacious living room provides an excellent foundation for creative transformation. Enjoy peaceful quiet residential views and exceptional convenience with easy access to the F Train and Briarwood Subway Station and Queens Library nearby. Building conveniences include an elevator and on-site laundry room, adding practical value to daily living. This is a Fannie Mae HomePath property.
Key facts
- On-site laundry room
- Prime location
- Renovation potential
Tags
Neighborhood map
What this means for you Summary
Snapshot
- This is a 1-bed/1.0-bath condo listed at $155k.
Deal economics
- At list price, monthly cash flow is $874 ($10k/yr) — positive.
- The deal already cash-flows at list — no discount required.
- Meets the 1% rule at list price ($2k rent vs $155k).
- Cap rate 13.1% vs local median 2.6% in New York — top-decile yield for the area; either an underpriced asset or a hidden risk that comps aren't pricing in. Stress-test before assuming the spread holds.
Location & tenants
- Location reads 75/100 on livability (#268 in NY, #4,188 nationally) — a middle-class / working-renter tenant base. Strengths: amenities A+, commute A+, health & safety A; Watch: crime F, cost of living F.
- Market conditions: Rents rising (+2.0%/yr); 171 active listings in the ZIP; 40 comparable units currently listed for rent nearby; rentals at typical pace (median 26d on market — plan ~3-4 weeks tenant-placement turnaround); solid renter incomes; 5,302 units permitted in Queens County in 2024 (4,918 in 5+ unit buildings).
- This rent runs 37% of the median local income ($80k/yr) — at the standard rent-burdened threshold; future hikes will face affordability resistance.
Forward outlook
- Local home prices are declining (-3.0%/yr); year-one equity from $1k of loan paydown is wiped out by about $5k of value loss. Plan a longer hold.
- Queens County population projected at +16% by 2050 — long-run rental-demand tailwind backs the buy-and-hold thesis.
- At projected returns (-3.0% appreciation + 2.0% rent growth), your $43k cash investment doubles in ~6 years — after that, you're playing with house money.
Negotiation context
- Only 13 days on market — expect competitive offers; lowballing is unlikely to land.
- 5 sale attempts since 12y ago with the ask held roughly flat each time — persistent listings suggest the price (not the market) is what's stuck; bring a comps-based counter.
Risks & watch-outs
- Watch-outs: built in 1951 — expect roof / HVAC / electrical / plumbing capex.
- Climate carrying-cost: major wind risk, 51% chance of damaging wind over 30y; extreme-heat days projected 6→13/yr by 2055 (HVAC capex compounding) — expect insurance premiums to compound above CPI over the hold.
Questions for the listing agent
- Built in 1951 — when were the roof, HVAC, electrical panel, plumbing, and water heater last replaced?
- Any open or pending special assessments — roof, HVAC, plumbing, elevator, façade? What's the per-unit balance and payoff schedule, and is the seller paying it off at close or rolling it to the buyer?
- Is there a deadline driving the sale (1031 exchange, divorce, estate, relocation)? That informs how much negotiation room exists.
- Schools are B-rated — typically a magnet for longer-tenancy family renters. What's the average tenant stay here, and is there a school-zone premium baked into asking?
- Crime grade is F in this area — have there been break-ins, vandalism, or insurance claims at this property in the last 3 years? What carrier currently insures it and at what premium?
- What's the average days-on-market for RENTAL listings here right now (not sales)? A rising rental-DOM trend means longer vacancies and softer asking-rent achievability than the comps imply.
- What's the recent tenant-quality profile in this submarket — average credit score on applications, eviction rate, late-payment / NSF rate, and stable-employment percentage? A property-management company in the area should have these aggregated.
- How much new apartment / multifamily construction is in the pipeline within 1–3 miles? Heavy new supply (>2% of stock underway) typically softens rents 12–24 months out; light construction supports rent growth.
Investment metrics
- 1% rule
- 1.59% ✓
- Cap rate
- 13.06%
- Cash-on-cash
- 24.16%
- DSCR
- 2.07
- GRM
- 5.2
CMA / ARV
No comps found within radius.
Projected returns pro-forma
-3.0% appreciation · 1.97% rent growth · sell at horizon
- IRR
- 16.3%
- Equity multiple
- 1.65×
- Total profit
- $28,045
- Equity at exit
- $23,111
- IRR
- 24.1%
- Equity multiple
- 2.98×
- Total profit
- $86,080
- Equity at exit
- $13,402
Cash invested: $43,400 (down + closing). Projections, not guarantees.
Landlord ↔ Tenant lean methodology
- Overall (CITY)
- 0 Strongly Tenant-Friendly
- State New York
- 15 Strongly Tenant-Friendly · D+10
- County
- — inherits STATE
- City New York
- 0 Strongly Tenant-Friendly · D+34
ZIP-level market 11435
- Rents YoY
- 2.0%
- Active inventory
- 171
- Price-to-rent
- 5.2×
Monthly cashflow live
- Estimated rent
- $2,462 high interval (Pro) →
- Mortgage (P&I)
- −$813
- Tax est. 1.5%
- −$194 /mo · $2,325/yr
- Insurance
- −$65
- HOA
- −$0
- Vacancy / Maint / Mgmt
- −$517
- Net cashflow
- $874
Break-even live
Sensitivity live
| Price | -10% $981 | -5% $927 | +0% $874 | +5% $820 | +10% $767 |
|---|---|---|---|---|---|
| Rent | -10% $679 | -5% $777 | +0% $874 | +5% $971 | +10% $1,068 |
| Rate | -1.0pp $952 | -0.5pp $913 | base $874 | +0.5pp $834 | +1.0pp $793 |
UW: 25.0% down · 7.5% · 30yr · 1.5% tax · 5.0% vac · 8.0% maint · 8.0% mgmt
Financing live
Cash to close
- Down payment
- $38,750
- Closing costs
- $4,650
- Reserves months
- —
- Total cash needed
- —
Loan-product check · same deal, 3 products live
Conventional
25% down · 7.5% · 30yr
- Down + closing
- —
- Monthly P&I
- —
- Monthly cashflow
- —
- DSCR
- —
- Eligible?
- —
Personal DTI + credit; lowest rate.
DSCR
20% down · 8.5% · 30yr
- Down + closing
- —
- Monthly P&I
- —
- Monthly cashflow
- —
- DSCR
- —
- Eligible?
- —
No personal income docs; deal must DSCR.
Hard money
10% down · 12.0% · 12mo
- Down + closing
- —
- Monthly P&I
- —
- Monthly cashflow
- —
- DSCR
- —
- Eligible?
- —
Short-term bridge; refi at stabilization.
Rent comps 40 comps
| Address | Beds | Baths | Sqft | Rent | $/sqft | DOM | Units | Dist |
|---|---|---|---|---|---|---|---|---|
| 13915 83rd Ave #717 Jamaica, NY | 1.0 | 1.0 | 800 | $2,400 | $3.00 | 6d | 1 | 0.19mi |
| 123-40 83rd Ave Unit 2107 Jamaica, NY | 1.0 | 1.0 | 750 | $2,573 | $3.43 | 25d | 1 | 0.23mi |
| 123-40 83rd Ave Unit 8B Queens, NY | 1.0 | 1.0 | 800 | $2,450 | $3.06 | 25d | 1 | 0.23mi |
| 141-35 Pershing Cres Unit 1B Jamaica, NY | 1.0 | 1.5 | 1100 | $2,800 | $2.55 | 21d | 1 | 0.36mi |
| 14160 84th Rd Unit 2G Jamaica, NY | 1.0 | 1.0 | 700 | $2,200 | $3.14 | 15d | 1 | 0.36mi |
| 84-03 Lander St Unit 2B Jamaica, NY | 2.0 | 2.0 | 850 | $3,250 | $3.82 | 25d | 1 | 0.38mi |
| 14112 78th Rd Unit 1G Flushing, NY | 1.0 | 1.0 | 700 | $2,200 | $3.14 | 25d | 1 | 0.43mi |
| 138-28 Queens Blvd Unit 5G Briarwood, NY | 1.0 | 1.0 | 650 | $2,750 | $4.23 | 25d | 1 | 0.43mi |
| 13828 Queens Blvd Jamaica, NY | 1.0 | 1.0 | 640 | $2,700 | $4.22 | 20d | 1 | 0.43mi |
| 13828 Queens Blvd Unit 2E Briarwood, NY | 1.0 | 1.0 | 700 | $2,600 | $3.71 | 8d | 1 | 0.43mi |
| 13828 Queens Blvd Unit 7A Briarwood, NY | 2.0 | 1.0 | 810 | $3,600 | $4.44 | 25d | 1 | 0.43mi |
| 8340 Austin St Unit 7N Kew Gardens, NY | — | 1.0 | 550 | $2,000 | $3.64 | 25d | 1 | 0.45mi |
| 135-26 78th Ave Unit 2FL Flushing, NY | 2.0 | 1.0 | 900 | $2,800 | $3.11 | 3d | 1 | 0.46mi |
| 8455 Daniels St Unit 5H Jamaica, NY | 1.0 | 1.0 | 750 | $2,300 | $3.07 | 20d | 1 | 0.49mi |
| 7837 Main St Unit 2G Queens, NY | 1.0 | 1.0 | 700 | $2,300 | $3.29 | 25d | 1 | 0.54mi |
| 7835 147th St Unit 2E Flushing, NY | 1.0 | 1.0 | 700 | $2,200 | $3.14 | 7d | 1 | 0.60mi |
| 124-14 Metropolitan Ave Unit 2F Kew Gardens, NY | 2.0 | 1.0 | 850 | $2,900 | $3.41 | 25d | 1 | 0.62mi |
| 8321 Lefferts Blvd Kew Gardens, NY | — | 1.0 | 550 | $2,100 | $3.82 | 25d | 1 | 0.70mi |
| 13532 Kew Gardens Rd Richmond Hill, NY | 2.0 | 1.0 | 1070 | $2,500 | $2.34 | 25d | 1 | 0.70mi |
| 12401 Hillside Ave Richmond Hill, NY | 2.0 | 1.0 | 800 | $2,700 | $3.38 | 0d | 1 | 0.74mi |
| 123-16 Hillside Ave Unit 1st Fl Jamaica, NY | 2.0 | 1.0 | 869 | $2,700 | $3.11 | 25d | 1 | 0.78mi |
| 83-83 118th St Unit 2E Kew Gardens, NY | 2.0 | 1.5 | 1000 | $3,200 | $3.20 | 15d | 1 | 0.78mi |
| 8383 118th St Kew Gardens, NY | 1.0–2.0 | 1.0–1.5 | 900 | $2,600 | $2.89 | 25d | 2 | 0.78mi |
| 7540 Austin St Unit 4HR Forest Hills, NY | 1.0 | 1.0 | 841 | $2,600 | $3.09 | 0d | 1 | 0.78mi |
| 11624 Grosvenor Ln Unit 11D Richmond Hill, NY | 2.0 | 2.0 | 950 | $3,200 | $3.37 | 25d | 1 | 0.79mi |
| 83-60 118th St Unit 4F Kew Gardens, NY | 2.0 | 1.0 | 800 | $2,500 | $3.12 | 25d | 1 | 0.80mi |
| 122-08 Hillside Ave Unit 2 Jamaica, NY | 2.0 | 1.0 | 700 | $2,500 | $3.57 | 25d | 1 | 0.81mi |
| 8380 118th St Unit 2P Kew Gardens, NY | — | 1.0 | 550 | $1,900 | $3.45 | 14d | 1 | 0.82mi |
| 148-16 87th Ave Unit 2 Jamaica, NY | 2.0 | 1.0 | 700 | $2,300 | $3.29 | 18d | 1 | 0.83mi |
| 8375 117th St Richmond Hill, NY | 1.0 | 1.0 | 650 | $2,695 | $4.15 | 25d | 1 | 0.85mi |
| 8375 117th St Unit 5E Richmond Hill, NY | 1.0 | 1.0 | 650 | $2,650 | $4.08 | 13d | 1 | 0.85mi |
| 14832 87th Ave Jamaica, NY | 2.0 | 1.0 | 768 | $2,800 | $3.65 | 20d | 1 | 0.85mi |
| 8371 116th St Unit 7C Richmond Hill, NY | 1.0 | 1.0 | 800 | $2,600 | $3.25 | 0d | 1 | 0.88mi |
| 8371 116th St Jamaica, NY | 1.0 | 1.0 | 688 | $2,725 | $3.96 | 6d | 2 | 0.89mi |
| 12015 Jamaica Ave Unit 2 Jamaica, NY | 2.0 | 1.0 | 700 | $2,200 | $3.14 | 25d | 1 | 0.93mi |
| 11007 73rd Rd Forest Hills, NY | 1.0 | 1.0 | 950 | $1,800 | $1.89 | 20d | 1 | 0.95mi |
| 148-37 88th Ave Queens, NY | 2.0 | 2.0 | 900 | $3,500 | $3.89 | 25d | 1 | 0.99mi |
| 11019 72nd Rd Unit 1B Forest Hills, NY | 1.0 | 1.0 | 750 | $3,200 | $4.27 | 15d | 1 | 1.04mi |
| 14836 89th Ave Unit 3C Jamaica, NY | 1.0 | 1.0 | 673 | $2,900 | $4.31 | 25d | 1 | 1.07mi |
| 10919 72nd Rd Unit 6F Forest Hills, NY | 1.0 | 1.0 | 696 | $3,485 | $5.01 | 12d | 1 | 1.07mi |
HOA detail condo
- Monthly dues
- $0 · $0/yr
- Assessments
- None detected in remarks — confirm with the listing agent.
Listing history 12 events
-
2026-03-12status Pending
-
2026-02-27$155,000 Active
-
2024-11-06status Pending
-
2024-10-25historical
-
2024-10-08price $144,900
-
2024-08-23$159,900 Active
-
2016-01-30historical
-
2015-10-02$155,672
-
2015-09-30historical
-
2014-11-04historical
-
2014-10-27$154,000
-
2014-09-20$165,000
ⓘ Source: listings_history table (triggers on properties + properties_extension) + one-shot
backfill from property_details.listing_events for pre-trigger history.
Climate risk First Street
- Flood 1/10 Low FEMA zone X (unshaded) · 0% chance over 30 yrs
- Wildfire 1/10 Low
- Heat 6/10 Major 6 d/yr ≥99°F today · 13 d/yr by 30 yrs out
- Wind 6/10 Major 51% chance of damaging wind over 30 yrs
- Air quality 4/10 Moderate 6 unhealthy d/yr today · 6 by 30 yrs out
Nearby sold comps map
Loading sold comps map…
Walkable amenities ~0.75 mi
Loading nearby amenities…
Taxation est. · year 1
- Rental income
- $29,543
- − Mortgage interest
- −$8,682
- − Property taxes
- −$2,325
- − Insurance
- −$775
- − Repairs & maintenance
- −$2,363
- − Management
- −$2,363
- − Depreciation
- −$4,509
- Taxable income
- $8,525
- Est. tax owed @ 24.0%
- −$2,046
- After-tax cash flow
- $8,439/yr
For passive investors: Depreciation is non-cash, so a rental often shows a tax loss while cash-flowing — sheltering income. Rental losses are passive: they offset passive income freely, and up to $25,000/yr can offset ordinary (W-2) income if you actively participate and your MAGI is under $100k (phasing out to $0 by $150k); unused losses carry forward. On sale, claimed depreciation is recaptured at up to 25%, and gains may owe capital-gains tax (a 1031 exchange can defer both). Figures are a year-1 estimate at your 24.0% rate — not tax advice; consult a CPA.
Schools (NCES district)
No district data.
Livability — New York
- Score
- 75/100
- State rank
- #268
- US rank
- #4188
Category grades
Schools grade is shown separately in the Schools card above.
Census & demographics
- Census place
- New York, NY
- County
- Queens County · 1,914,869 people
- City population
- 7,731,280
- Metro
- New York-Newark-Jersey City, NY-NJ-PA
- Population (ZIP)
- 56,826
- Household income
- $79,710
- Rent vs Own
- Severe rent burden
- 3361.0
Population outlook (Queens County) Hauer SSP2
- Today (2025)
- 2,546,320 people
- By 2030
- 2,643,059 · +3.8%
- By 2040
- 2,815,563 · +10.6%
- By 2050
- 2,944,423 · +15.6%
- By 2075
- 3,123,338 · +22.7%
- By 2100
- 3,098,688 · +21.7%
Race, ethnicity, and origin ACS 2023
- Neighborhood character
- Highly diverse neighborhood (Simpson 0.78)
- Race & ethnicity
- Hispanic / Latino 30% Black 25% Asian 23% White 13% Two or more races 7%
- Hispanic origin (detail)
- Mexican 3% Puerto Rican 4% Dominican 5%
- Common ancestry
- Scotch-Irish 2% Hispanic 1% Russian 1%
- Foreign-born
- 53% · Canada, China, Jamaica
- Languages at home
- 42% English-only · Spanish 29% Other Indo-European 14% Russian/Polish/Slavic 4%
Political lean MEDSL · Queens
- 2024 margin
- Strong D (+24.6) · D 62.3% · R 37.7%
- 2008→2024 swing
- -26.2pp toward R · 2008: 50.8pp · 2024: 24.6pp
- All cycles
- 2024: D+24.6 2020: D+45.2 2016: D+53.4 2012: D+58.5 2008: D+50.8
Not yet ingested
- Civics
- —
Market trends
- HPI YoY
- ▼ -399.00%
- Current HPI
- 206.3955
- Rent YoY
- ▲ 1.97%
- Metro
- New York-Newark-Jersey City, NY-NJ-PA
- State GDP YoY
- ▲ 2.60%
- F500 in state
- 92
Industry mix (Fortune 500 HQ in NY)
| Industry | F500 HQs | Revenue |
|---|---|---|
| Financial Services | 10 | $950B |
|
||
| Consumer Goods | 9 | $162B |
|
||
| Insurance | 4 | $225B |
|
||
| Telecommunications | 2 | $144B |
|
||
| Pharmaceuticals | 2 | $112B |
|
||
| Media / Entertainment | 2 | $69B |
|
||
Price history
-6.1% since first listed12 events — show timeline
- 2026-03-12 Pending — OneKey® MLS as Distributed by MLS Grid
- 2026-02-27 Listed $155,000 OneKey® MLS as Distributed by MLS Grid
- 2024-11-06 Pending — OneKey® MLS as Distributed by MLS Grid
- 2024-10-25 Listing Removed — OneKey® MLS as Distributed by MLS Grid
- 2024-10-08 Price Changed $144,900 OneKey® MLS as Distributed by MLS Grid
- 2024-08-23 Listed $159,900 OneKey® MLS as Distributed by MLS Grid
- 2016-01-30 Listing Removed — OneKey® MLS as Distributed by MLS Grid
- 2015-10-02 Listed $155,672 OneKey® MLS as Distributed by MLS Grid
- 2015-09-30 Listing Removed — OneKey® MLS as Distributed by MLS Grid
- 2014-11-04 Listing Removed — OneKey® MLS as Distributed by MLS Grid
- 2014-10-27 Listed $154,000 OneKey® MLS as Distributed by MLS Grid
- 2014-09-20 Listed $165,000 OneKey® MLS as Distributed by MLS Grid
Cash-flow waterfall
monthlySold comps — $/sqft
last 12 mo · ≤1 miLoading sold comps…