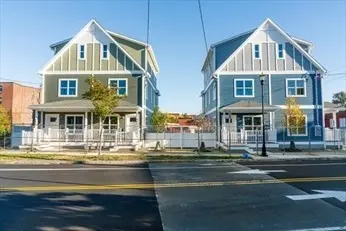
680 South East St · Holyoke, MA
Flood risk No data
- FEMA flood zone
- —
- Chance of flooding over 30 yrs
- —
- Est. flood insurance / yr
- —
Fire risk No data
- Est. fire insurance / yr
- —
Heat risk No data
- Hot days now (above threshold)
- —
- Hot days in 30 yrs
- —
Wind risk No data
- Chance of severe wind over 30 yrs
- —
Air-quality risk No data
- Unhealthy air days now
- —
- Unhealthy air days in 30 yrs
- —
Risk factors via First Street. Map © Google.
Why this score? — see what drove the C- grade
The composite is a weighted blend of 9 inputs, each scored 0–100. Each bar is that input's sub-score; the figure is the points it added to the 100-point composite (weight × sub-score).
- Cash flow +17.2/30.0
- ARV discount +15.0/15.0
- DSCR +5.4/10.0
- 1% rule +4.6/10.0
- Condition / age +4.0/5.0
- Livability +3.1/5.0
- Rent growth +2.5/5.0
- Schools +0.8/10.0
- Appreciation +0.0/10.0
$225,000
🖨 Deal sheet 📄 Offer letter ✓ Due diligence
Listing remarks
South Holyoke Homes is the culmination of decades of community advocacy to build housing on vacant municipal lots around Carlos Vega Park, in the South Holyoke neighborhood of Holyoke, Massachusetts. Available units include 3- and 4-bedroom options. The three story units have a kitchen and living room on the first floor with a half bath. The bedrooms are on the 2nd and 3rd floor, excluding the accessible unit. Each unit features at least 2 bathrooms and spans an area ranging from 1,684 to 1,867 square feet. The all-electric units include high efficiency electric heat pumps, which provides heating and cooling at a lower-cost solution while emitting a lower carbon footprint on the environment
Key facts
- Accessible unit
- 2,890 sq ft lot
- 2 parking spots
Tags
Property features AI
Finance
- HOA & community: Not a senior community; Community has public transportation, park access, laundromat, bike path, highway access, house of worship, and nearby T-station
Exterior
- Parking: Off-street paved parking; Two open parking spaces (total 2)
- Utilities: Public water; Public sewer
- Home design: Single family residence (attached); Front-to-back split layout; Blue exterior
- Construction: Shingle roof; Concrete perimeter foundation; Year built (actual) — source: owner
- Exterior features: Porch; Patio
Interior
- Kitchen: Electric water heater
- Bedrooms: Master bedroom on the second floor; Second bedroom on the second floor; Third bedroom on the third floor
- Bathrooms: One full bathroom (second floor); One half bathroom (first floor)
- Heating & cooling: Ductless heating; Ductless cooling
- Interior features: Bonus room; Partial basement with crawl space; Six total rooms
- Laundry & utility: Laundry located on the second floor
Neighborhood map
What this means for you Summary
Snapshot
- This is a 3-bed/1.5-bath single-family listed at $225k. Condition is rated good.
Deal economics
- At list price, monthly cash flow is $159 ($2k/yr) — positive.
- The deal already cash-flows at list — no discount required.
- To meet the 1% rule (rent ≥ 1% of price), the offer needs to be $217k (3.6% below list).
- Recommended offer: $217k (3.6% below list) — sets the bar for 1% rule.
- Cap rate 7.1% vs local median 5.3% in Holyoke — top-decile yield for the area; either an underpriced asset or a hidden risk that comps aren't pricing in. Stress-test before assuming the spread holds.
Location & tenants
- Location reads 62/100 on livability (#203 in MA) — a middle-class / working-renter tenant base. Strengths: commute A+, health & safety A+, housing B; Watch: schools F, crime F, amenities F.
- Holyoke (suburban): math 5% / reading 14% proficiency, ranked #302 of 302 in MA (top 100%) — low school quality limits family demand, transient renter base, plan for 1-2y turnover; 82% free/reduced lunch — lower-income household profile, screen leases tightly.
- Market conditions: 43 active listings in the ZIP; 10 comparable units currently listed for rent nearby; rentals at typical pace (median 21d on market — plan ~3-4 weeks tenant-placement turnaround); 453 units permitted in Hampden County in 2024 (116 in 5+ unit buildings).
- At $2,170/mo this rent would consume 49% of the median local household income ($54k/yr) (locally 2404% of renters already pay >50% of income on rent) — very limited rent-growth headroom before tenants either downsize or default.
Forward outlook
- Local home prices are declining (-3.0%/yr); year-one equity from $2k of loan paydown is wiped out by about $7k of value loss. Plan a longer hold.
- Hampden County population projected at +5% by 2050 — modest demand growth; plan on rents tracking national, not racing it.
Negotiation context
- It's been on market 36 days — a 3% lower offer ($218k) is reasonable based on typical stale-listing flexibility.
Questions for the listing agent
- It's been on market 36 days. Have you received any prior offers? Is the seller open to a 4% concession, seller financing, or rate buy-down credit?
- Is there a deadline driving the sale (1031 exchange, divorce, estate, relocation)? That informs how much negotiation room exists.
- Schools are F-rated, which usually means shorter tenancies and higher turnover. Who's the typical renter profile here, and what's been the actual vacancy rate?
- Crime grade is F in this area — have there been break-ins, vandalism, or insurance claims at this property in the last 3 years? What carrier currently insures it and at what premium?
- What's the average days-on-market for RENTAL listings here right now (not sales)? A rising rental-DOM trend means longer vacancies and softer asking-rent achievability than the comps imply.
- What's the recent tenant-quality profile in this submarket — average credit score on applications, eviction rate, late-payment / NSF rate, and stable-employment percentage? A property-management company in the area should have these aggregated.
- How much new for-sale + rental construction is in the pipeline within 1–3 miles? Heavy new supply typically softens prices + rents 12–24 months out; constrained supply supports both.
Investment metrics
- 1% rule
- 0.96% ✗
- Cap rate
- 7.14%
- Cash-on-cash
- 3.04%
- DSCR
- 1.14
- GRM
- 8.6
CMA / ARV
- ARV (median comp)
- $288,994
- List price
- $225,000
- Delta
- -22.14%
- Verdict
- UNDERPRICED
- Comps
- 20 within 1.0 mi
Show comp detail 3 sales within ~0.75 mi
| Address | Dist | Beds/Ba | Sqft | Sold | Price | $/sf | Match |
|---|---|---|---|---|---|---|---|
| 88 Newell St | 0.75mi | 3/2.0 | 1,644 (-12%) | 2mo | $375,000 | $228 | 41 |
| 325 Elm St | 0.56mi | 4/2.5 (+1) | 1,680 (-10%) | 11mo | $315,000 | $188 | 39 |
| 322 Elm St | 0.54mi | 4/2.5 (+1) | 1,680 (-10%) | 19mo | $280,000 | $167 | 34 |
Match score weights: distance 35% · size 25% · config 20% · recency 20%. Top-matched comps best support the ARV.
Projected returns pro-forma
-3.0% appreciation · 3.0% rent growth · sell at horizon
- IRR
- -11.5%
- Equity multiple
- 0.58×
- Total profit
- $-26,271
- Equity at exit
- $33,548
- IRR
- -2.3%
- Equity multiple
- 0.85×
- Total profit
- $-9,666
- Equity at exit
- $19,454
Cash invested: $63,000 (down + closing). Projections, not guarantees.
Landlord ↔ Tenant lean methodology
- Overall (STATE)
- 20 Strongly Tenant-Friendly
- State Massachusetts
- 20 Strongly Tenant-Friendly · D+15
- County
- — inherits STATE
- City
- — inherits STATE
ZIP-level market 01040
- Home prices YoY
- -33.2%
- Active inventory
- 43
- Price-to-rent
- 8.6×
Monthly cashflow live
- Estimated rent
- $2,170 high interval (Pro) →
- Mortgage (P&I)
- −$1,180
- Tax est. 1.5%
- −$281 /mo · $3,375/yr
- Insurance
- −$94
- HOA
- −$0
- Vacancy / Maint / Mgmt
- −$456
- Net cashflow
- $159
Break-even live
UW: 25.0% down · 7.5% · 30yr · 1.5% tax · 5.0% vac · 8.0% maint · 8.0% mgmt
Financing live
Cash to close
- Down payment
- $56,250
- Closing costs
- $6,750
- Reserves months
- —
- Total cash needed
- —
Loan-product check · same deal, 3 products live
Conventional
25% down · 7.5% · 30yr
- Down + closing
- —
- Monthly P&I
- —
- Monthly cashflow
- —
- DSCR
- —
- Eligible?
- —
Personal DTI + credit; lowest rate.
DSCR
20% down · 8.5% · 30yr
- Down + closing
- —
- Monthly P&I
- —
- Monthly cashflow
- —
- DSCR
- —
- Eligible?
- —
No personal income docs; deal must DSCR.
Hard money
10% down · 12.0% · 12mo
- Down + closing
- —
- Monthly P&I
- —
- Monthly cashflow
- —
- DSCR
- —
- Eligible?
- —
Short-term bridge; refi at stabilization.
Rent comps 10 comps
| Address | Beds | Baths | Sqft | Rent | $/sqft | DOM | Units | Dist |
|---|---|---|---|---|---|---|---|---|
| 11 Worcester Pl Unit 2 Holyoke, MA | 3.0 | 1.0 | 1500 | $1,850 | $1.23 | 21d | 1 | 0.36mi |
| 828 Chicopee St Chicopee, MA | 3.0 | 1.0 | 1250 | $1,795 | $1.44 | 21d | 1 | 0.61mi |
| 297 Beech St Unit 3 Holyoke, MA | 4.0 | 1.0 | 1600 | $2,500 | $1.56 | 44d | 1 | 0.71mi |
| 664 Chicopee St Unit 2 Chicopee, MA | 3.0 | 1.0 | 1458 | $2,000 | $1.37 | 13d | 1 | 0.80mi |
| 664 Chicopee St Chicopee, MA | 3.0 | 1.0 | 1458 | $3,400 | $2.33 | 44d | 1 | 0.80mi |
| 30 Bemis St Unit 3 Chicopee, MA | 2.0 | 1.0 | 1250 | $1,600 | $1.28 | 13d | 1 | 0.85mi |
| 12 Saint James Ave Holyoke, MA | 3.0 | 1.0 | 1295 | $2,100 | $1.62 | 14d | 1 | 1.19mi |
| 1761-1763 Northampton St Unit 3 Holyoke, MA | 2.0 | 1.0 | 1500 | $1,800 | $1.20 | 14d | 1 | 1.23mi |
| 3B Canal St Unit 3B South Hadley, MA | 2.0 | 2.5 | 1416 | $2,750 | $1.94 | 13d | 1 | 1.35mi |
| 109 Ridgewood Ave Holyoke, MA | 3.0 | 1.5 | 1584 | $2,499 | $1.58 | 44d | 1 | 1.49mi |
Listing history 15 events
-
2026-06-18days on market $225,000 Active 36 DOM
-
2026-06-17days on market $225,000 Active 35 DOM
-
2026-06-16days on market $225,000 Active 34 DOM
-
2026-06-15days on market $225,000 Active 33 DOM
-
2026-06-14days on market $225,000 Active 31 DOM
-
2026-06-10days on market $225,000 Active 28 DOM
-
2026-06-09days on market $225,000 Active 27 DOM
-
2026-06-08days on market $225,000 Active 26 DOM
-
2026-06-07days on market $225,000 Active 25 DOM
-
2026-06-03days on market $225,000 Active 21 DOM
-
2026-06-02days on market $225,000 Active 20 DOM
-
2026-06-01days on market $225,000 Active 19 DOM
-
2026-05-31days on market $225,000 Active 18 DOM
-
2026-05-30days on market $225,000 Active 17 DOM
-
2026-05-13$225,000 New 899-char remark
ⓘ Source: listings_history table (triggers on properties + properties_extension) + one-shot
backfill from property_details.listing_events for pre-trigger history.
Nearby sold comps map
Loading sold comps map…
Walkable amenities ~0.75 mi
Loading nearby amenities…
Taxation est. · year 1
- Rental income
- $26,041
- − Mortgage interest
- −$12,603
- − Property taxes
- −$3,375
- − Insurance
- −$1,125
- − Repairs & maintenance
- −$2,083
- − Management
- −$2,083
- − Depreciation
- −$6,545
- Taxable loss
- −$1,774
- Est. tax savings @ 24.0%
- +$426
- After-tax cash flow
- $2,339/yr
For passive investors: Depreciation is non-cash, so a rental often shows a tax loss while cash-flowing — sheltering income. Rental losses are passive: they offset passive income freely, and up to $25,000/yr can offset ordinary (W-2) income if you actively participate and your MAGI is under $100k (phasing out to $0 by $150k); unused losses carry forward. On sale, claimed depreciation is recaptured at up to 25%, and gains may owe capital-gains tax (a 1031 exchange can defer both). Figures are a year-1 estimate at your 24.0% rate — not tax advice; consult a CPA.
Condition & rehab AI · 5 photos
This single-family home in South Holyoke, MA, is in good condition with a modern kitchen and well-maintained exterior. It offers a good investment opportunity with potential for minor cosmetic upgrades to enhance its curb appeal and interior aesthetics.
Value-add opportunities
- Both Painting the exterior and interior walls — Fresh paint can enhance curb appeal and interior aesthetics.
- Both Landscaping improvements — Enhanced landscaping can improve curb appeal and attract potential buyers/tenants.
- Both Adding smart home features — Smart home features can increase convenience and appeal to tech-savvy buyers/tenants.
- Both Upgrading the kitchen appliances — Modernizing the kitchen can make the space more functional and appealing to potential buyers/tenants.
Renovation cost estimate screening
Value-add ROI direction
- Both Painting the exterior and interior walls — Fresh paint can enhance curb appeal and interior aesthetics. ↑
- Both Landscaping improvements — Enhanced landscaping can improve curb appeal and attract potential buyers/tenants. ↑
- Both Adding smart home features — Smart home features can increase convenience and appeal to tech-savvy buyers/tenants. ↑
- Both Upgrading the kitchen appliances — Modernizing the kitchen can make the space more functional and appealing to potential buyers/tenants. ↑
ⓘ Cost ranges are severity-bucket heuristics (US national rule-of-thumb). Get contractor quotes + a written scope before underwriting a rehab budget.
Schools (NCES district)
- District
- Holyoke
- NCES district ID
- 2506270
- Math proficiency
- 5% ▼ -7.00%
- Reading proficiency
- 14% ▼ -5.00%
- Median HH income
- $35,495
- Composite
- 7.79/100
- National rank
- #9934
- State rank
- #302 of 302 in MA
Livability — Holyoke
- Score
- 62/100
- State rank
- #203
- US rank
- #16308
Category grades
Schools grade is shown separately in the Schools card above.
Census & demographics
- Census place
- Holyoke, MA
- County
- Hampden County · 230,965 people
- City population
- 37,813
- Metro
- Springfield, MA
- Population (ZIP)
- 37,813
- Household income
- $53,605
- Rent vs Own
- Severe rent burden
- 2404.0
Population outlook (Hampden County) Hauer SSP2
- Today (2025)
- 485,646 people
- By 2030
- 491,517 · +1.2%
- By 2040
- 500,539 · +3.1%
- By 2050
- 508,827 · +4.8%
- By 2075
- 539,167 · +11.0%
- By 2100
- 545,698 · +12.4%
Race, ethnicity, and origin ACS 2023
- Neighborhood character
- Majority Hispanic (52%)
- Race & ethnicity
- Hispanic / Latino 52% White 43% Two or more races 23% Black 2%
- Hispanic origin (detail)
- Puerto Rican 45% Dominican 2%
- Common ancestry
- Lithuanian 5% Romanian 4% Slovak 1%
- Foreign-born
- 6% · Canada, Jamaica
- Languages at home
- 58% English-only · Spanish 39% Russian/Polish/Slavic 1% French/Haitian/Cajun 1%
Political lean MEDSL · Hampden
- 2024 margin
- Lean D (+8.9) · D 53.4% · R 44.5% · Other 2.1%
- 2008→2024 swing
- -16.4pp toward R · 2008: 25.3pp · 2024: 8.9pp
- All cycles
- 2024: D+8.9 2020: D+17.7 2016: D+16.0 2012: D+25.4 2008: D+25.3
Not yet ingested
- Civics
- —
Market trends
- HPI YoY
- ▼ -146.03%
- Current HPI
- 293.93
- Rent YoY
- —
- Metro
- Springfield, MA
- State GDP YoY
- ▲ 2.28%
- F500 in state
- 38
Industry mix (Fortune 500 HQ in MA)
| Industry | F500 HQs | Revenue |
|---|---|---|
| Technology | 3 | $17B |
|
||
| Insurance | 2 | $84B |
|
||
| Retail | 2 | $76B |
|
||
| Life Sciences | 1 | $43B |
|
||
| Energy Technology | 1 | $31B |
|
||
| Aerospace / Defense | 1 | $18B |
|
||
Price history
1 event — show timeline
- 2026-05-13 Listed $225,000 MLS PIN
Cash-flow waterfall
monthlySold comps — $/sqft
last 12 mo · ≤1 miLoading sold comps…