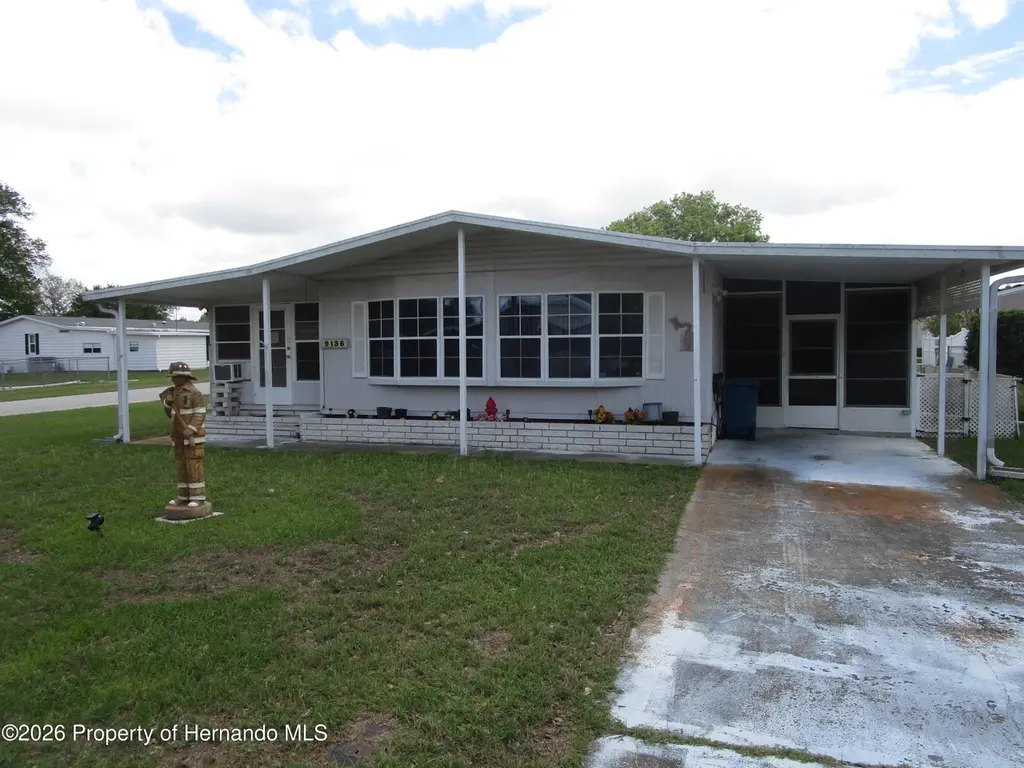
9156 Admiral St Unit 4 · Brookridge, FL
Flood risk 1/10 · Minimal
- FEMA flood zone
- X (unshaded)
- Chance of flooding over 30 yrs
- 0.0%
- Est. flood insurance / yr
- $507 – $1,088
Fire risk 3/10 · Minor
- Est. fire insurance / yr
- $947 – $1,759
Heat risk 10/10 · Severe
- Hot days now (above 109°F)
- 7 days/yr
- Hot days in 30 yrs
- 28 days/yr
Wind risk 9/10 · Severe
- Chance of severe wind over 30 yrs
- 99.0%
Air-quality risk 2/10 · Minimal
- Unhealthy air days now
- 1 days/yr
- Unhealthy air days in 30 yrs
- 1 days/yr
Risk factors via First Street. Map © Google.
Why this score? — see what drove the C+ grade
The composite is a weighted blend of 9 inputs, each scored 0–100. Each bar is that input's sub-score; the figure is the points it added to the 100-point composite (weight × sub-score).
- Cash flow +25.4/30.0
- ARV discount +9.6/15.0
- DSCR +8.4/10.0
- 1% rule +7.2/10.0
- Schools +4.2/10.0
- Livability +3.5/5.0
- Condition / age +2.8/5.0
- Rent growth +2.5/5.0
- Appreciation +0.0/10.0
$140,000
🖨 Deal sheet 📄 Offer letter ✓ Due diligence
Listing remarks
1981 2 bedroom two full bath. This home has a screened porch on both sides of the home a large shed with lots of storage. In the back of the house is a one garage with a work shop. Nice corner lot with over 7300 square feet. Nice location in the Brookridge community where you own your land, a great golf course.
Key facts
- Screened porch
- Large shed
- Work shop
Tags
Property features AI
Finance
- Other: Zoning: R1-MH (Residential single-family housing)
- Financial info: Annual tax amount available (not listed here)
- HOA & community: Homeowners association with monthly fee of $55; Association amenities include fitness center, gated entry, playground, RV/boat storage, sauna, shuffleboard court, tennis courts, and security; Street lights; Senior community
Exterior
- Parking: Covered parking; Garage (1 space); Carport (1 space)
- Security: Gated community with guard; Smoke detectors; Community security included in association
- Utilities: Public water; Public sewer; 150 Amp electric service; Cable available; Electricity connected; Sewer connected
- Home design: Mobile home (double wide); One story; Attached property; Residential single-family use; Metal roof; Vinyl siding
- Construction: Vinyl siding construction; Metal roof
- Exterior features: Screened side porch; Shed(s); Workshop; Corner lot; Asphalt private road; road is privately maintained
Interior
- Kitchen: Electric oven; Refrigerator
- Bedrooms: Accessible bedroom
- Flooring: Laminate
- Bathrooms: 2 full bathrooms
- Heating & cooling: Central heating; Electric heating; Heat pump; Central air; Ceiling fan(s) for cooling
- Interior features: Ceiling fans; Pantry; Walk-in closets; Skylight(s)
- Laundry & utility: Washer; Dryer; Laundry located in carport and garage; Accessible washer/dryer
Neighborhood map
What this means for you Summary
Snapshot
- This is a 2-bed/2.0-bath manufactured listed at $140k. Condition is rated average.
Deal economics
- At list price, monthly cash flow is $321 ($4k/yr) — positive.
- The deal already cash-flows at list — no discount required.
- Meets the 1% rule at list price ($2k rent vs $140k).
- Recommended offer: $136k (3.0% below list) — sets the bar for market timing.
- Cap rate 9.0% vs local median 6.3% in Brookridge — top-decile yield for the area; either an underpriced asset or a hidden risk that comps aren't pricing in. Stress-test before assuming the spread holds.
Location & tenants
- Location reads 70/100 on livability (#421 in FL) — a middle-class / working-renter tenant base. Strengths: cost of living A+, housing A+, crime B+; Watch: employment C-, health & safety C-, amenities F.
- Hernando (suburban): math 50% / reading 50% proficiency, ranked #38 of 73 in FL (top 52%) — acceptable for families but not a draw, mixed tenant base, ~2y average lease.
- Zoned schools: Pine Grove Elementary School (math 60% / reading 45%, grade C-, #976 of 2,144 statewide, top 46%, 991 students, 60% FRL); West Hernando Middle School (math 36% / reading 37%, grade F, #405 of 571 statewide, top 72%, 695 students, 58% FRL); Central High School (math 34% / reading 44%, grade F, #312 of 667 statewide, top 48%, 1,426 students, 53% FRL) — zoned schools at 57% FRL track the district average.
- Market conditions: 691 active listings in the ZIP; 7 comparable units currently listed for rent nearby; rentals at typical pace (median 22d on market — plan ~3-4 weeks tenant-placement turnaround); 2,505 units permitted in Hernando County in 2024 (318 in 5+ unit buildings).
- This rent runs 35% of the median local income ($59k/yr) — at the standard rent-burdened threshold; future hikes will face affordability resistance.
Forward outlook
- Local home prices are declining (-3.0%/yr); year-one equity from $968 of loan paydown is wiped out by about $4k of value loss. Plan a longer hold.
- Hernando County population projected at +11% by 2050 — modest demand growth; plan on rents tracking national, not racing it.
Negotiation context
- It's been on market 32 days — a 3% lower offer ($136k) is reasonable based on typical stale-listing flexibility.
Risks & watch-outs
- Climate carrying-cost: severe wind risk, 99% chance of damaging wind over 30y; extreme-heat days projected 7→28/yr by 2055 (HVAC capex compounding) — expect insurance premiums to compound above CPI over the hold.
Questions for the listing agent
- It's been on market 32 days. Have you received any prior offers? Is the seller open to a 3% concession, seller financing, or rate buy-down credit?
- What does the HOA fee cover, when was the last increase, and are there any pending special assessments or reserve-fund shortfalls?
- Is there a deadline driving the sale (1031 exchange, divorce, estate, relocation)? That informs how much negotiation room exists.
- Schools are F-rated, which usually means shorter tenancies and higher turnover. Who's the typical renter profile here, and what's been the actual vacancy rate?
- What's the average days-on-market for RENTAL listings here right now (not sales)? A rising rental-DOM trend means longer vacancies and softer asking-rent achievability than the comps imply.
- What's the recent tenant-quality profile in this submarket — average credit score on applications, eviction rate, late-payment / NSF rate, and stable-employment percentage? A property-management company in the area should have these aggregated.
- How much new for-sale + rental construction is in the pipeline within 1–3 miles? Heavy new supply typically softens prices + rents 12–24 months out; constrained supply supports both.
Investment metrics
- 1% rule
- 1.22% ✓
- Cap rate
- 9.05%
- Cash-on-cash
- 9.84%
- DSCR
- 1.44
- GRM
- 6.9
CMA / ARV
- ARV (on-the-fly)
- $146,832
- Comps found
- 12
Show comp detail 12 sales within ~0.75 mi
| Address | Dist | Beds/Ba | Sqft | Sold | Price | $/sf | Match |
|---|---|---|---|---|---|---|---|
| 16247 Brookridge Blvd | 0.13mi | 2/2.0 | 1,104 (0%) | 3mo | $150,000 | $136 | 92 |
| 8223 Fortune Hunter Dr | 0.13mi | 2/2.0 | 1,176 (+6%) | 1mo | $100,000 | $85 | 82 |
| 9121 Scepter Ave | 0.10mi | 2/2.0 | 1,196 (+8%) | 9mo | $159,000 | $133 | 74 |
| 14883 Rialto Ave | 0.66mi | 2/2.0 | 1,144 (+4%) | 0mo | $148,000 | $129 | 63 |
| 14986 Rialto Ave | 0.53mi | 2/2.0 | 1,188 (+8%) | 2mo | $185,000 | $156 | 61 |
| 14517 Rialto Ave | 0.42mi | 2/2.0 | 1,226 (+11%) | 3mo | $152,500 | $124 | 60 |
| 15031 Rialto Ave | 0.51mi | 2/2.0 | 1,032 (-6%) | 7mo | $80,000 | $78 | 59 |
| 14911 Rialto Ave | 0.61mi | 3/2.0 (+1) | 1,039 (-6%) | 6mo | $130,000 | $125 | 52 |
| 14391 Diablo Dr | 0.71mi | 2/2.0 | 1,056 (-4%) | 11mo | $162,000 | $153 | 51 |
| 14233 Rialto Ave | 0.69mi | 2/2.0 | 960 (-13%) | 4mo | $125,000 | $130 | 43 |
| 8536 Central Ave | 0.59mi | 2/2.0 | 1,242 (+12%) | 11mo | $215,000 | $173 | 42 |
| 8408 Fleetway Ave | 0.67mi | 2/2.0 | 972 (-12%) | 8mo | $128,850 | $133 | 42 |
Match score weights: distance 35% · size 25% · config 20% · recency 20%. Top-matched comps best support the ARV.
Projected returns pro-forma
-3.0% appreciation · 3.0% rent growth · sell at horizon
- IRR
- -1.5%
- Equity multiple
- 0.95×
- Total profit
- $-2,152
- Equity at exit
- $20,874
- IRR
- 8.3%
- Equity multiple
- 1.63×
- Total profit
- $24,731
- Equity at exit
- $12,105
Cash invested: $39,200 (down + closing). Projections, not guarantees.
Landlord ↔ Tenant lean methodology
- Overall (STATE)
- 87 Strongly Landlord-Friendly
- State Florida
- 87 Strongly Landlord-Friendly · R+3
- County
- — inherits STATE
- City
- — inherits STATE
ZIP-level market 34613
- Home prices YoY
- -17.2%
- Active inventory
- 691
- Price-to-rent
- 6.9×
Monthly cashflow live
- Estimated rent
- $1,701 high interval (Pro) →
- Mortgage (P&I)
- −$734
- Tax est. 1.5%
- −$175 /mo · $2,100/yr
- Insurance
- −$58
- HOA
- −$55
- Vacancy / Maint / Mgmt
- −$357
- Net cashflow
- $321
Break-even live
UW: 25.0% down · 7.5% · 30yr · 1.5% tax · 5.0% vac · 8.0% maint · 8.0% mgmt
Financing live
Cash to close
- Down payment
- $35,000
- Closing costs
- $4,200
- Reserves months
- —
- Total cash needed
- —
Loan-product check · same deal, 3 products live
Conventional
25% down · 7.5% · 30yr
- Down + closing
- —
- Monthly P&I
- —
- Monthly cashflow
- —
- DSCR
- —
- Eligible?
- —
Personal DTI + credit; lowest rate.
DSCR
20% down · 8.5% · 30yr
- Down + closing
- —
- Monthly P&I
- —
- Monthly cashflow
- —
- DSCR
- —
- Eligible?
- —
No personal income docs; deal must DSCR.
Hard money
10% down · 12.0% · 12mo
- Down + closing
- —
- Monthly P&I
- —
- Monthly cashflow
- —
- DSCR
- —
- Eligible?
- —
Short-term bridge; refi at stabilization.
Rent comps 7 comps
| Address | Beds | Baths | Sqft | Rent | $/sqft | DOM | Units | Dist |
|---|---|---|---|---|---|---|---|---|
| 8871 Southern Charm Cir Brooksville, FL | 3.0 | 2.0 | 1482 | $2,050 | $1.38 | 24d | 1 | 0.38mi |
| 8917 Southern Charm Cir Brooksville, FL | 3.0 | 2.0 | 1437 | $1,695 | $1.18 | 3d | 1 | 0.42mi |
| 8407 Weatherford Ave Brooksville, FL | 2.0 | 2.0 | 1104 | $1,500 | $1.36 | 17d | 1 | 0.86mi |
| 15466 Brookridge Blvd Brooksville, FL | 2.0 | 2.0 | 828 | $1,225 | $1.48 | 24d | 1 | 0.87mi |
| 9919 Scepter Ave Brooksville, FL | 3.0 | 2.0 | 1188 | $1,250 | $1.05 | 4d | 1 | 0.90mi |
| 13020 Sun Rd Brooksville, FL | 2.0 | 2.0 | 1424 | $1,700 | $1.19 | 24d | 1 | 0.98mi |
| 14342 Starcross St Brooksville, FL | 2.0 | 1.0 | 900 | $1,025 | $1.14 | 21d | 1 | 1.39mi |
HOA detail
- Monthly dues
- $55 · $660/yr
Listing history 2 events
-
2026-05-11status Pending
-
2026-04-09$140,000 Active
ⓘ Source: listings_history table (triggers on properties + properties_extension) + one-shot
backfill from property_details.listing_events for pre-trigger history.
Climate risk First Street
- Flood 1/10 Low FEMA zone X (unshaded) · 0% chance over 30 yrs
- Wildfire 3/10 Moderate
- Heat 10/10 Extreme 7 d/yr ≥109°F today · 28 d/yr by 30 yrs out
- Wind 9/10 Extreme 99% chance of damaging wind over 30 yrs
- Air quality 2/10 Low 1 unhealthy d/yr today · 1 by 30 yrs out
Nearby sold comps map
Loading sold comps map…
Walkable amenities ~0.75 mi
Loading nearby amenities…
Taxation est. · year 1
- Rental income
- $20,415
- − Mortgage interest
- −$7,842
- − Property taxes
- −$2,100
- − Insurance
- −$700
- − Repairs & maintenance
- −$1,633
- − Management
- −$1,633
- − HOA
- −$660
- − Depreciation
- −$4,073
- Taxable income
- $1,773
- Est. tax owed @ 24.0%
- −$426
- After-tax cash flow
- $3,432/yr
For passive investors: Depreciation is non-cash, so a rental often shows a tax loss while cash-flowing — sheltering income. Rental losses are passive: they offset passive income freely, and up to $25,000/yr can offset ordinary (W-2) income if you actively participate and your MAGI is under $100k (phasing out to $0 by $150k); unused losses carry forward. On sale, claimed depreciation is recaptured at up to 25%, and gains may owe capital-gains tax (a 1031 exchange can defer both). Figures are a year-1 estimate at your 24.0% rate — not tax advice; consult a CPA.
Condition & rehab AI · 12 photos
This 1981 manufactured home requires moderate repairs and updates to improve its condition and value. Key areas for improvement include exterior paint, landscaping, kitchen cabinets, bathroom fixtures, and flooring. These updates can significantly enhance the home's resale and rental value.
Repairs flagged
- Minor Exterior paint — Some discoloration on white siding.
- Minor Landscaping — Overgrown areas need trimming.
- Minor Kitchen cabinets — Standard cabinets, could be updated for a fresh look.
- Minor Bathroom fixtures — Standard fixtures, could be replaced for a more modern look.
- Minor Flooring — Carpeted floors, could be replaced with hardwood or tile for a more modern look.
Value-add opportunities
- Resale Paint exterior — Fresh paint can improve curb appeal and home value.
- Both Replace flooring — New flooring can improve both resale and rental value.
- Resale Replace kitchen cabinets — Modern cabinets can enhance the kitchen's appearance and value.
- Resale Replace bathroom fixtures — Modern fixtures can improve the bathroom's appearance and value.
- Both Landscaping — A well-maintained yard can improve both resale and rental value.
Renovation cost estimate screening
| Repair item | Severity | Est. cost |
|---|---|---|
| Exterior paint · Some discoloration on white siding. | Minor | $500–3,000 |
| Landscaping · Overgrown areas need trimming. | Minor | $500–3,000 |
| Kitchen cabinets · Standard cabinets, could be updated for a fresh look. | Minor | $500–3,000 |
| Bathroom fixtures · Standard fixtures, could be replaced for a more modern look. | Minor | $500–3,000 |
| Flooring · Carpeted floors, could be replaced with hardwood or tile for a more modern look. | Minor | $500–3,000 |
| Total estimated repair cost · 5 items | $2,500–15,000 |
Value-add ROI direction
- Resale Paint exterior — Fresh paint can improve curb appeal and home value. ↑
- Both Replace flooring — New flooring can improve both resale and rental value. ↑
- Resale Replace kitchen cabinets — Modern cabinets can enhance the kitchen's appearance and value. ↑
- Resale Replace bathroom fixtures — Modern fixtures can improve the bathroom's appearance and value. ↑
- Both Landscaping — A well-maintained yard can improve both resale and rental value. ↑
ⓘ Cost ranges are severity-bucket heuristics (US national rule-of-thumb). Get contractor quotes + a written scope before underwriting a rehab budget.
Schools (NCES district)
- District
- Hernando
- NCES district ID
- 1200810
- Math proficiency
- 50% ▼ -8.00%
- Reading proficiency
- 50% ▼ -4.00%
- Median HH income
- $41,985
- Composite
- 42.03/100
- National rank
- #3329
- State rank
- #38 of 73 in FL
Livability — Brookridge
- Score
- 70/100
- State rank
- #421
- US rank
- #7529
Category grades
Schools grade is shown separately in the Schools card above.
Census & demographics
- Census place
- Brookridge, FL
- County
- Hernando County · 169,677 people
- Metro
- Tampa-St. Petersburg-Clearwater, FL
- Population (ZIP)
- 19,337
- Household income
- $58,596
- Rent vs Own
- Severe rent burden
- 307.0
Population outlook (Hernando County) Hauer SSP2
- Today (2025)
- 189,218 people
- By 2030
- 194,367 · +2.7%
- By 2040
- 203,398 · +7.5%
- By 2050
- 209,589 · +10.8%
- By 2075
- 218,452 · +15.4%
- By 2100
- 205,923 · +8.8%
Race, ethnicity, and origin ACS 2023
- Neighborhood character
- Predominantly White (88%)
- Race & ethnicity
- White 88% Hispanic / Latino 6% Two or more races 4% Black 2% Asian 1%
- Hispanic origin (detail)
- Mexican 1% Puerto Rican 2% Cuban 1%
- Common ancestry
- Romanian 4% Lithuanian 3% Slovak 2%
- Foreign-born
- 8% · Canada, Vietnam
- Languages at home
- 92% English-only · Spanish 3% French/Haitian/Cajun 1% Russian/Polish/Slavic 1%
Political lean MEDSL · Hernando
- 2024 margin
- Solid R (+37.0) · D 31.1% · R 68.2%
- 2008→2024 swing
- -33.5pp toward R · 2008: -3.6pp · 2024: -37.0pp
- All cycles
- 2024: R+37.0 2020: R+30.2 2016: R+29.0 2012: R+8.5 2008: R+3.6
Not yet ingested
- Civics
- —
Market trends
- HPI YoY
- ▼ -57.51%
- Current HPI
- 276.2229
- Rent YoY
- —
- Metro
- Tampa-St. Petersburg-Clearwater, FL
- State GDP YoY
- ▲ 3.28%
- F500 in state
- 36
Industry mix (Fortune 500 HQ in FL)
| Industry | F500 HQs | Revenue |
|---|---|---|
| Industrial Technology | 2 | $29B |
|
||
| Insurance | 2 | $17B |
|
||
| Retail | 1 | $60B |
|
||
| Technology Distribution | 1 | $58B |
|
||
| Homebuilding | 1 | $35B |
|
||
| Technology Manufacturing | 1 | $35B |
|
||
Price history
2 events — show timeline
- 2026-05-11 Pending — HCAR
- 2026-04-09 Listed $140,000 HCAR
Cash-flow waterfall
monthlySold comps — $/sqft
last 12 mo · ≤1 miLoading sold comps…