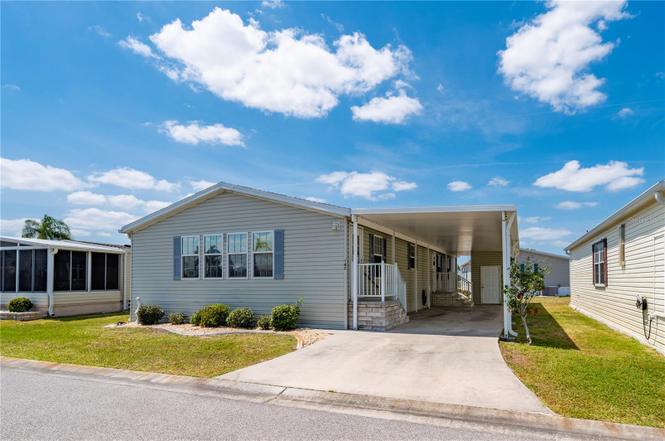
1000 Kings Hwy #147 · Port Charlotte, FL
Flood risk 1/10 · Minimal
- FEMA flood zone
- X (unshaded)
- Chance of flooding over 30 yrs
- 0.0%
- Est. flood insurance / yr
- $507 – $1,088
Fire risk 2/10 · Minimal
- Est. fire insurance / yr
- $947 – $1,759
Heat risk 10/10 · Severe
- Hot days now (above 107°F)
- 7 days/yr
- Hot days in 30 yrs
- 28 days/yr
Wind risk 10/10 · Severe
- Chance of severe wind over 30 yrs
- 99.0%
Air-quality risk 2/10 · Minimal
- Unhealthy air days now
- 2 days/yr
- Unhealthy air days in 30 yrs
- 2 days/yr
Risk factors via First Street. Map © Google.
Why this score? — see what drove the B+ grade
The composite is a weighted blend of 9 inputs, each scored 0–100. Each bar is that input's sub-score; the figure is the points it added to the 100-point composite (weight × sub-score).
- Cash flow +30.0/30.0
- ARV discount +15.0/15.0
- 1% rule +10.0/10.0
- DSCR +10.0/10.0
- Schools +4.6/10.0
- Livability +3.2/5.0
- Condition / age +2.5/5.0
- Rent growth +1.5/5.0
- Appreciation +0.0/10.0
$139,000
🖨 Deal sheet (PDF) 📄 Offer letter ✓ Due diligence
Listing remarks
Under contract-accepting backup offers. Motivated Seller. Port Charlotte Village was voted #1 Manufactured home community in 2024. Not in Flood Zone. Welcome to this beautifully furnished manufactured home located in a desirable 55+ community, just minutes from shopping, dining, entertainment, world-class golf courses, top-rated hospitals, and some of Florida’s best fishing spots. Step into the spacious Florida room, a perfect spot to sip your morning coffee and soak in the sunshine. The open-concept kitchen flows seamlessly into the living and dining areas, creating a warm, inviting atmosphere ideal for entertaining or everyday living. The owner’s suite is a peaceful retreat,
Key facts
- Not in flood zone
- Open-concept kitchen
- Walk-in closet
Tags
Property features AI
Finance
- Financial info: Total monthly fees $300; Total annual fees $3,600
- HOA & community: Has HOA (monthly fee $300); HOA includes cable TV, pool, internet, structure and grounds maintenance, private road, recreational facilities, sewer, trash, water; Association amenities: clubhouse, maintenance, pool, recreation facilities, pickleball courts, shuffleboard court, storage, wheelchair access; Buyer approval required; Senior community; Community features: community mailbox, dog park, street lights, golf carts OK; Pets allowed (cats and dogs; number and size limits apply, max pet weight 25 lbs)
Exterior
- Parking: Covered parking; Driveway; 2-space carport
- Utilities: Public water; Public sewer; Electricity available and connected; Cable available and connected; Fiber optics; BB/HS internet available; Water connected; Sewer connected
- Home design: Manufactured double-wide home; One story; Northeast facing
- Construction: Vinyl siding; Shingle roof; Crawlspace foundation; Built in (see public records for year)
- Exterior features: Lighting; Rain gutters; Storage; Shed(s)
Interior
- Kitchen: Convection oven; Dishwasher; Microwave; Refrigerator
- Bedrooms: 3 bedrooms
- Bathrooms: 2 full bathrooms
- Heating & cooling: Central heating; Central air conditioning
- Interior features: Built-in features; Crown molding; High ceilings; Open floorplan; Thermostat; Walk-in closet(s); Window treatments (blinds, drapes)
- Laundry & utility: Washer and dryer; Inside laundry room
Neighborhood map
What this means for you Summary
Snapshot
- This is a 3-bed/2.0-bath manufactured listed at $139k.
Deal economics
- At list price, monthly cash flow is $592 ($7k/yr) — positive.
- The deal already cash-flows at list — no discount required.
- Meets the 1% rule at list price ($2k rent vs $139k).
- Recommended offer: $122k (12.0% below list) — sets the bar for market timing.
- Cap rate 11.4% vs local median 4.4% in Port Charlotte — top-decile yield for the area; either an underpriced asset or a hidden risk that comps aren't pricing in. Stress-test before assuming the spread holds.
Location & tenants
- Location reads 65/100 on livability (#655 in FL) — a middle-class / working-renter tenant base. Strengths: cost of living A+, housing A+; Watch: employment D, amenities F, commute F.
- Charlotte (suburban): math 54% / reading 54% proficiency, ranked #22 of 73 in FL (top 30%) — acceptable for families but not a draw, mixed tenant base, ~2y average lease.
- Zoned schools: Kingsway Elementary School (math 55% / reading 53%, grade C, #936 of 2,144 statewide, top 44%, 596 students, 58% FRL); Port Charlotte Middle School (math 59% / reading 50%, grade B-, #183 of 571 statewide, top 34%, 877 students, 55% FRL); Charlotte High School (math 44% / reading 46%, grade D-, #228 of 667 statewide, top 35%, 1,994 students, 41% FRL) — zoned schools at 51% FRL track the district average.
- Market conditions: Rents falling (-4.0%/yr); 603 active listings in the ZIP; 25 comparable units currently listed for rent nearby; rentals at typical pace (median 23d on market — plan ~3-4 weeks tenant-placement turnaround); 4,585 units permitted in Charlotte County in 2024 (703 in 5+ unit buildings).
- At $2,409/mo this rent would consume 45% of the median local household income ($64k/yr) (locally 612% of renters already pay >50% of income on rent) — very limited rent-growth headroom before tenants either downsize or default.
Forward outlook
- Local home prices are declining (-3.0%/yr); year-one equity from $961 of loan paydown is wiped out by about $4k of value loss. Plan a longer hold.
- Charlotte County population projected at +24% by 2050 — long-run rental-demand tailwind backs the buy-and-hold thesis.
- At projected returns (-3.0% appreciation + 0.0% rent growth), your $39k cash investment doubles in ~10 years — after that, you're playing with house money.
Negotiation context
- It's been on market 325 days — a 12% lower offer ($122k) is reasonable based on typical stale-listing flexibility.
- 3 sale attempts since 3y ago; this cycle's ask has dropped $46k (25%) from the opening price — seller is motivated, your offer sets the floor, not the list.
Risks & watch-outs
- Climate carrying-cost: severe wind risk, 99% chance of damaging wind over 30y; extreme-heat days projected 7→28/yr by 2055 (HVAC capex compounding) — expect insurance premiums to compound above CPI over the hold.
Questions for the listing agent
- It's been on market 325 days. Have you received any prior offers? Is the seller open to a 12% concession, seller financing, or rate buy-down credit?
- What does the HOA fee cover, when was the last increase, and are there any pending special assessments or reserve-fund shortfalls?
- Why hasn't it sold? Are there any deal-killer items the seller is aware of (foundation, flood, title, zoning, code violations)?
- Is there a deadline driving the sale (1031 exchange, divorce, estate, relocation)? That informs how much negotiation room exists.
- Schools are D-rated, which usually means shorter tenancies and higher turnover. Who's the typical renter profile here, and what's been the actual vacancy rate?
- What's the average days-on-market for RENTAL listings here right now (not sales)? A rising rental-DOM trend means longer vacancies and softer asking-rent achievability than the comps imply.
- What's the recent tenant-quality profile in this submarket — average credit score on applications, eviction rate, late-payment / NSF rate, and stable-employment percentage? A property-management company in the area should have these aggregated.
- How much new for-sale + rental construction is in the pipeline within 1–3 miles? Heavy new supply typically softens prices + rents 12–24 months out; constrained supply supports both.
Investment metrics
- 1% rule
- 1.73% ✓
- Cap rate
- 11.40%
- Cash-on-cash
- 18.24%
- DSCR
- 1.81
- GRM
- 4.8
CMA / ARV
- ARV (on-the-fly)
- $169,128
- Comps found
- 2
Show comp detail 2 sales within ~0.75 mi
| Address | Dist | Beds/Ba | Sqft | Sold | Price | $/sf | Match |
|---|---|---|---|---|---|---|---|
| 1000 Kings Hwy #207 | 0.14mi | 3/2.0 | 1,404 (-10%) | 12mo | $150,000 | $107 | 67 |
| 1000 Kings Hwy #181 | 0.11mi | 2/2.0 (-1) | 1,344 (-14%) | 9mo | $145,000 | $108 | 59 |
Match score weights: distance 35% · size 25% · config 20% · recency 20%. Top-matched comps best support the ARV.
Projected returns pro-forma
-3.0% appreciation · 0.0% rent growth · sell at horizon
- IRR
- 5.8%
- Equity multiple
- 1.21×
- Total profit
- $8,348
- Equity at exit
- $20,725
- IRR
- 11.6%
- Equity multiple
- 1.76×
- Total profit
- $29,526
- Equity at exit
- $12,018
Cash invested: $38,920 (down + closing). Projections, not guarantees.
Landlord ↔ Tenant lean methodology
- Overall (STATE)
- 87 Strongly Landlord-Friendly
- State Florida
- 87 Strongly Landlord-Friendly · R+3
- County
- — inherits STATE
- City
- — inherits STATE
ZIP-level market 33980
- Home prices YoY
- -5.0%
- Rents YoY
- -4.0%
- Active inventory
- 603
- Price-to-rent
- 4.8×
Monthly cashflow live
- Estimated rent
- $2,409 high interval (Pro) →
- Mortgage (P&I)
- −$729
- Tax from tax record
- −$225 /mo · $2,700/yr
- Insurance
- −$58
- HOA
- −$300
- Vacancy / Maint / Mgmt
- −$506
- Net cashflow
- $592
Break-even live
Sensitivity live
| Price | -10% $670 | -5% $631 | +0% $592 | +5% $552 | +10% $513 |
|---|---|---|---|---|---|
| Rent | -10% $401 | -5% $496 | +0% $592 | +5% $687 | +10% $782 |
| Rate | -1.0pp $662 | -0.5pp $627 | base $592 | +0.5pp $556 | +1.0pp $519 |
UW: 25.0% down · 7.5% · 30yr · 1.5% tax · 5.0% vac · 8.0% maint · 8.0% mgmt
Financing live
Cash to close
- Down payment
- $34,750
- Closing costs
- $4,170
- Reserves months
- —
- Total cash needed
- —
Loan-product check · same deal, 3 products live
Conventional
25% down · 7.5% · 30yr
- Down + closing
- —
- Monthly P&I
- —
- Monthly cashflow
- —
- DSCR
- —
- Eligible?
- —
Personal DTI + credit; lowest rate.
DSCR
20% down · 8.5% · 30yr
- Down + closing
- —
- Monthly P&I
- —
- Monthly cashflow
- —
- DSCR
- —
- Eligible?
- —
No personal income docs; deal must DSCR.
Hard money
10% down · 12.0% · 12mo
- Down + closing
- —
- Monthly P&I
- —
- Monthly cashflow
- —
- DSCR
- —
- Eligible?
- —
Short-term bridge; refi at stabilization.
Rent comps 25 comps
| Address | Beds | Baths | Sqft | Rent | $/sqft | DOM | Units | Dist |
|---|---|---|---|---|---|---|---|---|
| 24312 Westgate Blvd Punta Gorda, FL | 3.0 | 2.0 | 2044 | $4,500 | $2.20 | 22d | 1 | 0.33mi |
| 1829 Knights Bridge Trl Punta Gorda, FL | 2.0 | 2.0 | 1509 | $2,000 | $1.33 | 22d | 1 | 0.41mi |
| 24484 Zephyr Ct Unit 24484 Punta Gorda, FL | 3.0 | 2.0 | 1255 | $1,695 | $1.35 | 22d | 1 | 0.42mi |
| 1670 Royal Ct Punta Gorda, FL | 2.0 | 2.0 | 1393 | $2,400 | $1.72 | 22d | 1 | 0.43mi |
| 1200 Loveland Blvd Punta Gorda, FL | 1.0–3.0 | 1.0–2.0 | 1151 | $2,660 | $2.31 | 15d | 276 | 0.47mi |
| 1717 Sunderland Dr Punta Gorda, FL | 2.0 | 2.0 | 1402 | $2,800 | $2.00 | 22d | 1 | 0.50mi |
| 24151 Beatrix Blvd Port Charlotte, FL | 3.0 | 1.0–2.0 | 990 | $2,272 | $2.29 | 15d | 28 | 0.51mi |
| 24401 Manchester Trl Punta Gorda, FL | 2.0 | 2.0 | 1382 | $2,000 | $1.45 | 22d | 1 | 0.59mi |
| 1867 Nottingham Trl Punta Gorda, FL | 3.0 | 2.0 | 1646 | $2,000 | $1.22 | 22d | 1 | 0.59mi |
| 24472 Manchester Trl Punta Gorda, FL | 2.0 | 2.0 | 1373 | $1,900 | $1.38 | 22d | 1 | 0.75mi |
| 24150 Beatrix Blvd Port Charlotte, FL | 3.0 | 1.0–2.0 | 866 | $1,978 | $2.28 | 15d | 42 | 0.80mi |
| 24001 Madaca Ln Port Charlotte, FL | 1.0–3.0 | 1.0–2.0 | 1179 | $1,944 | $1.65 | 15d | 26 | 0.85mi |
| 1471 Capricorn Blvd Unit A Punta Gorda, FL | 3.0 | 2.0 | 1450 | $1,900 | $1.31 | 15d | 1 | 0.87mi |
| 23289 Nancy Ave Port Charlotte, FL | 3.0 | 2.0 | 2059 | $2,000 | $0.97 | 22d | 1 | 0.99mi |
| 271 Campinas St Punta Gorda, FL | 4.0 | 2.0 | 2145 | $2,500 | $1.17 | 15d | 1 | 1.02mi |
| 175 Kings Hwy Port Charlotte, FL | 2.0 | 2.0 | 1219 | $1,398 | $1.15 | 22d | 3 | 1.07mi |
| 25199 Chiclayo Ave Punta Gorda, FL | 3.0 | 2.0 | 1977 | $2,100 | $1.06 | 15d | 1 | 1.08mi |
| 23261 Lehigh Ave Port Charlotte, FL | 3.0 | 2.0 | 2155 | $2,300 | $1.07 | 15d | 1 | 1.16mi |
| 175 Kings Hwy Unit A8 Punta Gorda, FL | 2.0 | 2.0 | 1228 | $1,700 | $1.38 | 22d | 1 | 1.18mi |
| 23184 Glory Ave Port Charlotte, FL | 2.0 | 2.0 | 1370 | $2,000 | $1.46 | 22d | 1 | 1.19mi |
| 25230 Campos Dr Punta Gorda, FL | 3.0 | 2.0 | 1460 | $1,750 | $1.20 | 22d | 1 | 1.31mi |
| 1314 Beacon Dr Port Charlotte, FL | 3.0 | 2.0 | 1783 | $2,500 | $1.40 | 22d | 1 | 1.32mi |
| 25583 Deep Creek Blvd Punta Gorda, FL | 4.0 | 2.0 | 1810 | $2,300 | $1.27 | 15d | 1 | 1.46mi |
| 25442 Rampart Blvd Punta Gorda, FL | 3.0 | 2.0 | 2032 | $2,800 | $1.38 | 22d | 1 | 1.49mi |
| 25599 Deep Creek Blvd Punta Gorda, FL | 4.0 | 2.0 | 1806 | $1,995 | $1.10 | 15d | 1 | 1.49mi |
HOA detail
- Monthly dues
- $300 · $3,600/yr
Listing history 14 events
-
2026-06-02statusdays on market $139,000 Pending 325 DOM
-
2026-06-01days on market $139,000 Active 324 DOM
-
2026-05-31days on market $139,000 Active 323 DOM
-
2026-05-30days on market $139,000 Active 322 DOM
-
2026-04-29price $150,000
-
2026-04-10status Active
-
2026-01-27status Pending
-
2026-01-08price $159,000
-
2025-10-16price $170,000
-
2025-04-30$185,000 Active
-
2024-06-11historical
-
2024-04-24price $219,900
-
2024-01-19price $229,900
-
2023-10-19$245,000 Active
ⓘ Source: listings_history table (triggers on properties + properties_extension) + one-shot
backfill from property_details.listing_events for pre-trigger history.
Tax reassessment forecast FL · Resets to sale price
- Current annual tax
- $2,700 · $225/mo
- Projected year-2 tax
- $2,700 · $225/mo
- Expected delta
- $0/yr ($0/mo · 0.0%)
ⓘ Screening estimate from a state-policy table — verify with the county assessor before closing.
Climate risk First Street
- Flood 1/10 Low FEMA zone X (unshaded) · 0% chance over 30 yrs
- Wildfire 2/10 Low
- Heat 10/10 Extreme 7 d/yr ≥107°F today · 28 d/yr by 30 yrs out
- Wind 10/10 Extreme 99% chance of damaging wind over 30 yrs
- Air quality 2/10 Low 2 unhealthy d/yr today · 2 by 30 yrs out
Nearby sold comps map
Loading sold comps map…
Walkable amenities ~0.75 mi
Loading nearby amenities…
Taxation est. · year 1
- Rental income
- $28,914
- − Mortgage interest
- −$7,786
- − Property taxes
- −$2,700
- − Insurance
- −$695
- − Repairs & maintenance
- −$2,313
- − Management
- −$2,313
- − HOA
- −$3,600
- − Depreciation
- −$4,044
- Taxable income
- $5,463
- Est. tax owed @ 24.0%
- −$1,311
- After-tax cash flow
- $5,789/yr
For passive investors: Depreciation is non-cash, so a rental often shows a tax loss while cash-flowing — sheltering income. Rental losses are passive: they offset passive income freely, and up to $25,000/yr can offset ordinary (W-2) income if you actively participate and your MAGI is under $100k (phasing out to $0 by $150k); unused losses carry forward. On sale, claimed depreciation is recaptured at up to 25%, and gains may owe capital-gains tax (a 1031 exchange can defer both). Figures are a year-1 estimate at your 24.0% rate — not tax advice; consult a CPA.
Schools (NCES district)
- District
- Charlotte
- NCES district ID
- 1200240
- Math proficiency
- 54% ▼ -6.00%
- Reading proficiency
- 54% ▼ -1.00%
- Median HH income
- $44,864
- Composite
- 45.62/100
- National rank
- #2586
- State rank
- #22 of 73 in FL
Livability — Port Charlotte
- Score
- 65/100
- State rank
- #655
- US rank
- #13081
Category grades
Schools grade is shown separately in the Schools card above.
Census & demographics
- County
- Charlotte County · 196,994 people
- City population
- 102,180
- Metro
- Punta Gorda, FL
- Population (ZIP)
- 13,120
- Household income
- $63,591
- Rent vs Own
- Severe rent burden
- 612.0
Population outlook (Charlotte County) Hauer SSP2
- Today (2025)
- 198,646 people
- By 2030
- 210,507 · +6.0%
- By 2040
- 230,857 · +16.2%
- By 2050
- 247,148 · +24.4%
- By 2075
- 281,777 · +41.8%
- By 2100
- 293,609 · +47.8%
Race, ethnicity, and origin ACS 2023
- Neighborhood character
- Predominantly White (75%)
- Race & ethnicity
- White 75% Hispanic / Latino 10% Two or more races 10% Black 9%
- Hispanic origin (detail)
- Puerto Rican 3% Cuban 2% Dominican 2%
- Common ancestry
- Romanian 5% Hispanic 4% Slovak 3%
- Foreign-born
- 16% · Canada, Jamaica
- Languages at home
- 85% English-only · Spanish 8% French/Haitian/Cajun 5% German/W. Germanic 1%
Political lean MEDSL · Charlotte
- 2024 margin
- Solid R (+34.0) · D 32.7% · R 66.7%
- 2008→2024 swing
- -26.7pp toward R · 2008: -7.2pp · 2024: -34.0pp
- All cycles
- 2024: R+34.0 2020: R+26.6 2016: R+27.8 2012: R+14.3 2008: R+7.2
Not yet ingested
- Civics
- —
Market trends
- HPI YoY
- ▼ -16.02%
- Current HPI
- 306.3331
- Rent YoY
- ▼ -4.04%
- Metro
- Punta Gorda, FL
- State GDP YoY
- ▲ 3.28%
- F500 in state
- 36
Industry mix (Fortune 500 HQ in FL)
| Industry | F500 HQs | Revenue |
|---|---|---|
| Industrial Technology | 2 | $29B |
|
||
| Insurance | 2 | $17B |
|
||
| Retail | 1 | $60B |
|
||
| Technology Distribution | 1 | $58B |
|
||
| Homebuilding | 1 | $35B |
|
||
| Technology Manufacturing | 1 | $35B |
|
||
Price history
-38.8% since first listed10 events — show timeline
- 2026-04-29 Price Changed $150,000 Stellar MLS as Distributed by MLS Grid
- 2026-04-10 Relisted — Stellar MLS as Distributed by MLS Grid
- 2026-01-27 Pending — Stellar MLS as Distributed by MLS Grid
- 2026-01-08 Price Changed $159,000 Stellar MLS as Distributed by MLS Grid
- 2025-10-16 Price Changed $170,000 Stellar MLS as Distributed by MLS Grid
- 2025-04-30 Listed $185,000 Stellar MLS as Distributed by MLS Grid
- 2024-06-11 Listing Removed — Stellar MLS as Distributed by MLS Grid
- 2024-04-24 Price Changed $219,900 Stellar MLS as Distributed by MLS Grid
- 2024-01-19 Price Changed $229,900 Stellar MLS as Distributed by MLS Grid
- 2023-10-19 Listed $245,000 Stellar MLS as Distributed by MLS Grid
Property tax history
+3.9%/yrLatest (2025): $2,700 · -10.3% YoY. Source: county tax records.
Cash-flow waterfall
monthlySold comps — $/sqft
last 12 mo · ≤1 miLoading sold comps…