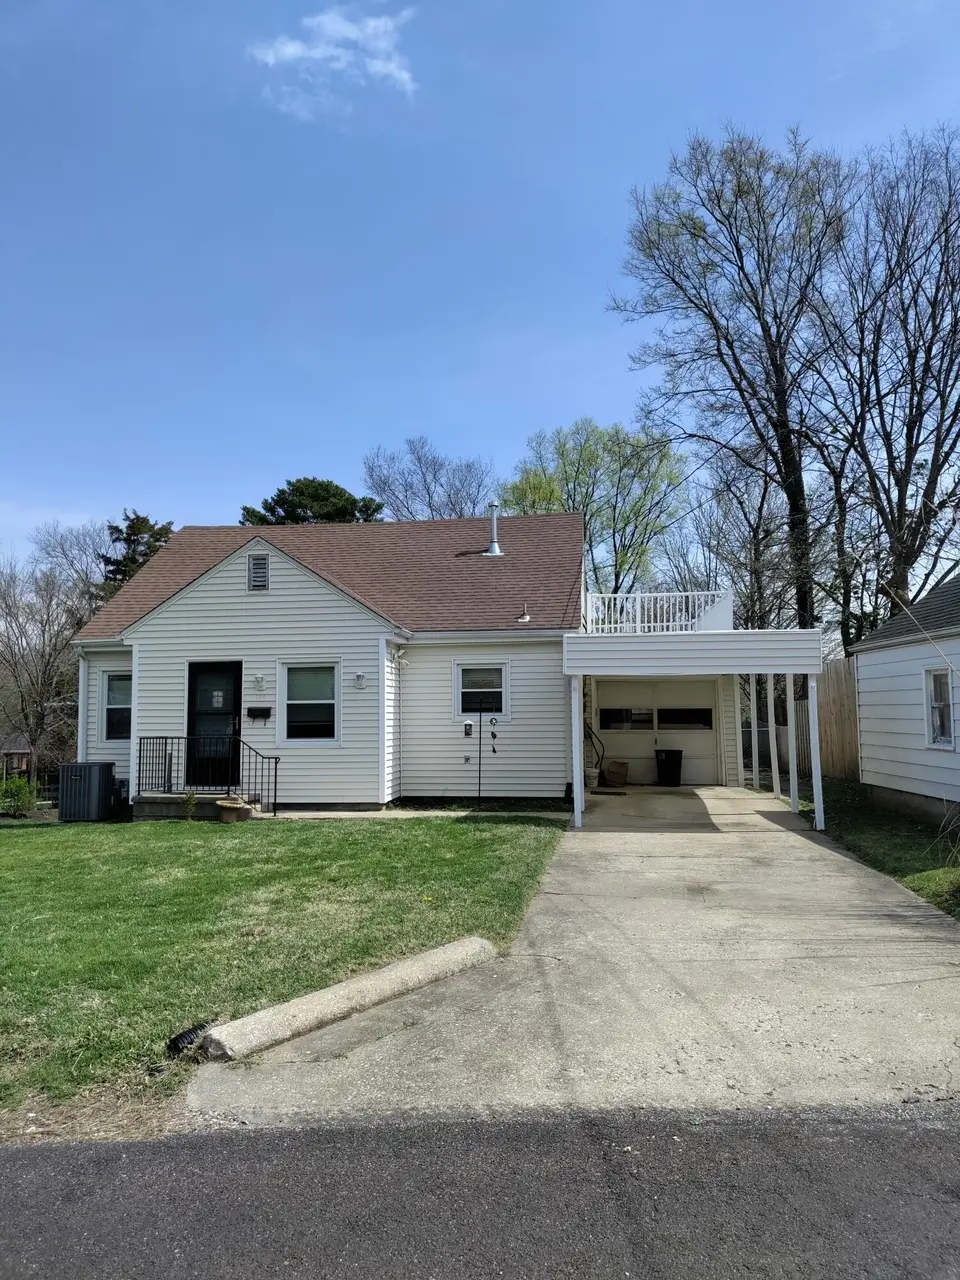
304 Fredora Ave · Columbia, MO
Flood risk 1/10 · Minimal
- FEMA flood zone
- X (unshaded)
- Chance of flooding over 30 yrs
- 0.0%
- Est. flood insurance / yr
- $473 – $860
Fire risk 2/10 · Minimal
- Est. fire insurance / yr
- $1,054 – $1,958
Heat risk 4/10 · Minor
- Hot days now (above 107°F)
- 7 days/yr
- Hot days in 30 yrs
- 19 days/yr
Wind risk 2/10 · Minimal
- Chance of severe wind over 30 yrs
- 0.0%
Air-quality risk 2/10 · Minimal
- Unhealthy air days now
- 1 days/yr
- Unhealthy air days in 30 yrs
- 1 days/yr
Risk factors via First Street. Map © Google.
Why this score? — see what drove the D grade
The composite is a weighted blend of 9 inputs, each scored 0–100. Each bar is that input's sub-score; the figure is the points it added to the 100-point composite (weight × sub-score).
- Cash flow +12.2/30.0
- ARV discount +8.1/15.0
- Livability +4.2/5.0
- Rent growth +4.0/5.0
- DSCR +3.6/10.0
- Schools +3.1/10.0
- 1% rule +2.7/10.0
- Condition / age +2.5/5.0
- Appreciation +0.0/10.0
$289,900
🖨 Deal sheet 📄 Offer letter ✓ Due diligence
Listing remarks MLS
Located within walking distance to the University of Missouri, this home has had many updates by currant owner, including all new windows, new HVAC, remodeled kitchen and baths, and water heater. Current tenants hve lease until end of 2026, but have agreed to void lease and move with 45 days notice. $1500/mo rental income. Has attached garage as well as a car port. Please text agent all showing requests to insure appt. as occupants phone not working well with showing time.
Key facts
- Attached garage
- New hvac
- Remodeled kitchen
Tags
Neighborhood map
What this means for you Summary
Snapshot
- This is a 4-bed/2.0-bath single-family listed at $290k.
Deal economics
- At list price, monthly cash flow is $-61 ($-730/yr) — negative.
- To cash-flow at today's rent, offer at most $279k (3.7% below list).
- To meet the 1% rule (rent ≥ 1% of price), the offer needs to be $223k (23.0% below list).
- Recommended offer: $223k (23.0% below list) — sets the bar for 1% rule.
- Cap rate 6.0% vs local median 2.9% in Columbia — top-decile yield for the area; either an underpriced asset or a hidden risk that comps aren't pricing in. Stress-test before assuming the spread holds.
Location & tenants
- Location reads 83/100 on livability (#9 in MO, #862 nationally) — a professional / high-income tenant draw. Strengths: amenities A+, commute A+, cost of living A+; Watch: crime D+.
- Columbia 93 (urban): math 30% / reading 43% proficiency, ranked #194 of 324 in MO (top 60%) — families likely to look elsewhere, expect single-tenant / working-renter base with shorter leases.
- Market conditions: Rents rising fast (+6.1%/yr); 459 active listings in the ZIP; 31 comparable units currently listed for rent nearby; rentals lingering (median 44d on market — plan ~5-8 weeks vacancy on turnover, expect pricing pressure); 52% of comp listings sitting > 30 days — soft ceiling on asking rent; solid renter incomes; 1,303 units permitted in Boone County in 2024 (549 in 5+ unit buildings).
- This rent runs 34% of the median local income ($80k/yr) — at the standard rent-burdened threshold; future hikes will face affordability resistance.
Forward outlook
- Local home prices are declining (-3.0%/yr); year-one equity from $2k of loan paydown is wiped out by about $9k of value loss. Plan a longer hold.
- Boone County population projected at +36% by 2050 — long-run rental-demand tailwind backs the buy-and-hold thesis.
Negotiation context
- It's been on market 70 days — a 6% lower offer ($273k) is reasonable based on typical stale-listing flexibility.
- 3 sale attempts since 12y ago with the ask held roughly flat each time — persistent listings suggest the price (not the market) is what's stuck; bring a comps-based counter.
Risks & watch-outs
- Watch-outs: built in 1951 — expect roof / HVAC / electrical / plumbing capex.
Questions for the listing agent
- What do current leases actually rent for vs. the listed asking? Can we see a recent rent roll and the last 12 months of T-12 income?
- It's been on market 70 days. Have you received any prior offers? Is the seller open to a 23% concession, seller financing, or rate buy-down credit?
- Built in 1951 — when were the roof, HVAC, electrical panel, plumbing, and water heater last replaced?
- Why hasn't it sold? Are there any deal-killer items the seller is aware of (foundation, flood, title, zoning, code violations)?
- Is there a deadline driving the sale (1031 exchange, divorce, estate, relocation)? That informs how much negotiation room exists.
- Schools are B-rated — typically a magnet for longer-tenancy family renters. What's the average tenant stay here, and is there a school-zone premium baked into asking?
- Crime grade is D in this area — have there been break-ins, vandalism, or insurance claims at this property in the last 3 years? What carrier currently insures it and at what premium?
- The area grade is low — what's the realistic commute time and amenity access for the typical tenant pool here? Any planned neighborhood developments (good or bad) we should know about?
- What's the average days-on-market for RENTAL listings here right now (not sales)? A rising rental-DOM trend means longer vacancies and softer asking-rent achievability than the comps imply.
- What's the recent tenant-quality profile in this submarket — average credit score on applications, eviction rate, late-payment / NSF rate, and stable-employment percentage? A property-management company in the area should have these aggregated.
- How much new for-sale + rental construction is in the pipeline within 1–3 miles? Heavy new supply typically softens prices + rents 12–24 months out; constrained supply supports both.
Investment metrics
- 1% rule
- 0.77% ✗
- Cap rate
- 6.04%
- Cash-on-cash
- -0.90%
- DSCR
- 0.96
- GRM
- 10.8
CMA / ARV
- ARV (median comp)
- $294,122
- List price
- $289,900
- Delta
- -1.44%
- Verdict
- FAIR
- Comps
- 20 within 1.0 mi
Show comp detail 12 sales within ~0.75 mi
| Address | Dist | Beds/Ba | Sqft | Sold | Price | $/sf | Match |
|---|---|---|---|---|---|---|---|
| 203 Edgewood Ave | 0.39mi | 4/2.5 | 1,705 (+9%) | 0mo | $353,728 | $207 | 65 |
| 505 S West Blvd | 0.18mi | 3/2.5 (-1) | 1,778 (+13%) | 1mo | $335,000 | $188 | 61 |
| 105 Westridge Dr | 0.54mi | 4/2.0 | 1,426 (-9%) | 1mo | $294,900 | $207 | 59 |
| 1609 W Broadway | 0.71mi | 4/2.0 | 1,439 (-8%) | 5mo | $250,000 | $174 | 49 |
| 1117 ST Christopher St | 0.56mi | 4/2.0 | 1,718 (+10%) | 16mo | $260,000 | $151 | 44 |
| 705 Westridge Dr | 0.56mi | 3/2.0 (-1) | 1,774 (+13%) | 4mo | $389,900 | $220 | 44 |
| 812 Maplewood Dr | 0.64mi | 3/1.5 (-1) | 1,603 (+2%) | 19mo | $260,000 | $162 | 44 |
| 805 W Ash St | 0.48mi | 3/2.0 (-1) | 1,750 (+12%) | 12mo | $242,500 | $139 | 43 |
| 1312 Garden Ct | 0.48mi | 4/2.0 | 1,778 (+13%) | 21mo | $170,000 | $96 | 38 |
| 1008 Lakeshore Dr | 0.55mi | 3/1.0 (-1) | 1,783 (+14%) | 8mo | $354,900 | $199 | 35 |
| 311 Mcbaine Ave | 0.73mi | 4/2.0 | 1,336 (-15%) | 10mo | $145,000 | $109 | 33 |
| 907 Again St | 0.68mi | 3/1.0 (-1) | 1,427 (-9%) | 15mo | $248,623 | $174 | 32 |
Match score weights: distance 35% · size 25% · config 20% · recency 20%. Top-matched comps best support the ARV.
Projected returns pro-forma
-3.0% appreciation · 6.09% rent growth · sell at horizon
- IRR
- -14.7%
- Equity multiple
- 0.46×
- Total profit
- $-43,772
- Equity at exit
- $43,225
- IRR
- -2.0%
- Equity multiple
- 0.85×
- Total profit
- $-12,124
- Equity at exit
- $25,065
Cash invested: $81,172 (down + closing). Projections, not guarantees.
Landlord ↔ Tenant lean methodology
- Overall (STATE)
- 81 Strongly Landlord-Friendly
- State Missouri
- 81 Strongly Landlord-Friendly · R+10
- County
- — inherits STATE
- City
- — inherits STATE
ZIP-level market 65203
- Rents YoY
- 6.1%
- Active inventory
- 459
- Price-to-rent
- 10.8×
Monthly cashflow live
- Estimated rent
- $2,233 high interval (Pro) →
- Mortgage (P&I)
- −$1,520
- Tax from tax record
- −$184 /mo · $2,203/yr
- Insurance
- −$121
- HOA
- −$0
- Vacancy / Maint / Mgmt
- −$469
- Net cashflow
- $-61
Break-even live
UW: 25.0% down · 7.5% · 30yr · 1.5% tax · 5.0% vac · 8.0% maint · 8.0% mgmt
Financing live
Cash to close
- Down payment
- $72,475
- Closing costs
- $8,697
- Reserves months
- —
- Total cash needed
- —
Loan-product check · same deal, 3 products live
Conventional
25% down · 7.5% · 30yr
- Down + closing
- —
- Monthly P&I
- —
- Monthly cashflow
- —
- DSCR
- —
- Eligible?
- —
Personal DTI + credit; lowest rate.
DSCR
20% down · 8.5% · 30yr
- Down + closing
- —
- Monthly P&I
- —
- Monthly cashflow
- —
- DSCR
- —
- Eligible?
- —
No personal income docs; deal must DSCR.
Hard money
10% down · 12.0% · 12mo
- Down + closing
- —
- Monthly P&I
- —
- Monthly cashflow
- —
- DSCR
- —
- Eligible?
- —
Short-term bridge; refi at stabilization.
Rent comps 31 comps
| Address | Beds | Baths | Sqft | Rent | $/sqft | DOM | Units | Dist |
|---|---|---|---|---|---|---|---|---|
| 1007 W Ash St Columbia, MO | 4.0 | 2.0 | 1456 | $1,550 | $1.06 | 44d | 1 | 0.50mi |
| 205 West Blvd N Columbia, MO | 4.0 | 2.0 | 1456 | $1,550 | $1.06 | 44d | 1 | 0.50mi |
| 1011 W Ash St Columbia, MO | 4.0 | 2.0 | 1456 | $1,550 | $1.06 | 44d | 1 | 0.51mi |
| 202 Wheaton Ct Columbia, MO | 3.0 | 2.0 | 1456 | $2,800 | $1.92 | 44d | 1 | 0.52mi |
| 204 Wheaton Ct Columbia, MO | 3.0 | 2.0 | 1456 | $2,800 | $1.92 | 44d | 1 | 0.52mi |
| 201 Wheaton Ct Columbia, MO | 3.0 | 2.0 | 1456 | $2,800 | $1.92 | 13d | 1 | 0.53mi |
| 201 Wheaton Ct Columbia, MO | 3.0 | 2.0 | 1456 | $2,800 | $1.92 | 44d | 1 | 0.53mi |
| 215 West Blvd N Columbia, MO | 4.0 | 2.0 | 1456 | $2,800 | $1.92 | 13d | 1 | 0.53mi |
| 215 West Blvd N Columbia, MO | 4.0 | 2.0 | 1456 | $2,800 | $1.92 | 44d | 1 | 0.53mi |
| 203 Wheaton Ct Columbia, MO | 3.0 | 2.0 | 1456 | $2,800 | $1.92 | 44d | 1 | 0.54mi |
| 210 Wheaton Ct Columbia, MO | 3.0 | 2.0 | 1456 | $1,550 | $1.06 | 44d | 1 | 0.54mi |
| 212 Wheaton Ct Columbia, MO | 3.0 | 2.0 | 1456 | $2,800 | $1.92 | 21d | 1 | 0.55mi |
| 205 Wheaton Ct Columbia, MO | 3.0 | 2.0 | 1456 | $2,800 | $1.92 | 13d | 1 | 0.55mi |
| 205 Wheaton Ct Columbia, MO | 3.0 | 2.0 | 1456 | $2,800 | $1.92 | 44d | 1 | 0.55mi |
| 207 Wheaton Ct Columbia, MO | 3.0 | 2.0 | 1456 | $2,800 | $1.92 | 21d | 1 | 0.55mi |
| 319 West Blvd N Columbia, MO | 4.0 | 2.0 | 1456 | $2,800 | $1.92 | 44d | 1 | 0.55mi |
| 1008 Lakeshore Dr Columbia, MO | 3.0 | 1.0 | 1783 | $1,850 | $1.04 | 21d | 1 | 0.56mi |
| 211 Wheaton Ct Columbia, MO | 3.0 | 2.0 | 1456 | $1,550 | $1.06 | 44d | 1 | 0.56mi |
| 215 Wheaton Ct Columbia, MO | 3.0 | 2.0 | 1456 | $1,550 | $1.06 | 44d | 1 | 0.57mi |
| 302 Alexander Ave Columbia, MO | 3.0 | 2.0 | 1296 | $1,350 | $1.04 | 21d | 1 | 0.62mi |
| 409 Sanford Ave Unit 102 Columbia, MO | 4.0 | 3.0 | 1798 | $2,400 | $1.33 | 44d | 1 | 0.66mi |
| 103 N Garth Ave Columbia, MO | 3.0 | 2.0 | 1196 | $2,950 | $2.47 | 21d | 1 | 0.68mi |
| 1207 White Oak Ln Columbia, MO | 5.0 | 2.0 | 1920 | $1,895 | $0.99 | 21d | 1 | 0.84mi |
| 1312 White Oak Ln Columbia, MO | 3.0 | 3.0 | 1512 | $1,725 | $1.14 | 13d | 3 | 0.95mi |
| 1007 Hardin St Columbia, MO | 3.0 | 2.0 | 1554 | $1,625 | $1.05 | 21d | 1 | 1.04mi |
| 1409 Mills Dr Columbia, MO | 3.0 | 1.5 | 1416 | $1,800 | $1.27 | 13d | 1 | 1.10mi |
| 301 W Forest Ave Columbia, MO | 3.0 | 2.0 | 1162 | $1,395 | $1.20 | 13d | 1 | 1.12mi |
| 211 Bourn Ave Columbia, MO | 3.0 | 2.0 | 1119 | $1,995 | $1.78 | 44d | 1 | 1.18mi |
| 1810 Highridge Dr Columbia, MO | 4.0 | 3.0 | 1636 | $2,200 | $1.34 | 21d | 1 | 1.21mi |
| 403 N 9th St Columbia, MO | 3.0 | 2.0 | 1397 | $1,800 | $1.29 | 13d | 1 | 1.34mi |
| 2609 Wee Wynd Columbia, MO | 3.0 | 1.5 | 1600 | $2,500 | $1.56 | 44d | 1 | 1.49mi |
Listing history 10 events
-
2026-04-30price $289,900 477-char remark
Show marketing remark (418 chars)
Located within walking distance to the University of Missouri, this house has many updated by current owenr, including all new windows, new HVAC, remodeled kitchen and baths, and water heater. Enjoy the fenced, oversized back yard from the back patio. Located in highly sought-after school district. Current tenants pay $1500 /mo and lease ends end of 2026, but have agreed to move and break lease with 45 days notice.
-
2026-04-30price $289,900 418-char remark
Show marketing remark (418 chars)
Located within walking distance to the University of Missouri, this house has many updated by current owenr, including all new windows, new HVAC, remodeled kitchen and baths, and water heater. Enjoy the fenced, oversized back yard from the back patio. Located in highly sought-after school district. Current tenants pay $1500 /mo and lease ends end of 2026, but have agreed to move and break lease with 45 days notice.
-
2026-04-12price $296,900 477-char remark
Show marketing remark (418 chars)
Located within walking distance to the University of Missouri, this house has many updated by current owenr, including all new windows, new HVAC, remodeled kitchen and baths, and water heater. Enjoy the fenced, oversized back yard from the back patio. Located in highly sought-after school district. Current tenants pay $1500 /mo and lease ends end of 2026, but have agreed to move and break lease with 45 days notice.
-
2026-04-12price $296,900 418-char remark
Show marketing remark (418 chars)
Located within walking distance to the University of Missouri, this house has many updated by current owenr, including all new windows, new HVAC, remodeled kitchen and baths, and water heater. Enjoy the fenced, oversized back yard from the back patio. Located in highly sought-after school district. Current tenants pay $1500 /mo and lease ends end of 2026, but have agreed to move and break lease with 45 days notice.
-
2026-03-12$298,500 Active 477-char remark
Show marketing remark (418 chars)
Located within walking distance to the University of Missouri, this house has many updated by current owenr, including all new windows, new HVAC, remodeled kitchen and baths, and water heater. Enjoy the fenced, oversized back yard from the back patio. Located in highly sought-after school district. Current tenants pay $1500 /mo and lease ends end of 2026, but have agreed to move and break lease with 45 days notice.
-
2026-03-12$298,500 Active 418-char remark
Show marketing remark (418 chars)
Located within walking distance to the University of Missouri, this house has many updated by current owenr, including all new windows, new HVAC, remodeled kitchen and baths, and water heater. Enjoy the fenced, oversized back yard from the back patio. Located in highly sought-after school district. Current tenants pay $1500 /mo and lease ends end of 2026, but have agreed to move and break lease with 45 days notice.
-
2014-08-26soldstatus
-
2014-08-25soldstatus
-
2014-06-16$157,500
-
2008-09-29soldstatus
ⓘ Source: listings_history table (triggers on properties + properties_extension) + one-shot
backfill from property_details.listing_events for pre-trigger history.
Tax reassessment forecast MO · Resets to sale price
- Current annual tax
- $2,203 · $184/mo
- Projected year-2 tax
- $2,812 · $234/mo
- Expected delta
- +$609/yr (+$51/mo · 27.6%)
ⓘ Screening estimate from a state-policy table — verify with the county assessor before closing.
Climate risk First Street
- Flood 1/10 Low FEMA zone X (unshaded) · 0% chance over 30 yrs
- Wildfire 2/10 Low
- Heat 4/10 Moderate 7 d/yr ≥107°F today · 19 d/yr by 30 yrs out
- Wind 2/10 Low 0% chance of damaging wind over 30 yrs
- Air quality 2/10 Low 1 unhealthy d/yr today · 1 by 30 yrs out
Nearby sold comps map
Loading sold comps map…
Walkable amenities ~0.75 mi
Loading nearby amenities…
Taxation est. · year 1
- Rental income
- $26,792
- − Mortgage interest
- −$16,239
- − Property taxes
- −$2,203
- − Insurance
- −$1,450
- − Repairs & maintenance
- −$2,143
- − Management
- −$2,143
- − Depreciation
- −$8,433
- Taxable loss
- −$5,820
- Est. tax savings @ 24.0%
- +$1,397
- After-tax cash flow
- $667/yr
For passive investors: Depreciation is non-cash, so a rental often shows a tax loss while cash-flowing — sheltering income. Rental losses are passive: they offset passive income freely, and up to $25,000/yr can offset ordinary (W-2) income if you actively participate and your MAGI is under $100k (phasing out to $0 by $150k); unused losses carry forward. On sale, claimed depreciation is recaptured at up to 25%, and gains may owe capital-gains tax (a 1031 exchange can defer both). Figures are a year-1 estimate at your 24.0% rate — not tax advice; consult a CPA.
Schools (NCES district)
- District
- Columbia 93
- NCES district ID
- 2901000
- Math proficiency
- 30% ▼ -12.00%
- Reading proficiency
- 43% ▼ -4.00%
- Median HH income
- $46,547
- Composite
- 31.21/100
- National rank
- #6036
- State rank
- #194 of 324 in MO
Livability — Columbia
- Score
- 83/100
- State rank
- #9
- US rank
- #862
Category grades
Schools grade is shown separately in the Schools card above.
Census & demographics
- Census place
- Columbia, MO
- County
- Boone County · 158,877 people
- City population
- 158,877
- Metro
- Columbia, MO
- Population (ZIP)
- 61,539
- Household income
- $79,960
- Rent vs Own
- Severe rent burden
- 1991.0
Population outlook (Boone County) Hauer SSP2
- Today (2025)
- 202,891 people
- By 2030
- 217,799 · +7.3%
- By 2040
- 246,789 · +21.6%
- By 2050
- 276,116 · +36.1%
- By 2075
- 348,426 · +71.7%
- By 2100
- 400,856 · +97.6%
Race, ethnicity, and origin ACS 2023
- Neighborhood character
- Predominantly White (77%)
- Race & ethnicity
- White 77% Black 9% Asian 6% Two or more races 5% Hispanic / Latino 3%
- Common ancestry
- Italian 3% Slovak 2% Romanian 2%
- Foreign-born
- 7% · China, South Korea, Canada
- Languages at home
- 91% English-only · Chinese 2% Spanish 2% Korean 1%
Political lean MEDSL · Boone
- 2024 margin
- Lean D (+9.8) · D 53.9% · R 44.1% · Other 2.1%
- 2008→2024 swing
- -2.2pp toward R · 2008: 12.0pp · 2024: 9.8pp
- All cycles
- 2024: D+9.8 2020: D+12.5 2016: D+5.9 2012: D+3.1 2008: D+12.0
Not yet ingested
- Civics
- —
Market trends
- HPI YoY
- ▼ -274.18%
- Current HPI
- 194.3615
- Rent YoY
- ▲ 6.09%
- Metro
- Columbia, MO
- State GDP YoY
- ▲ 1.84%
- F500 in state
- 20
Industry mix (Fortune 500 HQ in MO)
| Industry | F500 HQs | Revenue |
|---|---|---|
| Healthcare | 1 | $163B |
|
||
| Insurance | 1 | $21B |
|
||
| Industrial Technology | 1 | $17B |
|
||
| Retail | 1 | $16B |
|
||
| Industrial Distribution | 1 | $10B |
|
||
| Utilities | 1 | $9B |
|
||
Price history
+84.1% since first listed10 events — show timeline
- 2026-04-30 Price Changed $289,900 CBORMLS
- 2026-04-30 Price Changed $289,900 CMBR
- 2026-04-12 Price Changed $296,900 CBORMLS
- 2026-04-12 Price Changed $296,900 CMBR
- 2026-03-12 Listed $298,500 CMBR
- 2026-03-12 Listed $298,500 CBORMLS
- 2014-08-26 Sold (Public Records) — Public Records
- 2014-08-25 Sold (MLS) — CBORMLS
- 2014-06-16 Listed $157,500 CBORMLS
- 2008-09-29 Sold (Public Records) — Public Records
Property tax history
+4.0%/yrLatest (2025): $2,203 · +11.1% YoY. Source: county tax records.
Cash-flow waterfall
monthlySold comps — $/sqft
last 12 mo · ≤1 miLoading sold comps…