23 N Holbrook St · Fort Scott, KS
Flood risk 1/10 · Minimal
- FEMA flood zone
- X (unshaded)
- Chance of flooding over 30 yrs
- 0.0%
- Est. flood insurance / yr
- $507 – $1,088
Fire risk 5/10 · Moderate
- Est. fire insurance / yr
- $1,154 – $2,142
Heat risk 5/10 · Moderate
- Hot days now (above 109°F)
- 7 days/yr
- Hot days in 30 yrs
- 19 days/yr
Wind risk 2/10 · Minimal
- Chance of severe wind over 30 yrs
- 1.0%
Air-quality risk 2/10 · Minimal
- Unhealthy air days now
- 1 days/yr
- Unhealthy air days in 30 yrs
- 1 days/yr
Risk factors via First Street. Map © Google.
Why this score? — see what drove the D grade
The composite is a weighted blend of 9 inputs, each scored 0–100. Each bar is that input's sub-score; the figure is the points it added to the 100-point composite (weight × sub-score).
- Cash flow +15.0/30.0
- ARV discount +7.5/15.0
- 1% rule +5.0/10.0
- DSCR +5.0/10.0
- Livability +3.3/5.0
- Rent growth +2.5/5.0
- Condition / age +2.5/5.0
- Schools +2.0/10.0
- Appreciation +0.0/10.0
$25,000
🖨 Deal sheet 📄 Offer letter ✓ Due diligence
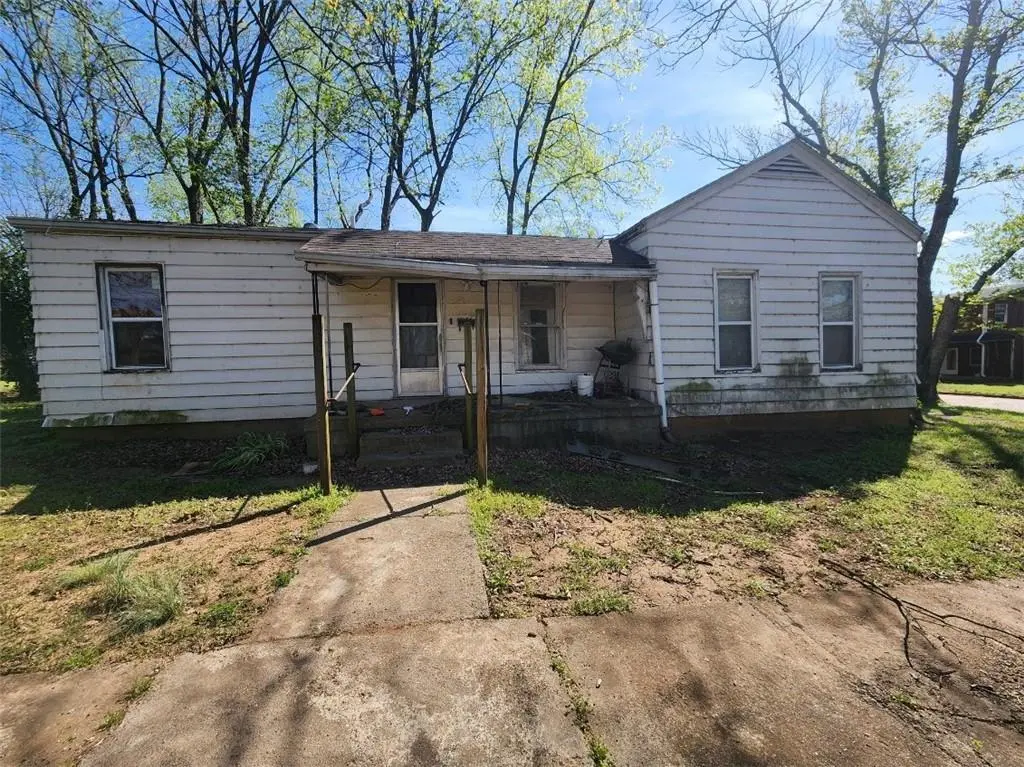
Listing remarks
Welcome to Fort Scott! Investor opportunity! 2/1 with approx. 1,340 sq ft. Vacant and ready for rehab! AS-IS sale. Buyer to verify all information.
Key facts
- 6,098 sq ft lot
- Built 1874
- Listed 10 days
Property features AI
Finance
- Other: Property located at 23 N Holbrook St, Fort Scott, KS
- HOA & community: No association fees; No community maintenance provided
Exterior
- Parking: Off-street parking
- Utilities: Public water; Public sewer
- Home design: Single-family residence; Residential property; Ranch style; Above- and below-grade finished area reported as 1,340 (public records); About 101+ years old
- Construction: Vinyl siding; Composition roof
- Exterior features: Lot approximately 6,098 square feet
Interior
- Bedrooms: 2 bedrooms (both on the first floor)
- Bathrooms: 1 full bathroom (on the first floor); Additional listed bathroom on the first floor
- Heating & cooling: Natural gas heating; Has cooling
- Interior features: Ranch floor plan; Unfinished stone/rock basement
Neighborhood map
What this means for you Summary
Snapshot
- This is a 2-bed/1.0-bath single-family listed at $25k.
Deal economics
- At list price, monthly cash flow is $659 ($8k/yr) — positive.
- The deal already cash-flows at list — no discount required.
- Meets the 1% rule at list price ($1k rent vs $25k).
- Cap rate 37.9% vs local median 4.9% in Fort Scott — top-decile yield for the area; either an underpriced asset or a hidden risk that comps aren't pricing in. Stress-test before assuming the spread holds.
Location & tenants
- Location reads 66/100 on livability (#259 in KS) — a middle-class / working-renter tenant base. Strengths: cost of living A+, health & safety A+, housing A; Watch: schools D, amenities F, commute F.
- Fort Scott (town): math 19% / reading 28% proficiency, ranked #150 of 169 in KS (top 89%) — low school quality limits family demand, transient renter base, plan for 1-2y turnover.
- Market conditions: 70 active listings in the ZIP; 5 units permitted in Bourbon County in 2024 (0 in 5+ unit buildings).
Forward outlook
- Local home prices are declining (-3.0%/yr); year-one equity from $173 of loan paydown is wiped out by about $750 of value loss. Plan a longer hold.
- Bourbon County population projected at -21% by 2050 — secular population decline; favor cash flow + early exit over multi-decade hold.
- At projected returns (-3.0% appreciation + 3.0% rent growth), your $7k cash investment doubles in ~1 year — after that, you're playing with house money.
Negotiation context
- Only 10 days on market — expect competitive offers; lowballing is unlikely to land.
- Current owner paid $12k; list at $25k implies a 108% gain — meaningful room to come down on a strong offer.
Risks & watch-outs
- Watch-outs: property tax is 3.3% of price; built in 1874 — expect roof / HVAC / electrical / plumbing capex.
- Climate carrying-cost: moderate wildfire risk; extreme-heat days projected 7→19/yr by 2055 (HVAC capex compounding) — expect insurance premiums to compound above CPI over the hold.
Questions for the listing agent
- Built in 1874 — when were the roof, HVAC, electrical panel, plumbing, and water heater last replaced?
- Property tax is high relative to price — has the assessment been appealed recently, and will the sale trigger a re-assessment?
- Is there a deadline driving the sale (1031 exchange, divorce, estate, relocation)? That informs how much negotiation room exists.
- Schools are D-rated, which usually means shorter tenancies and higher turnover. Who's the typical renter profile here, and what's been the actual vacancy rate?
- The area grade is low — what's the realistic commute time and amenity access for the typical tenant pool here? Any planned neighborhood developments (good or bad) we should know about?
- What's the average days-on-market for RENTAL listings here right now (not sales)? A rising rental-DOM trend means longer vacancies and softer asking-rent achievability than the comps imply.
- What's the recent tenant-quality profile in this submarket — average credit score on applications, eviction rate, late-payment / NSF rate, and stable-employment percentage? A property-management company in the area should have these aggregated.
- How much new for-sale + rental construction is in the pipeline within 1–3 miles? Heavy new supply typically softens prices + rents 12–24 months out; constrained supply supports both.
Investment metrics
- 1% rule
- 4.40% ✓
- Cap rate
- 37.94%
- Cash-on-cash
- 113.02%
- DSCR
- 6.03
- GRM
- 1.9
CMA / ARV
- ARV (on-the-fly)
- $96,480
- Comps found
- 12
Show comp detail 12 sales within ~0.75 mi
| Address | Dist | Beds/Ba | Sqft | Sold | Price | $/sf | Match |
|---|---|---|---|---|---|---|---|
| 108 N Crawford St | 0.10mi | 2/1.0 | 1,345 (+0%) | 1mo | $60,000 | $45 | 94 |
| 212 S Holbrook St | 0.23mi | 2/1.0 | 1,416 (+6%) | 1mo | $55,000 | $39 | 79 |
| 219 S Lowman St | 0.26mi | 3/1.0 (+1) | 1,363 (+2%) | 15mo | $29,000 | $21 | 67 |
| 109 S Holbrook St | 0.16mi | 2/1.0 | 1,144 (-15%) | 6mo | $39,000 | $34 | 63 |
| 523 S Crawford St | 0.50mi | 3/2.0 (+1) | 1,332 (-1%) | 5mo | $159,900 | $120 | 63 |
| 608 S Lowman St | 0.52mi | 2/1.0 | 1,280 (-4%) | 8mo | $110,000 | $86 | 62 |
| 602 Horton St | 0.52mi | 3/1.0 (+1) | 1,279 (-5%) | 3mo | $130,000 | $102 | 61 |
| 224 S Lowman St | 0.28mi | 3/2.0 (+1) | 1,190 (-11%) | 2mo | $95,000 | $80 | 57 |
| 716 S Osbun St | 0.63mi | 3/2.0 (+1) | 1,385 (+3%) | 7mo | $100,000 | $72 | 50 |
| 416 Burke St | 0.46mi | 3/1.0 (+1) | 1,140 (-15%) | 5mo | $79,000 | $69 | 45 |
| 423 S National St | 0.48mi | 3/2.0 (+1) | 1,480 (+10%) | 11mo | $79,000 | $53 | 42 |
| 616 Short St | 0.68mi | 3/2.0 (+1) | 1,456 (+9%) | 10mo | $145,000 | $100 | 37 |
Match score weights: distance 35% · size 25% · config 20% · recency 20%. Top-matched comps best support the ARV.
Projected returns pro-forma
-3.0% appreciation · 3.0% rent growth · sell at horizon
- IRR
- —
- Equity multiple
- 6.43×
- Total profit
- $37,979
- Equity at exit
- $3,728
- IRR
- —
- Equity multiple
- 13.47×
- Total profit
- $87,300
- Equity at exit
- $2,162
Cash invested: $7,000 (down + closing). Projections, not guarantees.
Landlord ↔ Tenant lean methodology
- Overall (STATE)
- 83 Strongly Landlord-Friendly
- State Kansas
- 83 Strongly Landlord-Friendly · R+10
- County
- — inherits STATE
- City
- — inherits STATE
ZIP-level market 66701
- Home prices YoY
- -10.4%
- Active inventory
- 70
- Price-to-rent
- 1.9×
Monthly cashflow live
- Estimated rent
- $1,099 medium interval (Pro) →
- Mortgage (P&I)
- −$131
- Tax from tax record
- −$68 /mo · $813/yr
- Insurance
- −$10
- HOA
- −$0
- Vacancy / Maint / Mgmt
- −$231
- Net cashflow
- $659
Break-even live
UW: 25.0% down · 7.5% · 30yr · 1.5% tax · 5.0% vac · 8.0% maint · 8.0% mgmt
Financing live
Cash to close
- Down payment
- $6,250
- Closing costs
- $750
- Reserves months
- —
- Total cash needed
- —
Loan-product check · same deal, 3 products live
Conventional
25% down · 7.5% · 30yr
- Down + closing
- —
- Monthly P&I
- —
- Monthly cashflow
- —
- DSCR
- —
- Eligible?
- —
Personal DTI + credit; lowest rate.
DSCR
20% down · 8.5% · 30yr
- Down + closing
- —
- Monthly P&I
- —
- Monthly cashflow
- —
- DSCR
- —
- Eligible?
- —
No personal income docs; deal must DSCR.
Hard money
10% down · 12.0% · 12mo
- Down + closing
- —
- Monthly P&I
- —
- Monthly cashflow
- —
- DSCR
- —
- Eligible?
- —
Short-term bridge; refi at stabilization.
Listing history 4 events
-
2026-05-18$25,000 Active
-
2005-12-01soldstatus $12,000
-
1995-10-01soldstatus $12,000
-
1987-03-01soldstatus $10,000
ⓘ Source: listings_history table (triggers on properties + properties_extension) + one-shot
backfill from property_details.listing_events for pre-trigger history.
Tax reassessment forecast KS · Resets to sale price
- Current annual tax
- $813 · $68/mo
- Projected year-2 tax
- $813 · $68/mo
- Expected delta
- $0/yr ($0/mo · 0.0%)
ⓘ Screening estimate from a state-policy table — verify with the county assessor before closing.
Climate risk First Street
- Flood 1/10 Low FEMA zone X (unshaded) · 0% chance over 30 yrs
- Wildfire 5/10 Major
- Heat 5/10 Major 7 d/yr ≥109°F today · 19 d/yr by 30 yrs out
- Wind 2/10 Low 100% chance of damaging wind over 30 yrs
- Air quality 2/10 Low 1 unhealthy d/yr today · 1 by 30 yrs out
Nearby sold comps map
Loading sold comps map…
Walkable amenities ~0.75 mi
Loading nearby amenities…
Taxation est. · year 1
- Rental income
- $13,193
- − Mortgage interest
- −$1,400
- − Property taxes
- −$813
- − Insurance
- −$125
- − Repairs & maintenance
- −$1,055
- − Management
- −$1,055
- − Depreciation
- −$727
- Taxable income
- $8,017
- Est. tax owed @ 24.0%
- −$1,924
- After-tax cash flow
- $5,988/yr
For passive investors: Depreciation is non-cash, so a rental often shows a tax loss while cash-flowing — sheltering income. Rental losses are passive: they offset passive income freely, and up to $25,000/yr can offset ordinary (W-2) income if you actively participate and your MAGI is under $100k (phasing out to $0 by $150k); unused losses carry forward. On sale, claimed depreciation is recaptured at up to 25%, and gains may owe capital-gains tax (a 1031 exchange can defer both). Figures are a year-1 estimate at your 24.0% rate — not tax advice; consult a CPA.
Schools (NCES district)
- District
- Fort Scott
- NCES district ID
- 2006180
- Math proficiency
- 19% ▼ -3.00%
- Reading proficiency
- 28% ▬ 0.00%
- Median HH income
- $38,034
- Composite
- 19.64/100
- National rank
- #8741
- State rank
- #150 of 169 in KS
Livability — Fort Scott
- Score
- 66/100
- State rank
- #259
- US rank
- #11422
Category grades
Schools grade is shown separately in the Schools card above.
Census & demographics
- Census place
- Fort Scott, KS
- Population (ZIP)
- 11,075
Population outlook (Bourbon County) Hauer SSP2
- Today (2025)
- 13,761 people
- By 2030
- 13,139 · -4.5%
- By 2040
- 11,920 · -13.4%
- By 2050
- 10,892 · -20.8%
- By 2075
- 8,645 · -37.2%
- By 2100
- 6,751 · -50.9%
Race, ethnicity, and origin ACS 2023
- Neighborhood character
- Predominantly White (89%)
- Race & ethnicity
- White 89% Two or more races 5% Hispanic / Latino 3% Black 2%
- Common ancestry
- Lithuanian 2% Serbian 2% Slovak 2%
- Foreign-born
- 1%
- Languages at home
- 97% English-only · Spanish 1% Other Asian/Pacific 1% German/W. Germanic 1%
Political lean MEDSL · Bourbon
- 2024 margin
- Solid R (+54.2) · D 22.0% · R 76.1% · Other 1.9%
- 2008→2024 swing
- -26.9pp toward R · 2008: -27.2pp · 2024: -54.2pp
- All cycles
- 2024: R+54.2 2020: R+52.0 2016: R+50.8 2012: R+33.9 2008: R+27.2
Not yet ingested
- Civics
- —
Market trends
- HPI YoY
- ▼ -20.03%
- Current HPI
- 172.2531
- Rent YoY
- —
- Metro
- —
- State GDP YoY
- —
- F500 in state
- 0
Price history
+150.0% since first listed4 events — show timeline
- 2026-05-18 Listed $25,000 Heartland MLS as Distributed by MLS Grid
- 2005-12-01 Sold (Public Records) $12,000 Public Records
- 1995-10-01 Sold (Public Records) $12,000 Public Records
- 1987-03-01 Sold (Public Records) $10,000 Public Records
Property tax history
+9.0%/yrLatest (2025): $813 · +172.2% YoY. Source: county tax records.
Cash-flow waterfall
monthlySold comps — $/sqft
last 12 mo · ≤1 miLoading sold comps…