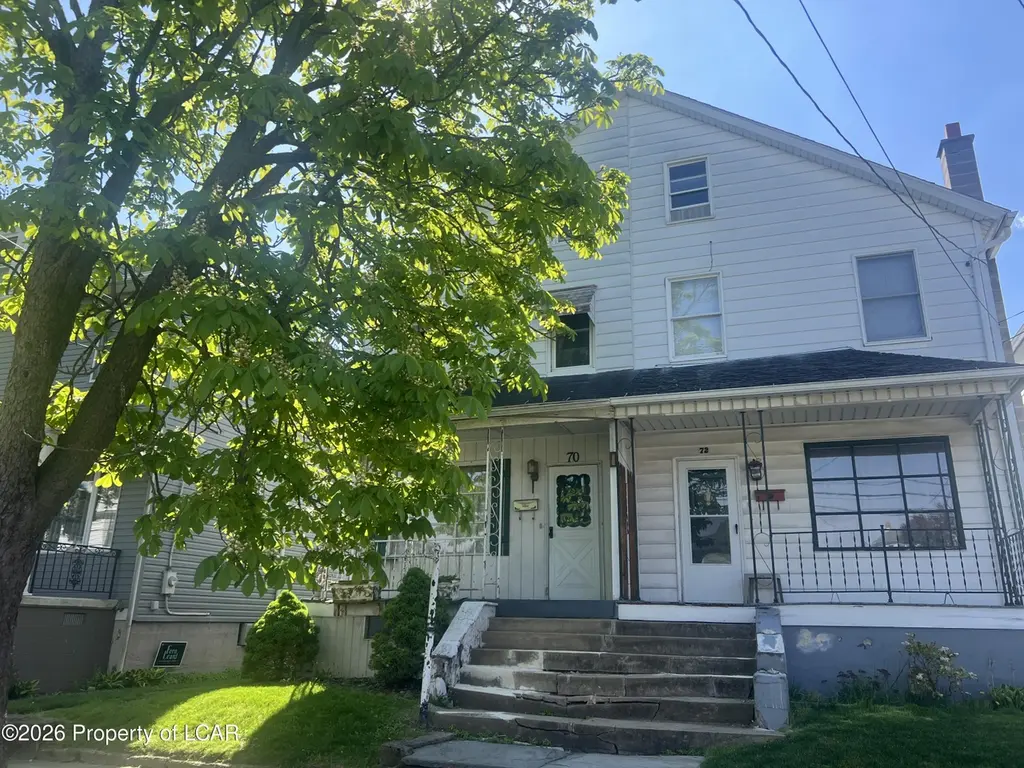
70 Welles Ave · Kingston, PA
Flood risk 7/10 · Major
- FEMA flood zone
- X
- Chance of flooding over 30 yrs
- 0.77%
- Est. flood insurance / yr
- $507 – $1,088
Fire risk 3/10 · Minor
- Est. fire insurance / yr
- $511 – $949
Heat risk 4/10 · Minor
- Hot days now (above 95°F)
- 7 days/yr
- Hot days in 30 yrs
- 16 days/yr
Wind risk 3/10 · Minor
- Chance of severe wind over 30 yrs
- 5.0%
Air-quality risk 3/10 · Minor
- Unhealthy air days now
- 2 days/yr
- Unhealthy air days in 30 yrs
- 4 days/yr
Risk factors via First Street. Map © Google.
Why this score? — see what drove the C grade
The composite is a weighted blend of 9 inputs, each scored 0–100. Each bar is that input's sub-score; the figure is the points it added to the 100-point composite (weight × sub-score).
- Cash flow +18.7/30.0
- ARV discount +15.0/15.0
- DSCR +5.9/10.0
- 1% rule +5.0/10.0
- Livability +4.0/5.0
- Rent growth +3.7/5.0
- Schools +2.5/10.0
- Condition / age +2.5/5.0
- Appreciation +0.0/10.0
$155,000
🖨 Deal sheet 📄 Offer letter ✓ Due diligence
Listing remarks MLS
cozy 2 bedroom with hard wood floors and nice fenced in yard. this property is sold as is.
Key facts
- 2,200 sq ft lot
- Listed 12 days
Property features AI
Exterior
- Utilities: Public water; Public sewer
- Home design: Single family residence; Two levels
- Construction: Aluminum siding; Wood siding
- Exterior features: Lot is cleared
Interior
- Bathrooms: One three-quarter bathroom; One half bathroom
- Heating & cooling: Natural gas heating; Steam heating; Has heating
- Interior features: Full unfinished basement; Eight total rooms
Neighborhood map
What this means for you Summary
Snapshot
- This is a 3-bed/1.5-bath single-family listed at $155k.
Deal economics
- At list price, monthly cash flow is $87 ($1k/yr) — positive.
- The deal already cash-flows at list — no discount required.
- To meet the 1% rule (rent ≥ 1% of price), the offer needs to be $154k (0.3% below list).
- Recommended offer: $154k (0.3% below list) — sets the bar for 1% rule.
- Cap rate 7.5% vs local median 5.0% in Kingston — top-decile yield for the area; either an underpriced asset or a hidden risk that comps aren't pricing in. Stress-test before assuming the spread holds.
Location & tenants
- Location reads 81/100 on livability (#162 in PA, #1,345 nationally) — a professional / high-income tenant draw. Strengths: cost of living A+, health & safety A+, housing A; Watch: employment D, commute F.
- Wyoming Valley West SD (suburban): math 18% / reading 42% proficiency, ranked #445 of 539 in PA (top 83%) — families likely to look elsewhere, expect single-tenant / working-renter base with shorter leases.
- Market conditions: Rents rising fast (+4.7%/yr); 132 active listings in the ZIP; 40 comparable units currently listed for rent nearby; rentals at typical pace (median 21d on market — plan ~3-4 weeks tenant-placement turnaround); 349 units permitted in Luzerne County in 2024 (16 in 5+ unit buildings).
Forward outlook
- Local home prices are declining (-3.0%/yr); year-one equity from $1k of loan paydown is wiped out by about $5k of value loss. Plan a longer hold.
- Luzerne County population projected at +4% by 2050 — modest demand growth; plan on rents tracking national, not racing it.
Negotiation context
- Only 12 days on market — expect competitive offers; lowballing is unlikely to land.
- 2 sale attempts since 6y ago with the ask held roughly flat each time — persistent listings suggest the price (not the market) is what's stuck; bring a comps-based counter.
- Current owner paid $63k; list at $155k implies a 146% gain — meaningful room to come down on a strong offer.
Risks & watch-outs
- Watch-outs: flood insurance adds $66/mo; built in 1925 — expect roof / HVAC / electrical / plumbing capex.
- Climate carrying-cost: major flood risk — expect insurance premiums to compound above CPI over the hold.
Questions for the listing agent
- Built in 1925 — when were the roof, HVAC, electrical panel, plumbing, and water heater last replaced?
- What's the actual annual flood-insurance premium (NFIP or private), and is the property in a SFHA with mandatory coverage?
- Is there a deadline driving the sale (1031 exchange, divorce, estate, relocation)? That informs how much negotiation room exists.
- What's the average days-on-market for RENTAL listings here right now (not sales)? A rising rental-DOM trend means longer vacancies and softer asking-rent achievability than the comps imply.
- What's the recent tenant-quality profile in this submarket — average credit score on applications, eviction rate, late-payment / NSF rate, and stable-employment percentage? A property-management company in the area should have these aggregated.
- How much new for-sale + rental construction is in the pipeline within 1–3 miles? Heavy new supply typically softens prices + rents 12–24 months out; constrained supply supports both.
Investment metrics
- 1% rule
- 1.00% ✗
- Cap rate
- 7.48%
- Cash-on-cash
- 4.23%
- DSCR
- 1.19
- GRM
- 8.4
CMA / ARV
- ARV (median comp)
- $205,002
- List price
- $155,000
- Delta
- -24.39%
- Verdict
- UNDERPRICED
- Comps
- 20 within 1.0 mi
Show comp detail 9 sales within ~0.75 mi
| Address | Dist | Beds/Ba | Sqft | Sold | Price | $/sf | Match |
|---|---|---|---|---|---|---|---|
| 77 Goodwin Ave | 0.25mi | 3/1.0 | 1,152 (+1%) | 9mo | $150,000 | $130 | 77 |
| 52 Welles Ave | 0.01mi | 3/1.0 | 1,216 (+6%) | 19mo | $165,000 | $136 | 71 |
| 121 Gates Ave | 0.20mi | 3/1.5 | 1,300 (+14%) | 2mo | $185,000 | $142 | 66 |
| 76 Loveland Ave | 0.12mi | 2/1.0 (-1) | 1,250 (+9%) | 12mo | $190,000 | $152 | 62 |
| 230 Wright Ave | 0.27mi | 2/1.0 (-1) | 1,260 (+10%) | 6mo | $147,500 | $117 | 58 |
| 214 Spruce St | 0.70mi | 3/1.0 | 1,140 (-0%) | 8mo | $190,000 | $167 | 58 |
| 123 N Thomas Ave | 0.17mi | 3/1.0 | 1,277 (+12%) | 22mo | $200,000 | $157 | 53 |
| 88 Goodwin Ave | 0.27mi | 2/1.0 (-1) | 1,312 (+15%) | 7mo | $187,000 | $143 | 50 |
| 903 Market St | 0.68mi | 3/1.0 | 1,296 (+13%) | 24mo | $115,000 | $89 | 25 |
Match score weights: distance 35% · size 25% · config 20% · recency 20%. Top-matched comps best support the ARV.
Projected returns pro-forma
-3.0% appreciation · 4.65% rent growth · sell at horizon
- IRR
- -10.5%
- Equity multiple
- 0.61×
- Total profit
- $-16,937
- Equity at exit
- $23,111
- IRR
- 1.1%
- Equity multiple
- 1.08×
- Total profit
- $3,662
- Equity at exit
- $13,402
Cash invested: $43,400 (down + closing). Projections, not guarantees.
Landlord ↔ Tenant lean methodology
- Overall (STATE)
- 62 Landlord-Friendly
- State Pennsylvania
- 62 Landlord-Friendly · EVEN
- County
- — inherits STATE
- City
- — inherits STATE
ZIP-level market 18704
- Rents YoY
- 4.7%
- Active inventory
- 132
- Price-to-rent
- 8.4×
Monthly cashflow live
- Estimated rent
- $1,545 high interval (Pro) →
- Mortgage (P&I)
- −$813
- Tax from tax record
- −$190 /mo · $2,280/yr
- Insurance
- −$65
- Flood insurance flood zone
- −$66 /mo · $798/yr
- HOA
- −$0
- Vacancy / Maint / Mgmt
- −$324
- Net cashflow
- $87
Break-even live
UW: 25.0% down · 7.5% · 30yr · 1.5% tax · 5.0% vac · 8.0% maint · 8.0% mgmt
Financing live
Cash to close
- Down payment
- $38,750
- Closing costs
- $4,650
- Reserves months
- —
- Total cash needed
- —
Loan-product check · same deal, 3 products live
Conventional
25% down · 7.5% · 30yr
- Down + closing
- —
- Monthly P&I
- —
- Monthly cashflow
- —
- DSCR
- —
- Eligible?
- —
Personal DTI + credit; lowest rate.
DSCR
20% down · 8.5% · 30yr
- Down + closing
- —
- Monthly P&I
- —
- Monthly cashflow
- —
- DSCR
- —
- Eligible?
- —
No personal income docs; deal must DSCR.
Hard money
10% down · 12.0% · 12mo
- Down + closing
- —
- Monthly P&I
- —
- Monthly cashflow
- —
- DSCR
- —
- Eligible?
- —
Short-term bridge; refi at stabilization.
Rent comps 40 comps
| Address | Beds | Baths | Sqft | Rent | $/sqft | DOM | Units | Dist |
|---|---|---|---|---|---|---|---|---|
| 20 N Loveland Ave Kingston, PA | 3.0 | 2.0 | 1400 | $1,775 | $1.27 | 13d | 1 | 0.09mi |
| 27 S Gates Ave Kingston, PA | 3.0 | 2.0 | 1200 | $1,750 | $1.46 | 21d | 1 | 0.18mi |
| 300 Market St Ste 104 Kingston, PA | 2.0 | 2.0 | 873 | $1,950 | $2.23 | 13d | 1 | 0.26mi |
| 73 2nd Ave Kingston, PA | 2.0 | 1.0 | 1200 | $950 | $0.79 | 21d | 1 | 0.31mi |
| 238 Rutter Ave Kingston, PA | 2.0 | 1.0 | 1200 | $1,050 | $0.88 | 43d | 1 | 0.32mi |
| 266 Rutter Ave Unit 2 Kingston, PA | 2.0 | 1.0 | 875 | $1,270 | $1.45 | 43d | 1 | 0.33mi |
| 313 Rutter Ave Kingston, PA | 2.0 | 1.0 | 727 | $1,450 | $1.99 | 43d | 1 | 0.33mi |
| 115 1st Ave Unit 115 Kingston, PA | 3.0 | 1.0 | 1200 | $1,495 | $1.25 | 13d | 1 | 0.39mi |
| 200 Gateway Dr Kingston, PA | 1.0–3.0 | 1.0–2.0 | 1130 | $3,219 | $2.85 | 13d | 1 | 0.42mi |
| 40 N Dawes Ave Kingston, PA | 3.0 | 1.5 | 1450 | $1,800 | $1.24 | 21d | 1 | 0.43mi |
| 41 Main St Kingston, PA | 3.0 | 1.0 | 1350 | $1,400 | $1.04 | 21d | 1 | 0.44mi |
| 400 N Gates Ave Unit 1 Kingston, PA | 2.0 | 2.0 | 1198 | $1,300 | $1.09 | 43d | 1 | 0.44mi |
| 100 Parkway Blvd Kingston, PA | 2.0 | 1.0 | 650 | $1,400 | $2.15 | 13d | 1 | 0.53mi |
| 47 Price St Apt 2 Kingston, PA | 2.0 | 1.0 | 1200 | $1,200 | $1.00 | 43d | 1 | 0.76mi |
| 9-10 Meyers Ct Kingston, PA | 3.0 | 1.0 | 1250 | $1,500 | $1.20 | 21d | 1 | 0.77mi |
| 59 Price St Unit 2 Kingston, PA | 3.0 | 1.0 | 1000 | $1,100 | $1.10 | 43d | 1 | 0.78mi |
| 19 N River St Unit 308 Wilkes-Barre, PA | 2.0 | 1.5 | 910 | $1,600 | $1.76 | 13d | 1 | 0.81mi |
| 19 N River St Unit 403 Wilkes-Barre, PA | 2.0 | 1.0 | 723 | $1,600 | $2.21 | 13d | 1 | 0.81mi |
| 38 W Market St Unit 3 Wilkes-Barre, PA | 2.0 | 1.0 | 1388 | $1,295 | $0.93 | 13d | 1 | 0.86mi |
| 98 N Franklin St Unit 2 Wilkes-Barre, PA | 2.0 | 2.0 | 1254 | $1,650 | $1.32 | 13d | 1 | 0.88mi |
| 206 Zerby Ave Edwardsville, PA | 2.0 | 1.0 | 741 | $1,200 | $1.62 | 13d | 1 | 0.89mi |
| 27 Penn St Kingston, PA | 3.0 | 1.5 | 1225 | $1,550 | $1.27 | 21d | 1 | 0.93mi |
| 104 Meyers St Kingston, PA | 3.0 | 1.0 | 1200 | $1,495 | $1.25 | 43d | 1 | 0.93mi |
| 27 1/2 Penn St Kingston, PA | 3.0 | 1.0 | 1200 | $1,400 | $1.17 | 43d | 1 | 0.94mi |
| 41 Pulaski St Kingston, PA | 3.0 | 1.5 | 1292 | $1,450 | $1.12 | 21d | 1 | 0.95mi |
| 36 Pulaski St Kingston, PA | 3.0 | 2.0 | 1432 | $1,600 | $1.12 | 13d | 1 | 0.95mi |
| 150 S Franklin St Wilkes Barre, PA | 2.0 | 1.0 | 850 | $1,750 | $2.06 | 43d | 1 | 0.97mi |
| 570 Main St Edwardsville, PA | 2.0 | 1.0 | 1100 | $1,180 | $1.07 | 43d | 1 | 0.98mi |
| 159 New Mallery Pl Unit 2 Wilkes-Barre, PA | 2.0 | 1.0 | 1020 | $950 | $0.93 | 43d | 1 | 0.99mi |
| 26 Stanley St Wilkes Barre, PA | 2.0 | 1.0 | 950 | $1,650 | $1.74 | 43d | 1 | 0.99mi |
| 224 New Mallery Pl Wilkes Barre, PA | 2.0 | 1.0 | 850 | $1,000 | $1.18 | 13d | 1 | 1.00mi |
| 157 E Walnut St Kingston, PA | 2.0 | 1.0 | 900 | $1,000 | $1.11 | 13d | 1 | 1.01mi |
| 151 E Walnut St Kingston, PA | 2.0 | 1.0 | 900 | $1,000 | $1.11 | 13d | 1 | 1.02mi |
| 67-69 Public Sq Wilkes-Barre, PA | 2.0 | 1.0 | 910 | $1,875 | $2.06 | 43d | 1 | 1.03mi |
| 67-69 Public Sq #1203 Wilkes Barre, PA | 2.0 | 1.0 | 875 | $1,825 | $2.09 | 43d | 1 | 1.03mi |
| 155 W River St Wilkes Barre, PA | 3.0 | 2.0 | 1100 | $1,425 | $1.30 | 43d | 1 | 1.04mi |
| 98 E Walnut St Kingston, PA | 3.0 | 1.0 | 1280 | $1,500 | $1.17 | 21d | 1 | 1.08mi |
| 11 Holiday Dr Kingston, PA | 1.0–3.0 | 1.0–2.5 | 1083 | $2,639 | $2.44 | 13d | 14 | 1.09mi |
| 182 Roosevelt St Kingston, PA | 2.0 | 1.0 | 1152 | $1,625 | $1.41 | 13d | 1 | 1.09mi |
| 109 Penn St Unit 1 Kingston, PA | 3.0 | 1.0 | 1200 | $1,400 | $1.17 | 13d | 1 | 1.11mi |
Listing history 3 events
-
2026-05-07$155,000 Active 195-char remark
-
2020-07-24soldstatus $63,000 90-char remark
Show marketing remark (90 chars)
cozy 2 bedroom with hard wood floors and nice fenced in yard. this property is sold as is.
-
2020-04-27$67,600 90-char remark
Show marketing remark (90 chars)
cozy 2 bedroom with hard wood floors and nice fenced in yard. this property is sold as is.
ⓘ Source: listings_history table (triggers on properties + properties_extension) + one-shot
backfill from property_details.listing_events for pre-trigger history.
Tax reassessment forecast PA · Partial reset (capped growth)
- Current annual tax
- $2,280 · $190/mo
- Projected year-2 tax
- $2,364 · $197/mo
- Expected delta
- +$85/yr (+$7/mo · 3.7%)
ⓘ Screening estimate from a state-policy table — verify with the county assessor before closing.
Climate risk First Street
- Flood 7/10 Severe FEMA zone X · 77% chance over 30 yrs
- Wildfire 3/10 Moderate
- Heat 4/10 Moderate 7 d/yr ≥95°F today · 16 d/yr by 30 yrs out
- Wind 3/10 Moderate 5% chance of damaging wind over 30 yrs
- Air quality 3/10 Moderate 2 unhealthy d/yr today · 4 by 30 yrs out
Nearby sold comps map
Loading sold comps map…
Walkable amenities ~0.75 mi
Loading nearby amenities…
Taxation est. · year 1
- Rental income
- $18,538
- − Mortgage interest
- −$8,682
- − Property taxes
- −$2,280
- − Insurance
- −$1,572
- − Repairs & maintenance
- −$1,483
- − Management
- −$1,483
- − Depreciation
- −$4,509
- Taxable loss
- −$1,472
- Est. tax savings @ 24.0%
- +$353
- After-tax cash flow
- $1,392/yr
For passive investors: Depreciation is non-cash, so a rental often shows a tax loss while cash-flowing — sheltering income. Rental losses are passive: they offset passive income freely, and up to $25,000/yr can offset ordinary (W-2) income if you actively participate and your MAGI is under $100k (phasing out to $0 by $150k); unused losses carry forward. On sale, claimed depreciation is recaptured at up to 25%, and gains may owe capital-gains tax (a 1031 exchange can defer both). Figures are a year-1 estimate at your 24.0% rate — not tax advice; consult a CPA.
Schools (NCES district)
- District
- Wyoming Valley West SD
- NCES district ID
- 4225950
- Math proficiency
- 18% ▼ -11.00%
- Reading proficiency
- 42% ▼ -12.00%
- Median HH income
- $42,437
- Composite
- 25.38/100
- National rank
- #7470
- State rank
- #445 of 539 in PA
Livability — Kingston
- Score
- 81/100
- State rank
- #162
- US rank
- #1345
Category grades
Schools grade is shown separately in the Schools card above.
Census & demographics
- Census place
- Kingston, PA
- County
- Luzerne County · 118,885 people
- City population
- 31,149
- Metro
- Scranton--Wilkes-Barre, PA
- Population (ZIP)
- 31,149
- Household income
- $64,444
- Rent vs Own
- Severe rent burden
- 1454.0
Population outlook (Luzerne County) Hauer SSP2
- Today (2025)
- 319,505 people
- By 2030
- 319,943 · +0.1%
- By 2040
- 322,643 · +1.0%
- By 2050
- 330,817 · +3.5%
- By 2075
- 379,145 · +18.7%
- By 2100
- 431,908 · +35.2%
Race, ethnicity, and origin ACS 2023
- Neighborhood character
- Predominantly White (82%)
- Race & ethnicity
- White 82% Hispanic / Latino 8% Black 6% Two or more races 6%
- Hispanic origin (detail)
- Mexican 1% Puerto Rican 4% Dominican 1%
- Common ancestry
- Romanian 18% Scotch-Irish 4% Italian 2%
- Foreign-born
- 3% · Canada
- Languages at home
- 93% English-only · Spanish 4% Russian/Polish/Slavic 1%
Political lean MEDSL · Luzerne
- 2024 margin
- R (+19.2) · D 40.0% · R 59.2%
- 2008→2024 swing
- -27.6pp toward R · 2008: 8.4pp · 2024: -19.2pp
- All cycles
- 2024: R+19.2 2020: R+14.4 2016: R+19.6 2012: D+4.8 2008: D+8.4
Not yet ingested
- Civics
- —
Market trends
- HPI YoY
- ▼ -154.72%
- Current HPI
- 255.5375
- Rent YoY
- ▲ 4.65%
- Metro
- Scranton--Wilkes-Barre, PA
- State GDP YoY
- ▲ 1.68%
- F500 in state
- 34
Industry mix (Fortune 500 HQ in PA)
| Industry | F500 HQs | Revenue |
|---|---|---|
| Healthcare | 2 | $309B |
|
||
| Insurance | 2 | $27B |
|
||
| Telecommunications / Media | 1 | $124B |
|
||
| Industrial Distribution | 1 | $22B |
|
||
| Financial Services | 1 | $20B |
|
||
| Chemicals / Materials | 1 | $18B |
|
||
Price history
+129.3% since first listed4 events — show timeline
- 2026-05-19 Pending — LCAR
- 2026-05-07 Listed $155,000 LCAR
- 2020-07-24 Sold (MLS) $63,000 LCAR
- 2020-04-27 Listed $67,600 LCAR
Property tax history
+1.8%/yrLatest (2026): $2,280 · +0.4% YoY. Source: county tax records.
Cash-flow waterfall
monthlySold comps — $/sqft
last 12 mo · ≤1 miLoading sold comps…