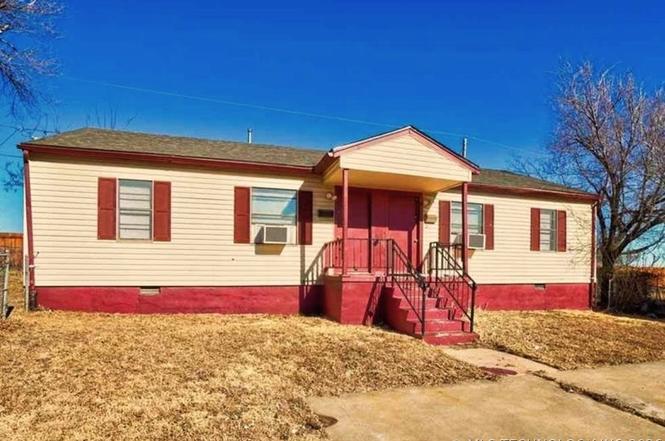
1183 NW Ozmun Ave · Lawton, OK
Flood risk 1/10 · Minimal
- FEMA flood zone
- X (unshaded)
- Chance of flooding over 30 yrs
- 0.0%
- Est. flood insurance / yr
- $507 – $1,088
Fire risk 6/10 · Moderate
- Est. fire insurance / yr
- $2,463 – $4,575
Heat risk 6/10 · Moderate
- Hot days now (above 108°F)
- 7 days/yr
- Hot days in 30 yrs
- 19 days/yr
Wind risk 2/10 · Minimal
- Chance of severe wind over 30 yrs
- 4.0%
Air-quality risk 1/10 · Minimal
- Unhealthy air days now
- 0 days/yr
- Unhealthy air days in 30 yrs
- 0 days/yr
Risk factors via First Street. Map © Google.
Why this score? — see what drove the B grade
The composite is a weighted blend of 9 inputs, each scored 0–100. Each bar is that input's sub-score; the figure is the points it added to the 100-point composite (weight × sub-score).
- Cash flow +28.0/30.0
- ARV discount +15.0/15.0
- DSCR +9.9/10.0
- 1% rule +7.7/10.0
- Livability +3.2/5.0
- Rent growth +2.6/5.0
- Condition / age +2.5/5.0
- Schools +2.0/10.0
- Appreciation +0.0/10.0
$85,000
🖨 Deal sheet 📄 Offer letter ✓ Due diligence
Listing remarks
Duplex in Lawton, Oklahoma. This duplex presents a fantastic opportunity for investors. Each unit features two bedrooms and one bathroom, a spacious living room with a ceiling fan, and vinyl flooring throughout! A generously sized kitchen with an eat-in area, plus a separate utility room. Includes a fenced backyard, offering a private outdoor space. While the property could benefit from some TLC to bring it up to its full potential, remodeling happened a few years back, the bones are solid, and the opportunity is there. Enjoy a prime location just minutes from Fort Sill and I-44, with easy access to shopping and dining. This duplex presents a great chance to add to your real estate portfol
Key facts
- Fenced backyard
- Spacious living room
- Built 1952
Tags
Property features AI
Exterior
- Parking: Driveway parking
- Security: Smoke detector(s); No safety shelter
- Utilities: Electricity available; Natural gas available; Public water; Public sewer
- Home design: Single-story home; Faces south; Crawlspace foundation
- Construction: Vinyl siding with wood frame construction; Asphalt/fiberglass roof; Built per public records
- Exterior features: Enclosed porch; Porch; Concrete driveway; Full chain-link fencing
Interior
- Kitchen: Eat-in kitchen; Oven; Range; Stove; Refrigerator
- Bedrooms: Two first-floor bedrooms (no attached baths)
- Flooring: Vinyl flooring
- Bathrooms: 2 full bathrooms
- Heating & cooling: Window unit(s) for cooling
- Interior features: Ceiling fan(s); Laminate counters; Electric range connection; Other interior features noted
- Laundry & utility: Utility room (inside, separate, first floor); Washer hookup; Electric dryer hookup; Gas water heater
Neighborhood map
What this means for you Summary
Snapshot
- This is a 2-bed/1.0-bath single-family listed at $85k.
Deal economics
- At list price, monthly cash flow is $263 ($3k/yr) — positive.
- The deal already cash-flows at list — no discount required.
- Meets the 1% rule at list price ($1k rent vs $85k).
- Recommended offer: $77k (9.0% below list) — sets the bar for market timing.
- Cap rate 10.0% vs local median 6.1% in Lawton — top-decile yield for the area; either an underpriced asset or a hidden risk that comps aren't pricing in. Stress-test before assuming the spread holds.
Location & tenants
- Location reads 63/100 on livability (#206 in OK) — a middle-class / working-renter tenant base. Strengths: cost of living A+, housing A+; Watch: employment D, schools D-, crime F.
- Lawton (urban): math 20% / reading 26% proficiency, ranked #137 of 270 in OK (top 51%) — low school quality limits family demand, transient renter base, plan for 1-2y turnover.
- Market conditions: Rents flat; 208 active listings in the ZIP; 133 units permitted in Comanche County in 2024 (0 in 5+ unit buildings).
Forward outlook
- Local home prices are declining (-3.0%/yr); year-one equity from $588 of loan paydown is wiped out by about $3k of value loss. Plan a longer hold.
- Comanche County population projected to shrink 3% by 2050 — rents likely to lag national; underwrite the cash flow, not the appreciation.
Negotiation context
- It's been on market 116 days — a 9% lower offer ($77k) is reasonable based on typical stale-listing flexibility.
- 6 sale attempts since 4y ago with the ask held roughly flat each time — persistent listings suggest the price (not the market) is what's stuck; bring a comps-based counter.
Risks & watch-outs
- Watch-outs: built in 1952 — expect roof / HVAC / electrical / plumbing capex.
- Climate carrying-cost: major wildfire risk; extreme-heat days projected 7→19/yr by 2055 (HVAC capex compounding) — expect insurance premiums to compound above CPI over the hold.
Questions for the listing agent
- It's been on market 116 days. Have you received any prior offers? Is the seller open to a 9% concession, seller financing, or rate buy-down credit?
- Built in 1952 — when were the roof, HVAC, electrical panel, plumbing, and water heater last replaced?
- Why hasn't it sold? Are there any deal-killer items the seller is aware of (foundation, flood, title, zoning, code violations)?
- Is there a deadline driving the sale (1031 exchange, divorce, estate, relocation)? That informs how much negotiation room exists.
- Schools are D-rated, which usually means shorter tenancies and higher turnover. Who's the typical renter profile here, and what's been the actual vacancy rate?
- Crime grade is F in this area — have there been break-ins, vandalism, or insurance claims at this property in the last 3 years? What carrier currently insures it and at what premium?
- What's the average days-on-market for RENTAL listings here right now (not sales)? A rising rental-DOM trend means longer vacancies and softer asking-rent achievability than the comps imply.
- What's the recent tenant-quality profile in this submarket — average credit score on applications, eviction rate, late-payment / NSF rate, and stable-employment percentage? A property-management company in the area should have these aggregated.
- How much new for-sale + rental construction is in the pipeline within 1–3 miles? Heavy new supply typically softens prices + rents 12–24 months out; constrained supply supports both.
Investment metrics
- 1% rule
- 1.27% ✓
- Cap rate
- 10.01%
- Cash-on-cash
- 13.27%
- DSCR
- 1.59
- GRM
- 6.6
CMA / ARV
- ARV (on-the-fly)
- $111,958
- Comps found
- 12
Show comp detail 12 sales within ~0.75 mi
| Address | Dist | Beds/Ba | Sqft | Sold | Price | $/sf | Match |
|---|---|---|---|---|---|---|---|
| 1231 NW Logan Ave | 0.19mi | 3/1.5 (+1) | 1,400 (-4%) | 9mo | $55,000 | $39 | 71 |
| 2708 NW 17th St | 0.40mi | 3/1.0 (+1) | 1,500 (+3%) | 13mo | $96,000 | $64 | 60 |
| 2914 NW Prentice Ave | 0.31mi | 3/1.0 (+1) | 1,344 (-8%) | 11mo | $59,000 | $44 | 59 |
| 918 NW Runyon | 0.32mi | 2/2.0 | 1,514 (+4%) | 20mo | $134,900 | $89 | 57 |
| 1219 NW Logan Ave | 0.20mi | 3/1.0 (+1) | 1,300 (-11%) | 20mo | $57,500 | $44 | 51 |
| 1421 NW Logan Ave | 0.25mi | 3/2.0 (+1) | 1,300 (-11%) | 14mo | $99,999 | $77 | 50 |
| 830 NW Hilltop Dr | 0.54mi | 3/2.0 (+1) | 1,600 (+10%) | 3mo | $209,000 | $131 | 46 |
| 1412 NW Bessie Ave | 0.34mi | 3/1.5 (+1) | 1,300 (-11%) | 18mo | $75,000 | $58 | 45 |
| 826 NW Hilltop Dr | 0.57mi | 3/2.0 (+1) | 1,600 (+10%) | 4mo | $225,000 | $141 | 44 |
| 832 NW Hilltop Dr | 0.53mi | 3/2.0 (+1) | 1,600 (+10%) | 8mo | $220,000 | $138 | 43 |
| 1602 NW Taft Ave | 0.63mi | 3/1.0 (+1) | 1,300 (-11%) | 7mo | $40,000 | $31 | 42 |
| 824 NW Hilltop Dr | 0.58mi | 3/2.0 (+1) | 1,634 (+12%) | 9mo | $230,000 | $141 | 36 |
Match score weights: distance 35% · size 25% · config 20% · recency 20%. Top-matched comps best support the ARV.
Projected returns pro-forma
-3.0% appreciation · 0.25% rent growth · sell at horizon
- IRR
- 0.1%
- Equity multiple
- 1.00×
- Total profit
- $111
- Equity at exit
- $12,674
- IRR
- 6.7%
- Equity multiple
- 1.44×
- Total profit
- $10,494
- Equity at exit
- $7,349
Cash invested: $23,800 (down + closing). Projections, not guarantees.
Landlord ↔ Tenant lean methodology
- Overall (STATE)
- 83 Strongly Landlord-Friendly
- State Oklahoma
- 83 Strongly Landlord-Friendly · R+20
- County
- — inherits STATE
- City
- — inherits STATE
ZIP-level market 73507
- Home prices YoY
- -23.2%
- Rents YoY
- 0.2%
- Active inventory
- 208
- Price-to-rent
- 6.6×
Monthly cashflow live
- Estimated rent
- $1,076 medium interval (Pro) →
- Mortgage (P&I)
- −$446
- Tax from tax record
- −$106 /mo · $1,271/yr
- Insurance
- −$35
- HOA
- −$0
- Vacancy / Maint / Mgmt
- −$226
- Net cashflow
- $263
Break-even live
UW: 25.0% down · 7.5% · 30yr · 1.5% tax · 5.0% vac · 8.0% maint · 8.0% mgmt
Financing live
Cash to close
- Down payment
- $21,250
- Closing costs
- $2,550
- Reserves months
- —
- Total cash needed
- —
Loan-product check · same deal, 3 products live
Conventional
25% down · 7.5% · 30yr
- Down + closing
- —
- Monthly P&I
- —
- Monthly cashflow
- —
- DSCR
- —
- Eligible?
- —
Personal DTI + credit; lowest rate.
DSCR
20% down · 8.5% · 30yr
- Down + closing
- —
- Monthly P&I
- —
- Monthly cashflow
- —
- DSCR
- —
- Eligible?
- —
No personal income docs; deal must DSCR.
Hard money
10% down · 12.0% · 12mo
- Down + closing
- —
- Monthly P&I
- —
- Monthly cashflow
- —
- DSCR
- —
- Eligible?
- —
Short-term bridge; refi at stabilization.
Listing history 33 events
-
2026-06-19days on market $85,000 Active 116 DOM
-
2026-06-18days on market $85,000 Active 115 DOM
-
2026-06-17days on market $85,000 Active 114 DOM
-
2026-06-16days on market $85,000 Active 113 DOM
-
2026-06-15days on market $85,000 Active 112 DOM
-
2026-06-14days on market $85,000 Active 110 DOM
-
2026-06-13days on market $85,000 Active 109 DOM
-
2026-06-10days on market $85,000 Active 107 DOM
-
2026-06-09days on market $85,000 Active 106 DOM
-
2026-06-08days on market $85,000 Active 105 DOM
-
2026-06-07days on market $85,000 Active 104 DOM
-
2026-06-05days on market $85,000 Active 101 DOM
-
2026-06-03days on market $85,000 Active 100 DOM
-
2026-06-02days on market $85,000 Active 99 DOM
-
2026-06-01days on market $85,000 Active 98 DOM
-
2026-05-31days on market $85,000 Active 97 DOM
-
2026-05-30days on market $85,000 Active 96 DOM
-
2026-05-18status Pending
-
2026-03-24price $85,000
-
2026-02-12$87,000 Active
-
2026-01-31historical
-
2025-09-23price $87,000
-
2025-07-25$95,000 Active
-
2025-03-10price $99,500
-
2024-11-15status Active
-
2024-05-08$108,000 Active
-
2023-10-14historical $559
-
2023-08-29$559
-
2023-03-13soldstatus $90,000
-
2023-03-10soldstatus $90,000
-
2022-01-05$104,900
-
2020-01-07soldstatus $15,000
-
2003-07-15soldstatus $32,500
ⓘ Source: listings_history table (triggers on properties + properties_extension) + one-shot
backfill from property_details.listing_events for pre-trigger history.
Tax reassessment forecast OK · Resets to sale price
- Current annual tax
- $1,271 · $106/mo
- Projected year-2 tax
- $1,271 · $106/mo
- Expected delta
- $0/yr ($0/mo · 0.0%)
ⓘ Screening estimate from a state-policy table — verify with the county assessor before closing.
Climate risk First Street
- Flood 1/10 Low FEMA zone X (unshaded) · 0% chance over 30 yrs
- Wildfire 6/10 Major
- Heat 6/10 Major 7 d/yr ≥108°F today · 19 d/yr by 30 yrs out
- Wind 2/10 Low 4% chance of damaging wind over 30 yrs
- Air quality 1/10 Low 0 unhealthy d/yr today · 0 by 30 yrs out
Nearby sold comps map
Loading sold comps map…
Walkable amenities ~0.75 mi
Loading nearby amenities…
Taxation est. · year 1
- Rental income
- $12,917
- − Mortgage interest
- −$4,761
- − Property taxes
- −$1,271
- − Insurance
- −$425
- − Repairs & maintenance
- −$1,033
- − Management
- −$1,033
- − Depreciation
- −$2,473
- Taxable income
- $1,920
- Est. tax owed @ 24.0%
- −$461
- After-tax cash flow
- $2,698/yr
For passive investors: Depreciation is non-cash, so a rental often shows a tax loss while cash-flowing — sheltering income. Rental losses are passive: they offset passive income freely, and up to $25,000/yr can offset ordinary (W-2) income if you actively participate and your MAGI is under $100k (phasing out to $0 by $150k); unused losses carry forward. On sale, claimed depreciation is recaptured at up to 25%, and gains may owe capital-gains tax (a 1031 exchange can defer both). Figures are a year-1 estimate at your 24.0% rate — not tax advice; consult a CPA.
Schools (NCES district)
- District
- Lawton
- NCES district ID
- 4017250
- Math proficiency
- 20% ▼ -12.00%
- Reading proficiency
- 26% ▼ -9.00%
- Median HH income
- $42,618
- Composite
- 19.68/100
- National rank
- #8732
- State rank
- #137 of 270 in OK
Livability — Lawton
- Score
- 63/100
- State rank
- #206
- US rank
- #15131
Category grades
Schools grade is shown separately in the Schools card above.
Census & demographics
- Census place
- Lawton, OK
- County
- Comanche County · 96,361 people
- City population
- 89,233
- Metro
- Lawton, OK
- Population (ZIP)
- 21,046
- Household income
- $62,132
- Rent vs Own
- Severe rent burden
- 979.0
Population outlook (Comanche County) Hauer SSP2
- Today (2025)
- 124,518 people
- By 2030
- 124,231 · -0.2%
- By 2040
- 122,193 · -1.9%
- By 2050
- 120,368 · -3.3%
- By 2075
- 120,492 · -3.2%
- By 2100
- 123,113 · -1.1%
Race, ethnicity, and origin ACS 2023
- Neighborhood character
- Diverse neighborhood (Simpson 0.65)
- Race & ethnicity
- White 56% Hispanic / Latino 14% Two or more races 13% Black 13% Native American 7% Asian 2%
- Hispanic origin (detail)
- Mexican 7% Puerto Rican 4%
- Common ancestry
- Lithuanian 2% Slovak 2% Italian 1%
- Foreign-born
- 5% · Canada, South Korea
- Languages at home
- 89% English-only · Spanish 6% German/W. Germanic 1% Other Asian/Pacific 1%
Political lean MEDSL · Comanche
- 2024 margin
- Strong R (+23.3) · D 37.4% · R 60.7% · Other 1.9%
- 2008→2024 swing
- -5.8pp toward R · 2008: -17.5pp · 2024: -23.3pp
- All cycles
- 2024: R+23.3 2020: R+20.1 2016: R+23.7 2012: R+17.0 2008: R+17.5
Not yet ingested
- Civics
- —
Market trends
- HPI YoY
- ▼ -38.48%
- Current HPI
- 127.057
- Rent YoY
- ▲ 0.25%
- Metro
- Lawton, OK
- State GDP YoY
- ▲ 1.55%
- F500 in state
- 6
Industry mix (Fortune 500 HQ in OK)
| Industry | F500 HQs | Revenue |
|---|---|---|
| Energy | 3 | $48B |
|
||
Price history
+161.5% since first listed16 events — show timeline
- 2026-05-18 Pending — MLS Technology, Inc.
- 2026-03-24 Price Changed $85,000 MLS Technology, Inc.
- 2026-02-12 Listed $87,000 MLS Technology, Inc.
- 2026-01-31 Listing Removed — MLS Technology, Inc.
- 2025-09-23 Price Changed $87,000 MLS Technology, Inc.
- 2025-07-25 Listed $95,000 MLS Technology, Inc.
- 2025-03-10 Price Changed $99,500 LBRMLS
- 2024-11-15 Relisted — LBRMLS
- 2024-05-08 Listed $108,000 LBRMLS
- 2023-10-14 Rental Removed $559 HEROPM
- 2023-08-29 Listed for Rent $559 HEROPM
- 2023-03-13 Sold (Public Records) $90,000 Public Records
- 2023-03-10 Sold (MLS) $90,000 LBRMLS
- 2022-01-05 Listed $104,900 LBRMLS
- 2020-01-07 Sold (Public Records) $15,000 Public Records
- 2003-07-15 Sold (Public Records) $32,500 Public Records
Property tax history
+8.7%/yrLatest (2025): $1,271 · +4.6% YoY. Source: county tax records.
Cash-flow waterfall
monthlySold comps — $/sqft
last 12 mo · ≤1 miLoading sold comps…