 🏷️ Likely Rental
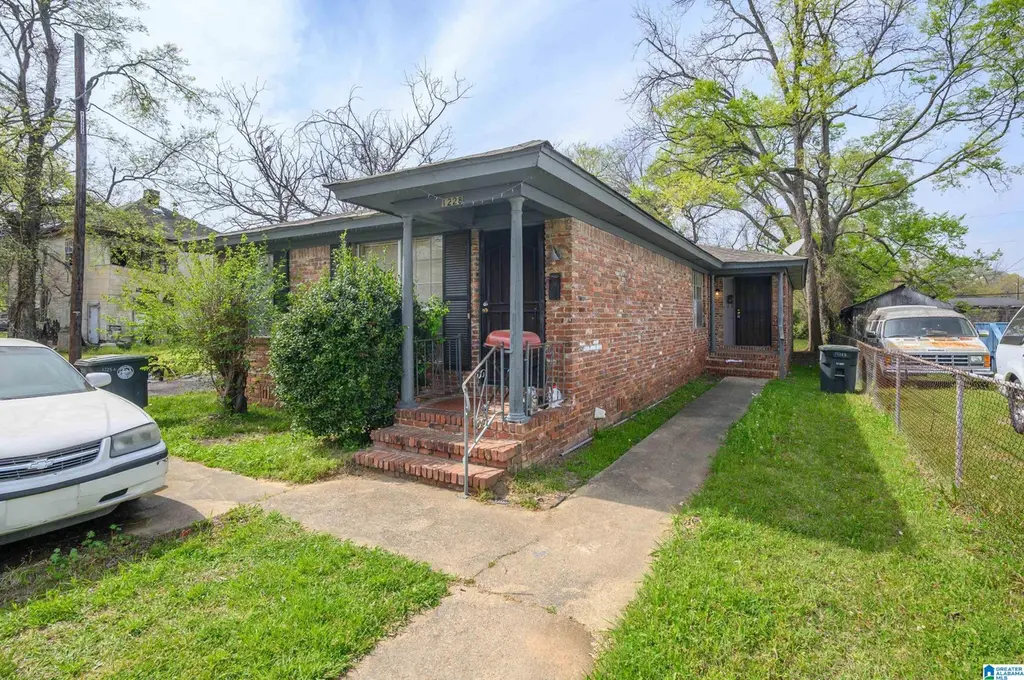
1228 Fulton Ave SW · Birmingham, AL
Flood risk 1/10 · Minimal
- FEMA flood zone
- X (unshaded)
- Chance of flooding over 30 yrs
- 0.0%
- Est. flood insurance / yr
- $507 – $1,088
Fire risk 1/10 · Minimal
- Est. fire insurance / yr
- $916 – $1,700
Heat risk 7/10 · Major
- Hot days now (above 106°F)
- 7 days/yr
- Hot days in 30 yrs
- 19 days/yr
Wind risk 6/10 · Moderate
- Chance of severe wind over 30 yrs
- 27.0%
Air-quality risk 4/10 · Minor
- Unhealthy air days now
- 5 days/yr
- Unhealthy air days in 30 yrs
- 5 days/yr
Risk factors via First Street. Map © Google.
Why this score? — see what drove the C+ grade
The composite is a weighted blend of 9 inputs, each scored 0–100. Each bar is that input's sub-score; the figure is the points it added to the 100-point composite (weight × sub-score).
- Cash flow +23.9/30.0
- ARV discount +15.0/15.0
- DSCR +7.7/10.0
- 1% rule +6.2/10.0
- Livability +3.4/5.0
- Condition / age +2.8/5.0
- Rent growth +2.5/5.0
- Schools +0.9/10.0
- Appreciation +0.0/10.0
$125,000
🖨 Deal sheet (PDF) 📄 Offer letter ✓ Due diligence
Listing remarks MLS
Investor special! This income-producing duplex features two spacious units, one rented at $550/month to long-term, on-time paying tenant. With market rents in the area between $750–$800 per side, there’s immediate upside potential for increased cash flow. Both units are in solid condition, and the property is professionally managed. Located in a growing area just minutes from downtown Birmingham, this is a great opportunity to add a stable, high-yield asset to your rental portfolio. Don’t miss out! Both units are separately metered and tenant covers all utility charges.
Key facts
- Built 1972
- Listed 87 days
Neighborhood map
What this means for you Summary
Snapshot
- This is a 4-bed/2.0-bath condo listed at $125k. Condition is rated average.
Deal economics
- At list price, monthly cash flow is $242 ($3k/yr) — positive.
- The deal already cash-flows at list — no discount required.
- Meets the 1% rule at list price ($1k rent vs $125k).
- Recommended offer: $118k (6.0% below list) — sets the bar for market timing.
- Cap rate 8.6% vs local median 6.2% in Birmingham — top-decile yield for the area; either an underpriced asset or a hidden risk that comps aren't pricing in. Stress-test before assuming the spread holds.
Location & tenants
- Location reads 67/100 on livability (#78 in AL) — a middle-class / working-renter tenant base. Strengths: commute A+, cost of living A+, housing A+; Watch: amenities C-, schools F, crime F.
- Birmingham City (urban): math 4% / reading 20% proficiency, ranked #116 of 129 in AL (top 90%) — low school quality limits family demand, transient renter base, plan for 1-2y turnover; 82% free/reduced lunch — lower-income household profile, screen leases tightly.
- Market conditions: Rents soft (-0.0%/yr); 154 active listings in the ZIP; 40 comparable units currently listed for rent nearby; rentals lingering (median 46d on market — plan ~5-8 weeks vacancy on turnover, expect pricing pressure); 50% of comp listings sitting > 30 days — soft ceiling on asking rent; lower-income renter base — watch delinquency; 2,114 units permitted in Jefferson County in 2024 (556 in 5+ unit buildings).
- At $1,400/mo this rent would consume 48% of the median local household income ($35k/yr) (locally 2161% of renters already pay >50% of income on rent) — very limited rent-growth headroom before tenants either downsize or default.
Forward outlook
- Local home prices are declining (-3.0%/yr); year-one equity from $864 of loan paydown is wiped out by about $4k of value loss. Plan a longer hold.
- Jefferson County population projected to shrink 4% by 2050 — rents likely to lag national; underwrite the cash flow, not the appreciation.
Negotiation context
- It's been on market 87 days — a 6% lower offer ($118k) is reasonable based on typical stale-listing flexibility.
- 2 sale attempts; this cycle's ask is 15525% above the opening price — seller raised mid-cycle; expect resistance to lowballs.
Risks & watch-outs
- Climate carrying-cost: major wind risk, 27% chance of damaging wind over 30y; extreme-heat days projected 7→19/yr by 2055 (HVAC capex compounding) — expect insurance premiums to compound above CPI over the hold.
Questions for the listing agent
- It's been on market 87 days. Have you received any prior offers? Is the seller open to a 6% concession, seller financing, or rate buy-down credit?
- Built in 1972 — when were the roof, HVAC, electrical panel, plumbing, and water heater last replaced?
- Any open or pending special assessments — roof, HVAC, plumbing, elevator, façade? What's the per-unit balance and payoff schedule, and is the seller paying it off at close or rolling it to the buyer?
- Why hasn't it sold? Are there any deal-killer items the seller is aware of (foundation, flood, title, zoning, code violations)?
- Is there a deadline driving the sale (1031 exchange, divorce, estate, relocation)? That informs how much negotiation room exists.
- Schools are F-rated, which usually means shorter tenancies and higher turnover. Who's the typical renter profile here, and what's been the actual vacancy rate?
- Crime grade is F in this area — have there been break-ins, vandalism, or insurance claims at this property in the last 3 years? What carrier currently insures it and at what premium?
- What's the average days-on-market for RENTAL listings here right now (not sales)? A rising rental-DOM trend means longer vacancies and softer asking-rent achievability than the comps imply.
- What's the recent tenant-quality profile in this submarket — average credit score on applications, eviction rate, late-payment / NSF rate, and stable-employment percentage? A property-management company in the area should have these aggregated.
- How much new apartment / multifamily construction is in the pipeline within 1–3 miles? Heavy new supply (>2% of stock underway) typically softens rents 12–24 months out; light construction supports rent growth.
Investment metrics
- 1% rule
- 1.12% ✓
- Cap rate
- 8.62%
- Cash-on-cash
- 8.31%
- DSCR
- 1.37
- GRM
- 7.4
CMA / ARV
- ARV (median comp)
- $212,977
- List price
- $125,000
- Delta
- -41.31%
- Verdict
- UNDERPRICED
- Comps
- 2 within 2.0 mi
Projected returns pro-forma
-3.0% appreciation · 0.0% rent growth · sell at horizon
- IRR
- -7.1%
- Equity multiple
- 0.75×
- Total profit
- $-8,903
- Equity at exit
- $18,638
- IRR
- -1.8%
- Equity multiple
- 0.90×
- Total profit
- $-3,651
- Equity at exit
- $10,808
Cash invested: $35,000 (down + closing). Projections, not guarantees.
Landlord ↔ Tenant lean methodology
- Overall (STATE)
- 90 Strongly Landlord-Friendly
- State Alabama
- 90 Strongly Landlord-Friendly · R+15
- County
- — inherits STATE
- City
- — inherits STATE
ZIP-level market 35211
- Rents YoY
- -0.0%
- Active inventory
- 154
- Price-to-rent
- 7.4×
Monthly cashflow live
- Estimated rent
- $1,400 high interval (Pro) →
- Mortgage (P&I)
- −$656
- Tax est. 1.5%
- −$156 /mo · $1,875/yr
- Insurance
- −$52
- HOA
- −$0
- Vacancy / Maint / Mgmt
- −$294
- Net cashflow
- $242
Break-even live
Sensitivity live
| Price | -10% $329 | -5% $286 | +0% $242 | +5% $199 | +10% $156 |
|---|---|---|---|---|---|
| Rent | -10% $132 | -5% $187 | +0% $242 | +5% $298 | +10% $353 |
| Rate | -1.0pp $305 | -0.5pp $274 | base $242 | +0.5pp $210 | +1.0pp $177 |
UW: 25.0% down · 7.5% · 30yr · 1.5% tax · 5.0% vac · 8.0% maint · 8.0% mgmt
Financing live
Cash to close
- Down payment
- $31,250
- Closing costs
- $3,750
- Reserves months
- —
- Total cash needed
- —
Loan-product check · same deal, 3 products live
Conventional
25% down · 7.5% · 30yr
- Down + closing
- —
- Monthly P&I
- —
- Monthly cashflow
- —
- DSCR
- —
- Eligible?
- —
Personal DTI + credit; lowest rate.
DSCR
20% down · 8.5% · 30yr
- Down + closing
- —
- Monthly P&I
- —
- Monthly cashflow
- —
- DSCR
- —
- Eligible?
- —
No personal income docs; deal must DSCR.
Hard money
10% down · 12.0% · 12mo
- Down + closing
- —
- Monthly P&I
- —
- Monthly cashflow
- —
- DSCR
- —
- Eligible?
- —
Short-term bridge; refi at stabilization.
Rent comps 40 comps
| Address | Beds | Baths | Sqft | Rent | $/sqft | DOM | Units | Dist |
|---|---|---|---|---|---|---|---|---|
| 1213 Alabama Ave SW Birmingham, AL | 4.0 | 2.0 | 1616 | $1,200 | $0.74 | 45d | 1 | 0.04mi |
| 1217 Fulton Ave SW Birmingham, AL | 4.0 | 2.0 | 1397 | $1,395 | $1.00 | 45d | 1 | 0.05mi |
| 1437 Woodland Ave SW Birmingham, AL | 3.0 | 1.0 | 1369 | $1,100 | $0.80 | 5d | 1 | 0.30mi |
| 1501 Princeton Ave SW Birmingham, AL | 3.0 | 2.0 | 1260 | $1,350 | $1.07 | 46d | 1 | 0.34mi |
| 1012 Cotton Ave SW Birmingham, AL | 3.0 | 1.0 | 1232 | $1,000 | $0.81 | 45d | 1 | 0.38mi |
| 1645 Woodland Ave SW Birmingham, AL | 4.0 | 2.0 | 1298 | $1,300 | $1.00 | 20d | 1 | 0.55mi |
| 820 McMillon Ave SW Birmingham, AL | 5.0 | 2.0 | 1795 | $1,350 | $0.75 | 45d | 1 | 0.57mi |
| 644 Alabama Ave SW Birmingham, AL | 3.0 | 1.0 | 1274 | $1,125 | $0.88 | 25d | 1 | 0.65mi |
| 504 Francis Pl SW Birmingham, AL | 3.0 | 2.0 | 1816 | $1,223 | $0.67 | 25d | 1 | 0.67mi |
| 1800 Woodland Ave SW Birmingham, AL | 4.0 | 1.0 | 1411 | $1,195 | $0.85 | 3d | 1 | 0.69mi |
| 608 Fulton Ave SW Birmingham, AL | 3.0 | 1.0 | 1271 | $1,300 | $1.02 | 45d | 1 | 0.73mi |
| 1136 15th St SW Birmingham, AL | 4.0 | 2.0 | 1296 | $1,395 | $1.08 | 25d | 1 | 0.73mi |
| 1149 15th St SW Birmingham, AL | 5.0 | 2.0 | 2371 | $1,399 | $0.59 | 45d | 1 | 0.74mi |
| 1609 Jefferson Ave SW Birmingham, AL | 4.0 | 1.0 | 1572 | $1,300 | $0.83 | 5d | 1 | 0.79mi |
| 1108 4th Ct W Birmingham, AL | 3.0 | 2.0 | 1623 | $1,125 | $0.69 | 4d | 1 | 0.79mi |
| 1141 15th Way SW Birmingham, AL | 5.0 | 2.0 | 1458 | $1,400 | $0.96 | 45d | 1 | 0.80mi |
| 1728 Princeton Ave SW Birmingham, AL | 4.0 | 2.0 | 1334 | $1,300 | $0.97 | 45d | 1 | 0.82mi |
| 1816 Saint Charles Ave SW Birmingham, AL | 3.0 | 1.0 | 1395 | $1,295 | $0.93 | 25d | 1 | 0.84mi |
| 1620 Alemeda Ave SW Birmingham, AL | 3.0 | 2.0 | 1314 | $1,295 | $0.99 | 3d | 1 | 0.85mi |
| 1204 15th Way SW Birmingham, AL | 4.0 | 3.0 | 1715 | $1,400 | $0.82 | 45d | 1 | 0.86mi |
| 1230 4th Ter W Birmingham, AL | 3.0 | 2.0 | 1540 | $1,000 | $0.65 | 45d | 1 | 0.87mi |
| 724 4th Ct W Birmingham, AL | 3.0 | 1.0 | 1300 | $930 | $0.72 | 45d | 1 | 0.87mi |
| 2920 24th Street Ensley Unit ENSLEY Birmingham, AL | 3.0 | 2.0 | 1800 | $1,050 | $0.58 | 25d | 1 | 0.96mi |
| 1698 Heron Johnson Dr Birmingham, AL | 5.0 | 1.5 | 1500 | $1,175 | $0.78 | 45d | 1 | 0.97mi |
| 1119 Graymont Ave W Birmingham, AL | 3.0 | 1.0 | 1260 | $1,073 | $0.85 | 3d | 1 | 0.97mi |
| 1701 4th Ter W Birmingham, AL | 4.0 | 2.5 | 1977 | $1,550 | $0.78 | 25d | 1 | 0.98mi |
| 1872 Princeton Ct SW Birmingham, AL | 5.0 | 2.0 | 1829 | $1,700 | $0.93 | 25d | 1 | 0.99mi |
| 2309 Eufaula Ave Birmingham, AL | 4.0 | 2.0 | 1454 | $1,395 | $0.96 | 25d | 1 | 0.99mi |
| 2304 Eufaula Ave Birmingham, AL | 3.0 | 1.0 | 1381 | $980 | $0.71 | 45d | 1 | 1.01mi |
| 1900 Saint Charles Ave SW Birmingham, AL | 4.0 | 2.0 | 1623 | $1,350 | $0.83 | 3d | 1 | 1.02mi |
| 1101 7th Ave W Birmingham, AL | 3.0 | 1.0 | 1248 | $1,250 | $1.00 | 45d | 1 | 1.03mi |
| 2709 30th Street Ensley Birmingham, AL | 4.0 | 2.0 | 1410 | $1,323 | $0.94 | 3d | 1 | 1.03mi |
| 1698 Dennison Ave SW Birmingham, AL | 4.0 | 2.0 | 1780 | $1,300 | $0.73 | 45d | 1 | 1.03mi |
| 612 12th St W Birmingham, AL | 3.0 | 1.5 | 1242 | $1,150 | $0.93 | 45d | 1 | 1.07mi |
| 1408 16th St SW Birmingham, AL | 3.0 | 2.0 | 2076 | $1,150 | $0.55 | 45d | 1 | 1.15mi |
| 2712 24th Street Ensley Unit ENSLEY Birmingham, AL | 3.0 | 1.0 | 1232 | $1,099 | $0.89 | 25d | 1 | 1.15mi |
| 2720 23rd Street Ensley Birmingham, AL | 4.0 | 2.0 | 1350 | $1,500 | $1.11 | 5d | 1 | 1.18mi |
| 2720 23rd Street Ensley Birmingham, AL | 4.0 | 2.0 | 1692 | $1,500 | $0.89 | 20d | 1 | 1.18mi |
| 12 4th Ave SW Unit 1 Birmingham, AL | 3.0 | 1.0 | 1336 | $1,100 | $0.82 | 45d | 1 | 1.27mi |
| 1532 Graymont Ave W Birmingham, AL | 4.0 | 2.0 | 1913 | $1,150 | $0.60 | 45d | 1 | 1.28mi |
HOA detail condo
- Monthly dues
- $0 · $0/yr
- Assessments
- None detected in remarks — confirm with the listing agent.
Listing history 18 events
-
2026-06-21days on market $125,000 Active 87 DOM
-
2026-06-18days on market $125,000 Active 84 DOM
-
2026-06-17days on market $125,000 Active 83 DOM
-
2026-06-16days on market $125,000 Active 82 DOM
-
2026-06-15days on market $125,000 Active 81 DOM
-
2026-06-13days on market $125,000 Active 79 DOM
-
2026-06-10days on market $125,000 Active 76 DOM
-
2026-06-09days on market $125,000 Active 75 DOM
-
2026-06-08days on market $125,000 Active 74 DOM
-
2026-06-07days on market $125,000 Active 73 DOM
-
2026-06-03days on market $125,000 Active 69 DOM
-
2026-06-02days on market $125,000 Active 68 DOM
-
2026-06-01days on market $125,000 Active 67 DOM
-
2026-05-31days on market $125,000 Active 66 DOM
-
2026-05-14price $750
-
2026-05-01$800
-
2026-04-15price $125,000 594-char remark
Show marketing remark (594 chars)
Investor special! This income-producing duplex features two spacious units, one rented at $550/month to long-term, on-time paying tenant. With market rents in the area between $750–$800 per side, there’s immediate upside potential for increased cash flow. Both units are in solid condition, and the property is professionally managed. Located in a growing area just minutes from downtown Birmingham, this is a great opportunity to add a stable, high-yield asset to your rental portfolio. Don’t miss out! Both units are separately metered and tenant covers all utility charges.
-
2026-03-26$130,000 Active 594-char remark
Show marketing remark (594 chars)
Investor special! This income-producing duplex features two spacious units, one rented at $550/month to long-term, on-time paying tenant. With market rents in the area between $750–$800 per side, there’s immediate upside potential for increased cash flow. Both units are in solid condition, and the property is professionally managed. Located in a growing area just minutes from downtown Birmingham, this is a great opportunity to add a stable, high-yield asset to your rental portfolio. Don’t miss out! Both units are separately metered and tenant covers all utility charges.
ⓘ Source: listings_history table (triggers on properties + properties_extension) + one-shot
backfill from property_details.listing_events for pre-trigger history.
Climate risk First Street
- Flood 1/10 Low FEMA zone X (unshaded) · 0% chance over 30 yrs
- Wildfire 1/10 Low
- Heat 7/10 Severe 7 d/yr ≥106°F today · 19 d/yr by 30 yrs out
- Wind 6/10 Major 27% chance of damaging wind over 30 yrs
- Air quality 4/10 Moderate 5 unhealthy d/yr today · 5 by 30 yrs out
Nearby sold comps map
Loading sold comps map…
Walkable amenities ~0.75 mi
Loading nearby amenities…
Taxation est. · year 1
- Rental income
- $16,803
- − Mortgage interest
- −$7,002
- − Property taxes
- −$1,875
- − Insurance
- −$625
- − Repairs & maintenance
- −$1,344
- − Management
- −$1,344
- − Depreciation
- −$3,636
- Taxable income
- $976
- Est. tax owed @ 24.0%
- −$234
- After-tax cash flow
- $2,674/yr
For passive investors: Depreciation is non-cash, so a rental often shows a tax loss while cash-flowing — sheltering income. Rental losses are passive: they offset passive income freely, and up to $25,000/yr can offset ordinary (W-2) income if you actively participate and your MAGI is under $100k (phasing out to $0 by $150k); unused losses carry forward. On sale, claimed depreciation is recaptured at up to 25%, and gains may owe capital-gains tax (a 1031 exchange can defer both). Figures are a year-1 estimate at your 24.0% rate — not tax advice; consult a CPA.
Condition & rehab AI · 12 photos
This income-producing duplex requires moderate repairs and maintenance to improve its condition and value. Painting, landscaping, and kitchen updates would significantly enhance its appeal and marketability.
Repairs flagged
- Moderate Kitchen cabinets — Worn appearance
- Minor Kitchen countertops — Need cleaning
Value-add opportunities
- Both Painting — Fresh paint enhances curb appeal and interior aesthetics
- Both Landscaping — Well-maintained landscaping improves curb appeal and property value
- Both Kitchen updates — New countertops and cabinets would modernize the kitchen and increase both resale and rental value
Renovation cost estimate screening
| Repair item | Severity | Est. cost |
|---|---|---|
| Kitchen cabinets · Worn appearance | Moderate | $3,000–15,000 |
| Kitchen countertops · Need cleaning | Minor | $500–3,000 |
| Total estimated repair cost · 2 items | $3,500–18,000 |
Value-add ROI direction
- Both Painting — Fresh paint enhances curb appeal and interior aesthetics ↑
- Both Landscaping — Well-maintained landscaping improves curb appeal and property value ↑
- Both Kitchen updates — New countertops and cabinets would modernize the kitchen and increase both resale and rental value ↑
ⓘ Cost ranges are severity-bucket heuristics (US national rule-of-thumb). Get contractor quotes + a written scope before underwriting a rehab budget.
Schools (NCES district)
- District
- Birmingham City
- NCES district ID
- 0100390
- Math proficiency
- 4% ▼ -17.00%
- Reading proficiency
- 20% ▼ -4.00%
- Median HH income
- $31,988
- Composite
- 9.49/100
- National rank
- #9850
- State rank
- #116 of 129 in AL
Livability — Birmingham
- Score
- 67/100
- State rank
- #78
- US rank
- #10412
Category grades
Schools grade is shown separately in the Schools card above.
Census & demographics
- Census place
- Birmingham, AL
- County
- Jefferson County · 527,445 people
- City population
- 210,422
- Metro
- Birmingham-Hoover, AL
- Population (ZIP)
- 24,924
- Household income
- $34,884
- Rent vs Own
- Severe rent burden
- 2161.0
Population outlook (Jefferson County) Hauer SSP2
- Today (2025)
- 669,185 people
- By 2030
- 669,694 · +0.1%
- By 2040
- 661,388 · -1.2%
- By 2050
- 643,086 · -3.9%
- By 2075
- 577,267 · -13.7%
- By 2100
- 474,758 · -29.1%
Race, ethnicity, and origin ACS 2023
- Neighborhood character
- Predominantly Black (77%)
- Race & ethnicity
- Black 77% White 10% Hispanic / Latino 10% Two or more races 4%
- Hispanic origin (detail)
- Mexican 7%
- Foreign-born
- 6% · Canada
- Languages at home
- 91% English-only · Spanish 8% French/Haitian/Cajun 1%
Political lean MEDSL · Jefferson
- 2024 margin
- D (+10.4) · D 54.6% · R 44.2% · Other 1.2%
- 2008→2024 swing
- +5.4pp toward D · 2008: 5.1pp · 2024: 10.4pp
- All cycles
- 2024: D+10.4 2020: D+13.2 2016: D+7.2 2012: D+6.0 2008: D+5.1
Not yet ingested
- Civics
- —
Market trends
- HPI YoY
- ▼ -49.29%
- Current HPI
- 91.2903
- Rent YoY
- ▬ -0.01%
- Metro
- Birmingham-Hoover, AL
- State GDP YoY
- ▲ 2.94%
- F500 in state
- 4
Industry mix (Fortune 500 HQ in AL)
| Industry | F500 HQs | Revenue |
|---|---|---|
| Financial Services | 1 | $8B |
|
||
| Healthcare | 1 | $5B |
|
||
Price history
-3.8% since first listed4 events — show timeline
- 2026-05-14 Price Changed $750 SHOWMOJO
- 2026-05-01 Listed for Rent $800 SHOWMOJO
- 2026-04-15 Price Changed $125,000 Greater Alabama MLS
- 2026-03-26 Listed $130,000 Greater Alabama MLS
Cash-flow waterfall
monthlySold comps — $/sqft
last 12 mo · ≤1 miLoading sold comps…