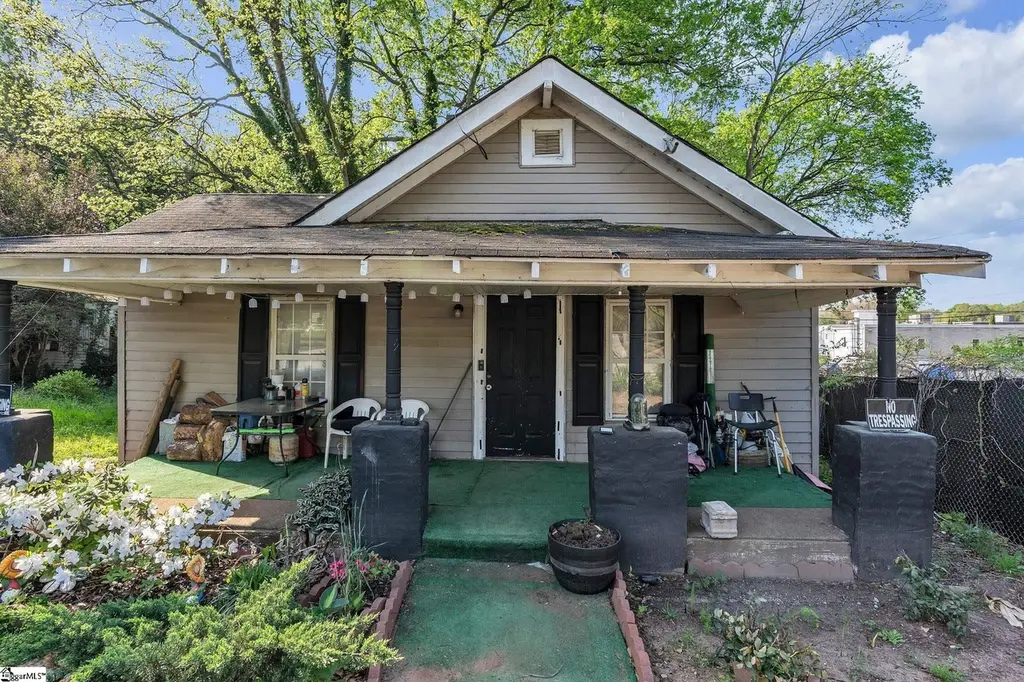
1001 W Bramlett Rd · City View, SC
Flood risk 4/10 · Minor
- FEMA flood zone
- X (unshaded)
- Chance of flooding over 30 yrs
- 0.13%
- Est. flood insurance / yr
- $507 – $1,088
Fire risk 1/10 · Minimal
- Est. fire insurance / yr
- $783 – $1,453
Heat risk 6/10 · Moderate
- Hot days now (above 102°F)
- 7 days/yr
- Hot days in 30 yrs
- 17 days/yr
Wind risk 2/10 · Minimal
- Chance of severe wind over 30 yrs
- 0.0%
Air-quality risk 4/10 · Minor
- Unhealthy air days now
- 3 days/yr
- Unhealthy air days in 30 yrs
- 4 days/yr
Risk factors via First Street. Map © Google.
Why this score? — see what drove the B- grade
The composite is a weighted blend of 9 inputs, each scored 0–100. Each bar is that input's sub-score; the figure is the points it added to the 100-point composite (weight × sub-score).
- Cash flow +30.0/30.0
- DSCR +10.0/10.0
- 1% rule +8.0/10.0
- ARV discount +7.5/15.0
- Schools +4.2/10.0
- Livability +3.9/5.0
- Rent growth +2.9/5.0
- Condition / age +2.5/5.0
- Appreciation +0.0/10.0
$115,000
🖨 Deal sheet (PDF) 📄 Offer letter ✓ Due diligence
Listing remarks
Investor/Handyman special in a prime Greenville location! 1001 W Bramlett Rd is a 2-bedroom, 1-bath home just minutes from the thriving downtown Greenville area—making it an excellent opportunity for your next flip or rental property. This home is in need of TLC but offers strong potential for value-add improvements and equity growth. With continued development and demand in the surrounding area, this property is ideally positioned for solid returns. Whether you're looking to renovate and resell or hold as a cash-flowing rental, the upside here is clear. Conveniently located near shopping, dining, and major roadways, this property checks the boxes for both investors and future tenants
Key facts
- 7,405 sq ft lot
- Garage
- Listed 69 days
Tags
Property features AI
Finance
- Other: Lead-based paint and residential property disclosures required
- HOA & community: No HOA fees or community amenities
Exterior
- Parking: Driveway parking (unpaved)
- Utilities: Public water; Electric water heater; Public sewer; Public garbage pickup
- Home design: Single-story residence; Approximate age 50+ years; Crawl space foundation
- Construction: Vinyl siding exterior; Roof listed as 'Other (see remarks)'
- Exterior features: Front porch; Level lot with some trees
Interior
- Kitchen: Kitchen (11 x 15); Stand-alone electric range
- Bedrooms: Primary bedroom on main level (11 x 13); Second bedroom on main level (9 x 12)
- Flooring: Carpet; Vinyl
- Bathrooms: One full bathroom (on main level)
- Heating & cooling: Electric heating; Central forced air cooling (electric)
- Interior features: Ceiling fan; Open floor plan; Non-standard countertops
- Laundry & utility: Laundry on 1st floor; Washer connection; Electric dryer hookup
Neighborhood map
What this means for you Summary
Snapshot
- This is a 2-bed/1.0-bath single-family listed at $115k.
Deal economics
- At list price, monthly cash flow is $475 ($6k/yr) — positive.
- The deal already cash-flows at list — no discount required.
- Meets the 1% rule at list price ($1k rent vs $115k).
- Recommended offer: $108k (6.0% below list) — sets the bar for market timing.
Location & tenants
- Location reads 77/100 on livability (#20 in SC, #3,185 nationally) — a middle-class / working-renter tenant base. Strengths: commute A+, cost of living A+, crime A; Watch: employment D-, housing F.
- Greenville 01 (suburban): math 44% / reading 54% proficiency, ranked #10 of 80 in SC (top 12%) — families likely to look elsewhere, expect single-tenant / working-renter base with shorter leases.
- Zoned schools: Alexander Elementary (math 17% / reading 17%, grade F, #515 of 597 statewide, top 89%, 449 students, 100% FRL) — zoned schools average 100% FRL vs 42% district-wide (58 pts higher); higher-poverty schools than district average — tighter screening recommended.
- Zoned-school proficiency averages 17% at this address vs 49% district-wide (-32 pts) — the specific schools serving this property underperform the Greenville 01 average; the district grade overstates school quality for this exact location.
- Market conditions: Rents rising (+1.7%/yr); 278 active listings in the ZIP; 40 comparable units currently listed for rent nearby; rentals at typical pace (median 16d on market — plan ~3-4 weeks tenant-placement turnaround); 5,595 units permitted in Greenville County in 2024 (566 in 5+ unit buildings).
- This rent runs 35% of the median local income ($52k/yr) — at the standard rent-burdened threshold; future hikes will face affordability resistance.
Forward outlook
- Local home prices are declining (-3.0%/yr); year-one equity from $795 of loan paydown is wiped out by about $3k of value loss. Plan a longer hold.
- Greenville County population projected at +34% by 2050 — long-run rental-demand tailwind backs the buy-and-hold thesis.
- At projected returns (-3.0% appreciation + 1.7% rent growth), your $32k cash investment doubles in ~8 years — after that, you're playing with house money.
Negotiation context
- It's been on market 69 days — a 6% lower offer ($108k) is reasonable based on typical stale-listing flexibility.
- Current owner paid $8k; list at $115k implies a 1433% gain — meaningful room to come down on a strong offer.
Risks & watch-outs
- Watch-outs: built in 1950 — expect roof / HVAC / electrical / plumbing capex.
- Climate carrying-cost: extreme-heat days projected 7→17/yr by 2055 (HVAC capex compounding) — expect insurance premiums to compound above CPI over the hold.
Questions for the listing agent
- It's been on market 69 days. Have you received any prior offers? Is the seller open to a 6% concession, seller financing, or rate buy-down credit?
- Built in 1950 — when were the roof, HVAC, electrical panel, plumbing, and water heater last replaced?
- Why hasn't it sold? Are there any deal-killer items the seller is aware of (foundation, flood, title, zoning, code violations)?
- Is there a deadline driving the sale (1031 exchange, divorce, estate, relocation)? That informs how much negotiation room exists.
- Schools are F-rated, which usually means shorter tenancies and higher turnover. Who's the typical renter profile here, and what's been the actual vacancy rate?
- What's the average days-on-market for RENTAL listings here right now (not sales)? A rising rental-DOM trend means longer vacancies and softer asking-rent achievability than the comps imply.
- What's the recent tenant-quality profile in this submarket — average credit score on applications, eviction rate, late-payment / NSF rate, and stable-employment percentage? A property-management company in the area should have these aggregated.
- How much new for-sale + rental construction is in the pipeline within 1–3 miles? Heavy new supply typically softens prices + rents 12–24 months out; constrained supply supports both.
Investment metrics
- 1% rule
- 1.30% ✓
- Cap rate
- 11.25%
- Cash-on-cash
- 17.69%
- DSCR
- 1.79
- GRM
- 6.4
CMA / ARV
- ARV (on-the-fly)
- $243,276
- Comps found
- 12
Show comp detail 12 sales within ~0.75 mi
| Address | Dist | Beds/Ba | Sqft | Sold | Price | $/sf | Match |
|---|---|---|---|---|---|---|---|
| 101 Fletcher St | 0.22mi | 2/1.0 | 1,148 (+8%) | 5mo | $122,500 | $107 | 73 |
| 516 Spring St | 0.50mi | 2/1.0 | 1,050 (-2%) | 7mo | $135,000 | $129 | 68 |
| 114 E Parker Rd | 0.40mi | 2/1.5 | 981 (-8%) | 7mo | $275,000 | $280 | 60 |
| 18 Louise Ave | 0.59mi | 3/1.0 (+1) | 999 (-6%) | 3mo | $258,000 | $258 | 55 |
| 67 E.8th St | 0.38mi | 2/1.0 | 980 (-8%) | 20mo | $145,000 | $148 | 52 |
| 9 Hoyt St | 0.37mi | 3/1.0 (+1) | 1,200 (+12%) | 8mo | $120,000 | $100 | 50 |
| 512 Spring St | 0.48mi | 3/1.0 (+1) | 986 (-8%) | 13mo | $224,900 | $228 | 49 |
| 240 Clemson Ave | 0.48mi | 3/2.0 (+1) | 1,000 (-6%) | 14mo | $148,500 | $149 | 46 |
| 7 Iola St | 0.65mi | 3/2.0 (+1) | 1,165 (+9%) | 1mo | $369,000 | $317 | 45 |
| 8 Queen Aly Aly | 0.74mi | 2/2.0 | 1,160 (+9%) | 12mo | $360,000 | $310 | 37 |
| 11 B St | 0.51mi | 2/1.0 | 911 (-15%) | 19mo | $192,500 | $211 | 36 |
| 211 Mcdowell St | 0.73mi | 3/1.0 (+1) | 976 (-8%) | 20mo | $275,000 | $282 | 30 |
Match score weights: distance 35% · size 25% · config 20% · recency 20%. Top-matched comps best support the ARV.
Projected returns pro-forma
-3.0% appreciation · 1.72% rent growth · sell at horizon
- IRR
- 7.8%
- Equity multiple
- 1.30×
- Total profit
- $9,665
- Equity at exit
- $17,147
- IRR
- 16.0%
- Equity multiple
- 2.23×
- Total profit
- $39,616
- Equity at exit
- $9,943
Cash invested: $32,200 (down + closing). Projections, not guarantees.
Landlord ↔ Tenant lean methodology
- Overall (STATE)
- 90 Strongly Landlord-Friendly
- State South Carolina
- 90 Strongly Landlord-Friendly · R+6
- County
- — inherits STATE
- City
- — inherits STATE
ZIP-level market 29611
- Home prices YoY
- -34.6%
- Rents YoY
- 1.7%
- Active inventory
- 278
- Price-to-rent
- 6.4×
Monthly cashflow live
- Estimated rent
- $1,494 high interval (Pro) →
- Mortgage (P&I)
- −$603
- Tax from tax record
- −$55 /mo · $655/yr
- Insurance
- −$48
- HOA
- −$0
- Vacancy / Maint / Mgmt
- −$314
- Net cashflow
- $475
Break-even live
Sensitivity live
| Price | -10% $540 | -5% $507 | +0% $475 | +5% $442 | +10% $410 |
|---|---|---|---|---|---|
| Rent | -10% $357 | -5% $416 | +0% $475 | +5% $534 | +10% $593 |
| Rate | -1.0pp $533 | -0.5pp $504 | base $475 | +0.5pp $445 | +1.0pp $415 |
UW: 25.0% down · 7.5% · 30yr · 1.5% tax · 5.0% vac · 8.0% maint · 8.0% mgmt
Financing live
Cash to close
- Down payment
- $28,750
- Closing costs
- $3,450
- Reserves months
- —
- Total cash needed
- —
Loan-product check · same deal, 3 products live
Conventional
25% down · 7.5% · 30yr
- Down + closing
- —
- Monthly P&I
- —
- Monthly cashflow
- —
- DSCR
- —
- Eligible?
- —
Personal DTI + credit; lowest rate.
DSCR
20% down · 8.5% · 30yr
- Down + closing
- —
- Monthly P&I
- —
- Monthly cashflow
- —
- DSCR
- —
- Eligible?
- —
No personal income docs; deal must DSCR.
Hard money
10% down · 12.0% · 12mo
- Down + closing
- —
- Monthly P&I
- —
- Monthly cashflow
- —
- DSCR
- —
- Eligible?
- —
Short-term bridge; refi at stabilization.
Rent comps 40 comps
| Address | Beds | Baths | Sqft | Rent | $/sqft | DOM | Units | Dist |
|---|---|---|---|---|---|---|---|---|
| 33 9th St Greenville, SC | 2.0 | 1.0 | 886 | $1,000 | $1.13 | 25d | 1 | 0.07mi |
| 39 E 7th St Greenville, SC | 3.0 | 2.0 | 1120 | $1,750 | $1.56 | 5d | 1 | 0.26mi |
| 5 Zarline St Greenville, SC | 3.0 | 1.0 | 1060 | $1,095 | $1.03 | 20d | 1 | 0.28mi |
| 12 Catawba Ave Greenville, SC | 3.0 | 2.5 | 1399 | $1,650 | $1.18 | 16d | 1 | 0.40mi |
| 1 E Main St Greenville, SC | 1.0–3.0 | 1.0–2.0 | 1241 | $2,098 | $1.69 | 5d | 28 | 0.45mi |
| 5 Charles St Greenville, SC | 3.0 | 2.0 | 1492 | $1,800 | $1.21 | 25d | 1 | 0.46mi |
| 3 Frost St Greenville, SC | 3.0 | 2.0 | 1450 | $1,900 | $1.31 | 25d | 1 | 0.53mi |
| 7 Iola St Greenville, SC | 3.0 | 2.0 | 1165 | $2,500 | $2.15 | 16d | 1 | 0.66mi |
| 500 Birnie St Greenville, SC | 2.0 | 1.0 | 980 | $1,475 | $1.51 | 25d | 1 | 0.79mi |
| 1121 Tsali Cir Greenville, SC | 2.0 | 1.0–2.0 | 906 | $2,401 | $2.65 | 5d | 8 | 0.83mi |
| 1250 WATER TOWER Cir Greenville, SC | 2.0 | 1.0–2.0 | 790 | $1,959 | $2.48 | 5d | 28 | 0.83mi |
| 1 Craven St Unit 8 Greenville, SC | 2.0 | 1.0 | 850 | $1,350 | $1.59 | 5d | 1 | 0.87mi |
| 1109 Hampton Avenue Ext Unit c Greenville, SC | 2.0 | 1.0 | 785 | $1,022 | $1.30 | 4d | 1 | 0.87mi |
| 1109 Hampton Avenue Ext Unit c Greenville, SC | 2.0 | 1.0 | 785 | $1,100 | $1.40 | 16d | 1 | 0.87mi |
| 1109 Hampton Ave Unit A Greenville, SC | 2.0 | 1.0 | 785 | $1,022 | $1.30 | 16d | 1 | 0.87mi |
| 1107 Hampton Avenue Ext Apt A Greenville, SC | 2.0 | 1.0 | 750 | $1,175 | $1.57 | 25d | 1 | 0.88mi |
| 1103 Hampton Ave Unit D Greenville, SC | 2.0 | 1.0 | 700 | $917 | $1.31 | 25d | 1 | 0.90mi |
| 1103 Hampton Ave Unit D Greenville, SC | 2.0 | 1.0 | 750 | $1,000 | $1.33 | 16d | 1 | 0.90mi |
| 1101 Hampton Avenue Ext Unit b Greenville, SC | 2.0 | 1.0 | 785 | $1,022 | $1.30 | 4d | 1 | 0.93mi |
| 1101 Hampton Avenue Ext Unit 1107-A Greenville, SC | 2.0 | 1.0 | 700 | $917 | $1.31 | 25d | 1 | 0.93mi |
| 1101 Hampton Avenue Ext Unit c Greenville, SC | 2.0 | 1.0 | 785 | $1,022 | $1.30 | 16d | 1 | 0.93mi |
| 1101 Hampton Avenue Ext Greenville, SC | 2.0 | 1.0 | 742 | $1,011 | $1.36 | 4d | 5 | 0.93mi |
| 19 Saco St Greenville, SC | 2.0 | 2.0 | 1050 | $2,400 | $2.29 | 25d | 1 | 0.94mi |
| 317 Douthit St Greenville, SC | 2.0 | 1.0 | 825 | $1,095 | $1.33 | 5d | 1 | 0.95mi |
| 41 Burdette St #1 Greenville, SC | 3.0 | 2.0 | 1148 | $1,500 | $1.31 | 25d | 1 | 1.00mi |
| 420 Oscar St Greenville, SC | 3.0 | 2.0 | 1400 | $1,800 | $1.29 | 5d | 1 | 1.07mi |
| 802 Hampton Ave Unit A Greenville, SC | 2.0 | 1.0 | 900 | $1,300 | $1.44 | 25d | 1 | 1.08mi |
| 5001 Assembly View Cir Greenville, SC | 1.0–3.0 | 1.0–2.0 | 975 | $1,328 | $1.36 | 5d | 27 | 1.11mi |
| 9 Cone Crest Ct Greenville, SC | 2.0 | 1.0 | 818 | $1,350 | $1.65 | 23d | 1 | 1.13mi |
| 409 Pinckney St Apt 2D Greenville, SC | 2.0 | 1.0 | 900 | $1,300 | $1.44 | 5d | 1 | 1.13mi |
| 304 N Leach St Greenville, SC | 2.0 | 1.0 | 756 | $1,250 | $1.65 | 25d | 1 | 1.14mi |
| 3001 Lizzie Dr Greenville, SC | 1.0–3.0 | 1.0–2.0 | 976 | $1,118 | $1.15 | 25d | 1 | 1.19mi |
| 14 Pine Thicket Dr Greenville, SC | 3.0 | 2.5 | 1475 | $1,595 | $1.08 | 25d | 1 | 1.21mi |
| 103 Fernside Ct Greenville, SC | 3.0 | 2.5 | 1210 | $1,750 | $1.45 | 5d | 1 | 1.22mi |
| 4 Kilgore St Greenville, SC | 2.0 | 1.0 | 1050 | $1,500 | $1.43 | 25d | 1 | 1.24mi |
| 193 Marbella Cir Greenville, SC | 3.0 | 2.5–3.5 | 1676 | $1,829 | $1.09 | 5d | 7 | 1.25mi |
| 525 Hampton Townes Dr Unit 1 Greenville, SC | 3.0 | 2.5 | 1286 | $1,775 | $1.38 | 13d | 1 | 1.29mi |
| 125 Ledbetter St Unit B Greenville, SC | 3.0 | 2.0 | 1270 | $1,850 | $1.46 | 5d | 1 | 1.29mi |
| 403 McCrary St Greenville, SC | 2.0 | 1.0 | 868 | $1,200 | $1.38 | 5d | 1 | 1.37mi |
| 109 Virginia Ave Greenville, SC | 2.0 | 2.5 | 1134 | $1,699 | $1.50 | 25d | 1 | 1.40mi |
Listing history 16 events
-
2026-06-18status $115,000 Pending 69 DOM
-
2026-06-17days on market $115,000 Active 69 DOM
-
2026-06-16days on market $115,000 Active 68 DOM
-
2026-06-13days on market $115,000 Active 67 DOM
-
2026-06-13days on market $115,000 Active 66 DOM
-
2026-06-10days on market $115,000 Active 64 DOM
-
2026-06-09days on market $115,000 Active 63 DOM
-
2026-06-08days on market $115,000 Active 62 DOM
-
2026-06-07days on market $115,000 Active 61 DOM
-
2026-06-03days on market $115,000 Active 57 DOM
-
2026-06-03days on market $115,000 Active 56 DOM
-
2026-06-01days on market $115,000 Active 55 DOM
-
2026-05-31days on market $115,000 Active 54 DOM
-
2026-05-23price $115,000
-
2026-04-07$125,000 Active
-
1986-05-29soldstatus $7,500
ⓘ Source: listings_history table (triggers on properties + properties_extension) + one-shot
backfill from property_details.listing_events for pre-trigger history.
Tax reassessment forecast SC · Resets to sale price
- Current annual tax
- $655 · $55/mo
- Projected year-2 tax
- $656 · $55/mo
- Expected delta
- +$1/yr ($0/mo · 0.1%)
ⓘ Screening estimate from a state-policy table — verify with the county assessor before closing.
Climate risk First Street
- Flood 4/10 Moderate FEMA zone X (unshaded) · 13% chance over 30 yrs
- Wildfire 1/10 Low
- Heat 6/10 Major 7 d/yr ≥102°F today · 17 d/yr by 30 yrs out
- Wind 2/10 Low 0% chance of damaging wind over 30 yrs
- Air quality 4/10 Moderate 3 unhealthy d/yr today · 4 by 30 yrs out
Nearby sold comps map
Loading sold comps map…
Walkable amenities ~0.75 mi
Loading nearby amenities…
Taxation est. · year 1
- Rental income
- $17,927
- − Mortgage interest
- −$6,442
- − Property taxes
- −$655
- − Insurance
- −$575
- − Repairs & maintenance
- −$1,434
- − Management
- −$1,434
- − Depreciation
- −$3,345
- Taxable income
- $4,042
- Est. tax owed @ 24.0%
- −$970
- After-tax cash flow
- $4,726/yr
For passive investors: Depreciation is non-cash, so a rental often shows a tax loss while cash-flowing — sheltering income. Rental losses are passive: they offset passive income freely, and up to $25,000/yr can offset ordinary (W-2) income if you actively participate and your MAGI is under $100k (phasing out to $0 by $150k); unused losses carry forward. On sale, claimed depreciation is recaptured at up to 25%, and gains may owe capital-gains tax (a 1031 exchange can defer both). Figures are a year-1 estimate at your 24.0% rate — not tax advice; consult a CPA.
Schools (NCES district)
- District
- Greenville 01
- NCES district ID
- 4502310
- Math proficiency
- 44% ▼ -10.00%
- Reading proficiency
- 54% ▼ -2.00%
- Median HH income
- $49,596
- Composite
- 41.88/100
- National rank
- #3370
- State rank
- #10 of 80 in SC
Livability — City View
- Score
- 77/100
- State rank
- #20
- US rank
- #3185
Category grades
Schools grade is shown separately in the Schools card above.
Census & demographics
- Census place
- City View, SC
- County
- Greenville County · 573,815 people
- Metro
- Greenville-Anderson, SC
- Population (ZIP)
- 32,365
- Household income
- $51,565
- Rent vs Own
- Severe rent burden
- 1754.0
Population outlook (Greenville County) Hauer SSP2
- Today (2025)
- 574,580 people
- By 2030
- 615,615 · +7.1%
- By 2040
- 695,373 · +21.0%
- By 2050
- 769,367 · +33.9%
- By 2075
- 933,296 · +62.4%
- By 2100
- 1,029,196 · +79.1%
Race, ethnicity, and origin ACS 2023
- Neighborhood character
- Highly diverse neighborhood (Simpson 0.70)
- Race & ethnicity
- White 41% Black 29% Hispanic / Latino 22% Two or more races 12%
- Hispanic origin (detail)
- Mexican 12% Puerto Rican 2%
- Common ancestry
- Slovak 1% Italian 1% Serbian 1%
- Foreign-born
- 12% · Canada, Jamaica, China
- Languages at home
- 79% English-only · Spanish 19% Russian/Polish/Slavic 1%
Political lean MEDSL · Greenville
- 2024 margin
- Strong R (+22.2) · D 38.0% · R 60.2% · Other 1.8%
- 2008→2024 swing
- +1.7pp toward D · 2008: -23.9pp · 2024: -22.2pp
- All cycles
- 2024: R+22.2 2020: R+18.2 2016: R+24.7 2012: R+27.8 2008: R+23.9
Not yet ingested
- Civics
- —
Market trends
- HPI YoY
- ▼ -139.58%
- Current HPI
- 264.2891
- Rent YoY
- ▲ 1.72%
- Metro
- Greenville-Anderson, SC
- State GDP YoY
- ▲ 4.51%
- F500 in state
- 2
Industry mix (Fortune 500 HQ in SC)
| Industry | F500 HQs | Revenue |
|---|---|---|
| Packaging | 1 | $7B |
|
||
Price history
+1433.3% since first listed3 events — show timeline
- 2026-05-23 Price Changed $115,000 Greater Greenville MLS
- 2026-04-07 Listed $125,000 Greater Greenville MLS
- 1986-05-29 Sold (Public Records) $7,500 Public Records
Property tax history
+1.9%/yrLatest (2025): $655 · +2.3% YoY. Source: county tax records.
Cash-flow waterfall
monthlySold comps — $/sqft
last 12 mo · ≤1 miLoading sold comps…