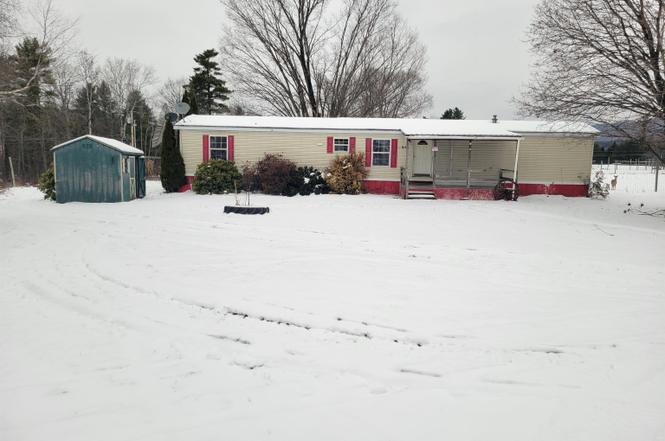
180 Stratton Rd · Rutland, VT
Flood risk 5/10 · Moderate
- FEMA flood zone
- X (unshaded)
- Chance of flooding over 30 yrs
- 0.67%
- Est. flood insurance / yr
- $473 – $860
Fire risk 1/10 · Minimal
- Est. fire insurance / yr
- $480 – $892
Heat risk 2/10 · Minimal
- Hot days now (above 89°F)
- 7 days/yr
- Hot days in 30 yrs
- 16 days/yr
Wind risk 2/10 · Minimal
- Chance of severe wind over 30 yrs
- 4.0%
Air-quality risk 1/10 · Minimal
- Unhealthy air days now
- 0 days/yr
- Unhealthy air days in 30 yrs
- 0 days/yr
Risk factors via First Street. Map © Google.
Why this score? — see what drove the B+ grade
The composite is a weighted blend of 9 inputs, each scored 0–100. Each bar is that input's sub-score; the figure is the points it added to the 100-point composite (weight × sub-score).
- Cash flow +30.0/30.0
- 1% rule +10.0/10.0
- DSCR +10.0/10.0
- ARV discount +7.5/15.0
- Appreciation +5.0/10.0
- Schools +5.0/10.0
- Livability +4.0/5.0
- Rent growth +2.5/5.0
- Condition / age +2.5/5.0
$34,955
🖨 Deal sheet (PDF) 📄 Offer letter ✓ Due diligence
Listing remarks
3 Bedroom 2 Bath Mobile home in good condition being sold "as is. "
Key facts
- Built 2007
- Listed 2 days
Property features AI
Finance
- Other: Road access via gravel, private, shared, unpaved and privately maintained roads; Mobile is anchored; Survey status unknown; Directions: From Route 7 in Rutland take Cold River Rd next to the EconoLodge. Follow to end and take a left onto Stratton Rd. Go 2/10 mile and turn right, 2nd house on the left.
- Financial info: Property is foreclosed / bank-owned (REO)
- HOA & community: Monthly fee of 500 covering plowing, sewer, water and park rent; Mobile park approval in place
Exterior
- Parking: Gravel driveway
- Utilities: Private water; Septic system; 100 Amp electrical service with circuit breakers; Cable internet available; Cable available; LP/bottle gas available
- Home design: Manufactured/mobile home; Existing construction; Beige exterior; Shingle (asphalt) roof
- Construction: Built in 2007; Wood frame construction; Vinyl siding
- Exterior features: Country setting with mountain views; Level, open lot; Near hospital
Interior
- Kitchen: Dishwasher; Electric range; Refrigerator
- Flooring: Carpet; Vinyl
- Bathrooms: 2 full bathrooms
- Heating & cooling: Forced air heating
- Interior features: 7 total rooms; Carpet and vinyl flooring
- Laundry & utility: Washer; Dryer
Neighborhood map
What this means for you Summary
Snapshot
- This is a 3-bed/1.0-bath single-family listed at $35k.
Deal economics
- At list price, monthly cash flow is $282 ($3k/yr) — positive.
- The deal already cash-flows at list — no discount required.
- Meets the 1% rule at list price ($1k rent vs $35k).
- Cap rate 16.0% vs local median 4.3% in Rutland — top-decile yield for the area; either an underpriced asset or a hidden risk that comps aren't pricing in. Stress-test before assuming the spread holds.
Location & tenants
- Location reads 81/100 on livability (#6 in VT, #1,410 nationally) — a professional / high-income tenant draw. Strengths: commute A+, cost of living A+, health & safety A+; Watch: employment C-, crime F.
- Zoned schools: Rutland Intermediate School (math 22% / reading 32%, grade F, #151 of 192 statewide, top 82%, 493 students, 54% FRL).
- Market conditions: 1 active listings in the ZIP; 90 units permitted in Rutland County in 2024 (0 in 5+ unit buildings).
Forward outlook
- In year one you build about $1k of equity ($241 loan paydown + $1k appreciation (3.0% local appreciation)).
- Rutland County population projected at -28% by 2050 — secular population decline; favor cash flow + early exit over multi-decade hold.
- At projected returns (3.0% appreciation + 3.0% rent growth), your $10k cash investment doubles in ~3 years — after that, you're playing with house money.
Negotiation context
- Only 2 days on market — expect competitive offers; lowballing is unlikely to land.
Risks & watch-outs
- Watch-outs: HOA is 39% of rent.
- Climate carrying-cost: moderate flood risk — expect insurance premiums to compound above CPI over the hold.
Questions for the listing agent
- What does the HOA fee cover, when was the last increase, and are there any pending special assessments or reserve-fund shortfalls?
- Is there a deadline driving the sale (1031 exchange, divorce, estate, relocation)? That informs how much negotiation room exists.
- Schools are A-rated — typically a magnet for longer-tenancy family renters. What's the average tenant stay here, and is there a school-zone premium baked into asking?
- Crime grade is F in this area — have there been break-ins, vandalism, or insurance claims at this property in the last 3 years? What carrier currently insures it and at what premium?
- What's the average days-on-market for RENTAL listings here right now (not sales)? A rising rental-DOM trend means longer vacancies and softer asking-rent achievability than the comps imply.
- What's the recent tenant-quality profile in this submarket — average credit score on applications, eviction rate, late-payment / NSF rate, and stable-employment percentage? A property-management company in the area should have these aggregated.
- How much new for-sale + rental construction is in the pipeline within 1–3 miles? Heavy new supply typically softens prices + rents 12–24 months out; constrained supply supports both.
Investment metrics
- 1% rule
- 3.71% ✓
- Cap rate
- 15.97%
- Cash-on-cash
- 34.57%
- DSCR
- 2.54
- GRM
- 2.2
CMA / ARV
- ARV (on-the-fly)
- $315,000
- Comps found
- 12
Show comp detail 12 sales within ~0.75 mi
| Address | Dist | Beds/Ba | Sqft | Sold | Price | $/sf | Match |
|---|---|---|---|---|---|---|---|
| 3 Brightview Ave | 0.42mi | 3/2.0 | 1,757 (+0%) | 4mo | $412,500 | $235 | 72 |
| 4 Lyman Ave | 0.41mi | 3/2.0 | 1,710 (-2%) | 6mo | $425,000 | $249 | 69 |
| 12 Brightview Ave | 0.50mi | 3/2.0 | 1,770 (+1%) | 8mo | $275,000 | $155 | 64 |
| 68 Jackson Ave | 0.48mi | 4/2.0 (+1) | 1,890 (+8%) | 1mo | $320,000 | $169 | 55 |
| 11 Southern Blvd | 0.38mi | 4/2.0 (+1) | 1,884 (+8%) | 8mo | $339,000 | $180 | 54 |
| 20 Brightview Ave | 0.56mi | 3/2.0 | 1,914 (+9%) | 2mo | $386,000 | $202 | 53 |
| 54 E Center St | 0.60mi | 3/2.0 | 1,617 (-8%) | 8mo | $297,000 | $184 | 49 |
| 51 Engrem Ave | 0.51mi | 3/2.0 | 1,536 (-12%) | 5mo | $100,000 | $65 | 48 |
| 84 Allen St | 0.61mi | 4/1.0 (+1) | 1,557 (-11%) | 1mo | $248,000 | $159 | 47 |
| 6 Brentwood Dr | 0.69mi | 3/1.5 | 1,872 (+7%) | 9mo | $300,000 | $160 | 47 |
| 38 East St | 0.70mi | 4/3.0 (+1) | 1,832 (+5%) | 8mo | $280,000 | $153 | 40 |
| 6 Charter Hill Dr | 0.67mi | 2/2.5 (-1) | 1,542 (-12%) | 2mo | $340,000 | $220 | 37 |
Match score weights: distance 35% · size 25% · config 20% · recency 20%. Top-matched comps best support the ARV.
Projected returns pro-forma
3.0% appreciation · 3.0% rent growth · sell at horizon
- IRR
- 40.6%
- Equity multiple
- 3.30×
- Total profit
- $22,495
- Equity at exit
- $15,717
- IRR
- 40.8%
- Equity multiple
- 6.66×
- Total profit
- $55,367
- Equity at exit
- $24,222
Cash invested: $9,787 (down + closing). Projections, not guarantees.
Landlord ↔ Tenant lean methodology
- Overall (STATE)
- 41 Moderately Tenant-Leaning
- State Vermont
- 41 Moderately Tenant-Leaning · D+15
- County
- — inherits STATE
- City
- — inherits STATE
ZIP-level market 05755
- Active inventory
- 1
- Price-to-rent
- 2.2×
Monthly cashflow live
- Estimated rent
- $1,296 medium interval (Pro) →
- Mortgage (P&I)
- −$183
- Tax est. 1.5%
- −$44 /mo · $524/yr
- Insurance
- −$15
- HOA
- −$500
- Vacancy / Maint / Mgmt
- −$272
- Net cashflow
- $282
Break-even live
Sensitivity live
| Price | -10% $306 | -5% $294 | +0% $282 | +5% $270 | +10% $258 |
|---|---|---|---|---|---|
| Rent | -10% $180 | -5% $231 | +0% $282 | +5% $333 | +10% $384 |
| Rate | -1.0pp $300 | -0.5pp $291 | base $282 | +0.5pp $273 | +1.0pp $264 |
UW: 25.0% down · 7.5% · 30yr · 1.5% tax · 5.0% vac · 8.0% maint · 8.0% mgmt
Financing live
Cash to close
- Down payment
- $8,739
- Closing costs
- $1,049
- Reserves months
- —
- Total cash needed
- —
Loan-product check · same deal, 3 products live
Conventional
25% down · 7.5% · 30yr
- Down + closing
- —
- Monthly P&I
- —
- Monthly cashflow
- —
- DSCR
- —
- Eligible?
- —
Personal DTI + credit; lowest rate.
DSCR
20% down · 8.5% · 30yr
- Down + closing
- —
- Monthly P&I
- —
- Monthly cashflow
- —
- DSCR
- —
- Eligible?
- —
No personal income docs; deal must DSCR.
Hard money
10% down · 12.0% · 12mo
- Down + closing
- —
- Monthly P&I
- —
- Monthly cashflow
- —
- DSCR
- —
- Eligible?
- —
Short-term bridge; refi at stabilization.
HOA detail
- Monthly dues
- $500 · $6,000/yr
Listing history 3 events
-
2026-06-21statusdays on market $34,955 Pending 2 DOM
-
2026-06-17remarks 67-char remark
-
2026-06-17$34,955 Active 1 DOM
ⓘ Source: listings_history table (triggers on properties + properties_extension) + one-shot
backfill from property_details.listing_events for pre-trigger history.
Climate risk First Street
- Flood 5/10 Major FEMA zone X (unshaded) · 67% chance over 30 yrs
- Wildfire 1/10 Low
- Heat 2/10 Low 7 d/yr ≥89°F today · 16 d/yr by 30 yrs out
- Wind 2/10 Low 4% chance of damaging wind over 30 yrs
- Air quality 1/10 Low 0 unhealthy d/yr today · 0 by 30 yrs out
Nearby sold comps map
Loading sold comps map…
Walkable amenities ~0.75 mi
Loading nearby amenities…
Taxation est. · year 1
- Rental income
- $15,547
- − Mortgage interest
- −$1,958
- − Property taxes
- −$524
- − Insurance
- −$175
- − Repairs & maintenance
- −$1,244
- − Management
- −$1,244
- − HOA
- −$6,000
- − Depreciation
- −$1,017
- Taxable income
- $3,385
- Est. tax owed @ 24.0%
- −$813
- After-tax cash flow
- $2,571/yr
For passive investors: Depreciation is non-cash, so a rental often shows a tax loss while cash-flowing — sheltering income. Rental losses are passive: they offset passive income freely, and up to $25,000/yr can offset ordinary (W-2) income if you actively participate and your MAGI is under $100k (phasing out to $0 by $150k); unused losses carry forward. On sale, claimed depreciation is recaptured at up to 25%, and gains may owe capital-gains tax (a 1031 exchange can defer both). Figures are a year-1 estimate at your 24.0% rate — not tax advice; consult a CPA.
Schools (NCES district)
No district data.
Livability — Rutland
- Score
- 81/100
- State rank
- #6
- US rank
- #1410
Category grades
Schools grade is shown separately in the Schools card above.
Census & demographics
- Census place
- Rutland, VT
Population outlook (Rutland County) Hauer SSP2
- Today (2025)
- 55,307 people
- By 2030
- 52,364 · -5.3%
- By 2040
- 45,751 · -17.3%
- By 2050
- 39,627 · -28.4%
- By 2075
- 29,080 · -47.4%
- By 2100
- 20,673 · -62.6%
Not yet ingested
- Political lean
- —
- Race & ethnicity
- —
- Common origin
- —
- Civics
- —
Market trends
- HPI YoY
- —
- Current HPI
- —
- Rent YoY
- —
- Metro
- —
- State GDP YoY
- —
- F500 in state
- 0
Price history
-12.4% since first listed3 events — show timeline
- 2026-06-17 Listed $34,955 PrimeMLS
- 2026-03-31 Price Changed $29,995 PrimeMLS
- 2018-07-08 Price Changed $39,900 PrimeMLS
Property tax history
+18.9%/yrLatest (2024): $2,867 · +10.7% YoY. Source: county tax records.
Cash-flow waterfall
monthlySold comps — $/sqft
last 12 mo · ≤1 miLoading sold comps…