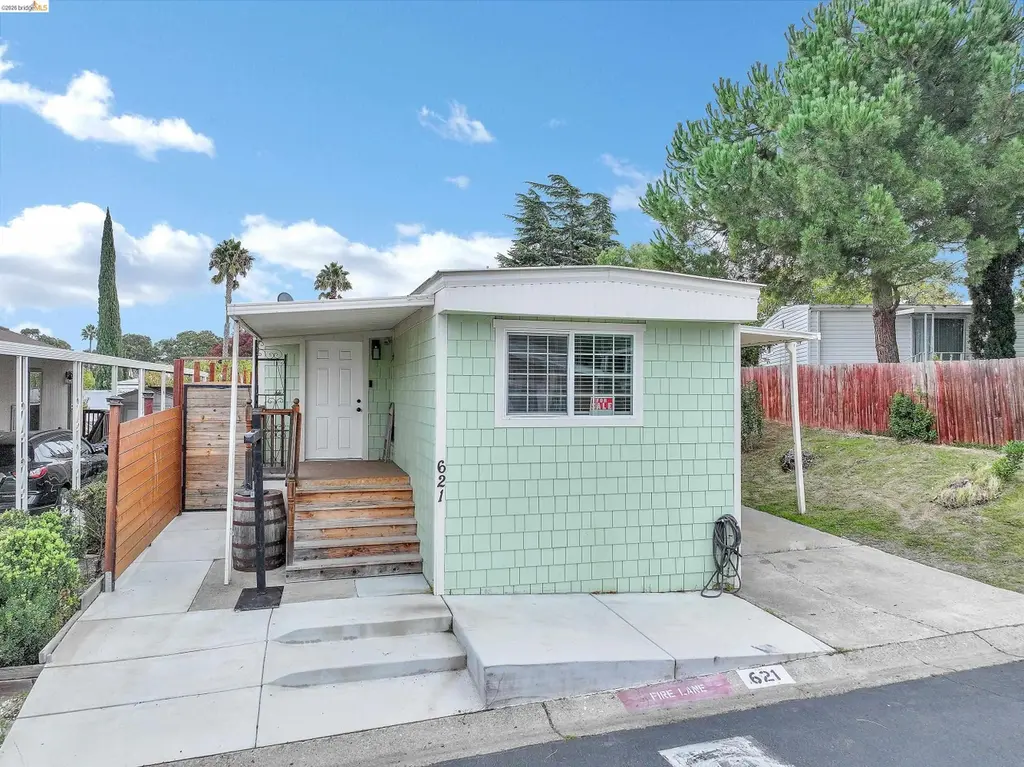
621 Bounty · Bay Point, CA
Flood risk 1/10 · Minimal
- FEMA flood zone
- X (unshaded)
- Chance of flooding over 30 yrs
- 0.0%
- Est. flood insurance / yr
- $507 – $1,088
Fire risk 6/10 · Moderate
- Est. fire insurance / yr
- $659 – $1,223
Heat risk 5/10 · Moderate
- Hot days now (above 98°F)
- 7 days/yr
- Hot days in 30 yrs
- 14 days/yr
Wind risk 1/10 · Minimal
- Chance of severe wind over 30 yrs
- —
Air-quality risk 9/10 · Severe
- Unhealthy air days now
- 18 days/yr
- Unhealthy air days in 30 yrs
- 19 days/yr
Risk factors via First Street. Map © Google.
Why this score? — see what drove the C grade
The composite is a weighted blend of 9 inputs, each scored 0–100. Each bar is that input's sub-score; the figure is the points it added to the 100-point composite (weight × sub-score).
- Cash flow +28.2/30.0
- DSCR +10.0/10.0
- 1% rule +7.8/10.0
- Condition / age +4.0/5.0
- Schools +3.8/10.0
- Livability +2.9/5.0
- Rent growth +2.8/5.0
- ARV discount +0.0/15.0
- Appreciation +0.0/10.0
$183,000
🖨 Deal sheet 📄 Offer letter ✓ Due diligence
Listing remarks
Beautifully Remodeled Modern Home! Step inside this stunning move-in ready manufactured home featuring a bright open floor plan, recessed lighting, and flooring throughout. The sleek, fully renovated kitchen boasts white shaker cabinets, quartz countertops, designer backsplash, pendant lighting, much more. Enjoy the inviting living room with a custom-built media wall and modern electric fireplace — perfect for relaxing or entertaining. The updated bathroom offers a spa-inspired feel with subway tile, rainfall shower, matte black fixtures, and a lighted vanity mirror. Spacious bedrooms include custom closet organizers and plenty of natural light. Every inch of this home showcases quali
Key facts
- Open floor plan
- Quartz countertops
- Designer backsplash
Tags
Property features AI
Finance
- HOA & community: Park name: MARINERS COVE; Pets allowed with approval; cats and dogs OK with size limits; Community amenities include clubhouse, playground, pool, laundry
Exterior
- Parking: 9 garage/carport spaces; Carport for 2 or more vehicles; 9 covered parking spaces
- Security: Pet restrictions apply (park rules)
- Utilities: Public water; Public sewer
- Home design: Manufactured in park (mobile home); Single wide model; Entry facing information not provided
- Construction: Wood siding; Skirted with wood; Crawl space foundation
- Exterior features: Back yard; Fenced; Community pool; Clubhouse and playground in the park community; Community laundry
Interior
- Kitchen: Kitchen island; Solid surface countertops; Microwave
- Bedrooms: Total rooms: 5
- Flooring: Wood flooring
- Bathrooms: 1 full bathroom with stall shower and tile; Updated bathroom finishes
- Heating & cooling: Forced air heating; Central air conditioning
- Interior features: Solid surface counters; No additional rooms; Electric fireplace in family room
- Laundry & utility: Washer/dryer hookups only; Gas water heater
Neighborhood map
What this means for you Summary
Snapshot
- This is a 2-bed/1.0-bath manufactured listed at $183k. Condition is rated good.
Deal economics
- At list price, monthly cash flow is $581 ($7k/yr) — positive.
- The deal already cash-flows at list — no discount required.
- Meets the 1% rule at list price ($2k rent vs $183k).
- Recommended offer: $180k (1.5% below list) — sets the bar for market timing.
- Cap rate 10.1% vs local median 3.7% in Bay Point — top-decile yield for the area; either an underpriced asset or a hidden risk that comps aren't pricing in. Stress-test before assuming the spread holds.
Location & tenants
- Location reads 57/100 on livability (#736 in CA) — a working-class tenant base; expect higher turnover. Strengths: housing A+, employment B+, health & safety B+; Watch: schools F, crime F, amenities F.
- Mt. Diablo Unified (suburban): math 36% / reading 45% proficiency, ranked #202 of 517 in CA (top 39%) — families likely to look elsewhere, expect single-tenant / working-renter base with shorter leases.
- Market conditions: Rents rising (+1.1%/yr); 265 active listings in the ZIP; 1 comparable units currently listed for rent nearby; solid renter incomes; 2,169 units permitted in Contra Costa County in 2024 (896 in 5+ unit buildings).
Forward outlook
- Local home prices are declining (-3.0%/yr); year-one equity from $1k of loan paydown is wiped out by about $5k of value loss. Plan a longer hold.
- Contra Costa County population projected at +26% by 2050 — long-run rental-demand tailwind backs the buy-and-hold thesis.
Negotiation context
- It's been on market 26 days — a 2% lower offer ($180k) is reasonable based on typical stale-listing flexibility.
- 2 sale attempts with the ask held roughly flat each time — persistent listings suggest the price (not the market) is what's stuck; bring a comps-based counter.
Risks & watch-outs
- Climate carrying-cost: major wildfire risk; extreme-heat days projected 7→14/yr by 2055 (HVAC capex compounding) — expect insurance premiums to compound above CPI over the hold.
Questions for the listing agent
- Built in 1977 — when were the roof, HVAC, electrical panel, plumbing, and water heater last replaced?
- Is there a deadline driving the sale (1031 exchange, divorce, estate, relocation)? That informs how much negotiation room exists.
- Schools are F-rated, which usually means shorter tenancies and higher turnover. Who's the typical renter profile here, and what's been the actual vacancy rate?
- Crime grade is F in this area — have there been break-ins, vandalism, or insurance claims at this property in the last 3 years? What carrier currently insures it and at what premium?
- What's the average days-on-market for RENTAL listings here right now (not sales)? A rising rental-DOM trend means longer vacancies and softer asking-rent achievability than the comps imply.
- What's the recent tenant-quality profile in this submarket — average credit score on applications, eviction rate, late-payment / NSF rate, and stable-employment percentage? A property-management company in the area should have these aggregated.
- How much new for-sale + rental construction is in the pipeline within 1–3 miles? Heavy new supply typically softens prices + rents 12–24 months out; constrained supply supports both.
Investment metrics
- 1% rule
- 1.28% ✓
- Cap rate
- 10.10%
- Cash-on-cash
- 13.61%
- DSCR
- 1.61
- GRM
- 6.5
CMA / ARV
- ARV (on-the-fly)
- $154,800
- Comps found
- 2
Show comp detail 2 sales within ~0.75 mi
| Address | Dist | Beds/Ba | Sqft | Sold | Price | $/sf | Match |
|---|---|---|---|---|---|---|---|
| 744 Treasure Dr | 0.09mi | 2/2.0 | 768 (+7%) | 4mo | $165,000 | $215 | 78 |
| 55 Pacifica Ave #142 | 0.57mi | 2/2.0 | 780 (+8%) | 13mo | $165,000 | $212 | 45 |
Match score weights: distance 35% · size 25% · config 20% · recency 20%. Top-matched comps best support the ARV.
Projected returns pro-forma
-3.0% appreciation · 1.11% rent growth · sell at horizon
- IRR
- 1.6%
- Equity multiple
- 1.06×
- Total profit
- $3,021
- Equity at exit
- $27,286
- IRR
- 9.2%
- Equity multiple
- 1.65×
- Total profit
- $33,191
- Equity at exit
- $15,822
Cash invested: $51,240 (down + closing). Projections, not guarantees.
Landlord ↔ Tenant lean methodology
- Overall (STATE)
- 18 Strongly Tenant-Friendly
- State California
- 18 Strongly Tenant-Friendly · D+13
- County
- — inherits STATE
- City
- — inherits STATE
ZIP-level market 94565
- Rents YoY
- 1.1%
- Active inventory
- 265
- Price-to-rent
- 6.5×
Monthly cashflow live
- Estimated rent
- $2,336 medium interval (Pro) →
- Mortgage (P&I)
- −$960
- Tax est. 1.5%
- −$229 /mo · $2,745/yr
- Insurance
- −$76
- HOA
- −$0
- Vacancy / Maint / Mgmt
- −$491
- Net cashflow
- $581
Break-even live
UW: 25.0% down · 7.5% · 30yr · 1.5% tax · 5.0% vac · 8.0% maint · 8.0% mgmt
Financing live
Cash to close
- Down payment
- $45,750
- Closing costs
- $5,490
- Reserves months
- —
- Total cash needed
- —
Loan-product check · same deal, 3 products live
Conventional
25% down · 7.5% · 30yr
- Down + closing
- —
- Monthly P&I
- —
- Monthly cashflow
- —
- DSCR
- —
- Eligible?
- —
Personal DTI + credit; lowest rate.
DSCR
20% down · 8.5% · 30yr
- Down + closing
- —
- Monthly P&I
- —
- Monthly cashflow
- —
- DSCR
- —
- Eligible?
- —
No personal income docs; deal must DSCR.
Hard money
10% down · 12.0% · 12mo
- Down + closing
- —
- Monthly P&I
- —
- Monthly cashflow
- —
- DSCR
- —
- Eligible?
- —
Short-term bridge; refi at stabilization.
Rent comps 1 comps
| Address | Beds | Baths | Sqft | Rent | $/sqft | DOM | Units | Dist |
|---|---|---|---|---|---|---|---|---|
| 1123 Shoreview Ct Bay Point, CA | 1.0–3.0 | 1.0–2.0 | 824 | $2,417 | $2.93 | 2d | 9 | 0.92mi |
Listing history 18 events
-
2026-06-18days on market $183,000 Active 26 DOM
-
2026-06-17days on market $183,000 Active 25 DOM
-
2026-06-16days on market $183,000 Active 24 DOM
-
2026-06-15days on market $183,000 Active 23 DOM
-
2026-06-13days on market $183,000 Active 21 DOM
-
2026-06-13days on market $183,000 Active 20 DOM
-
2026-06-10days on market $183,000 Active 17 DOM
-
2026-06-08days on market $183,000 Active 16 DOM
-
2026-06-07days on market $183,000 Active 15 DOM
-
2026-06-04days on market $183,000 Active 12 DOM
-
2026-06-03days on market $183,000 Active 11 DOM
-
2026-06-02days on market $183,000 Active 10 DOM
-
2026-06-01days on market $183,000 Active 9 DOM
-
2026-05-31days on market $183,000 Active 8 DOM
-
2026-05-23$183,000 Active
-
2025-05-30historical
-
2025-04-15price
-
2025-02-05Active
ⓘ Source: listings_history table (triggers on properties + properties_extension) + one-shot
backfill from property_details.listing_events for pre-trigger history.
Climate risk First Street
- Flood 1/10 Low FEMA zone X (unshaded) · 0% chance over 30 yrs
- Wildfire 6/10 Major
- Heat 5/10 Major 7 d/yr ≥98°F today · 14 d/yr by 30 yrs out
- Wind 1/10 Low
- Air quality 9/10 Extreme 18 unhealthy d/yr today · 19 by 30 yrs out
Nearby sold comps map
Loading sold comps map…
Walkable amenities ~0.75 mi
Loading nearby amenities…
Taxation est. · year 1
- Rental income
- $28,035
- − Mortgage interest
- −$10,251
- − Property taxes
- −$2,745
- − Insurance
- −$915
- − Repairs & maintenance
- −$2,243
- − Management
- −$2,243
- − Depreciation
- −$5,324
- Taxable income
- $4,315
- Est. tax owed @ 24.0%
- −$1,036
- After-tax cash flow
- $5,936/yr
For passive investors: Depreciation is non-cash, so a rental often shows a tax loss while cash-flowing — sheltering income. Rental losses are passive: they offset passive income freely, and up to $25,000/yr can offset ordinary (W-2) income if you actively participate and your MAGI is under $100k (phasing out to $0 by $150k); unused losses carry forward. On sale, claimed depreciation is recaptured at up to 25%, and gains may owe capital-gains tax (a 1031 exchange can defer both). Figures are a year-1 estimate at your 24.0% rate — not tax advice; consult a CPA.
Condition & rehab AI · 1 photo
This beautifully remodeled manufactured home is move-in ready with modern finishes and a fresh exterior. Minor updates to the exterior and landscaping can further enhance its appeal and value.
Value-add opportunities
- Both Painting the exterior — Enhances curb appeal and can add value.
- Both Landscaping improvements — Enhances curb appeal and can add value.
- Both Add a small front porch — Can increase curb appeal and provide a welcoming entrance.
Renovation cost estimate screening
Value-add ROI direction
- Both Painting the exterior — Enhances curb appeal and can add value. ↑
- Both Landscaping improvements — Enhances curb appeal and can add value. ↑
- Both Add a small front porch — Can increase curb appeal and provide a welcoming entrance. ↑
ⓘ Cost ranges are severity-bucket heuristics (US national rule-of-thumb). Get contractor quotes + a written scope before underwriting a rehab budget.
Schools (NCES district)
- District
- Mt. Diablo Unified
- NCES district ID
- 0626370
- Math proficiency
- 36% ▼ -2.00%
- Reading proficiency
- 45% ▼ -5.00%
- Median HH income
- $77,494
- Composite
- 37.5/100
- National rank
- #4401
- State rank
- #202 of 517 in CA
Livability — Bay Point
- Score
- 57/100
- State rank
- #736
- US rank
- #21661
Category grades
Schools grade is shown separately in the Schools card above.
Census & demographics
- Census place
- Bay Point, CA
- County
- Contra Costa County · 1,059,880 people
- Metro
- San Francisco-Oakland-Berkeley, CA
- Population (ZIP)
- 100,488
- Household income
- $95,556
- Rent vs Own
- Severe rent burden
- 3942.0
Population outlook (Contra Costa County) Hauer SSP2
- Today (2025)
- 1,287,720 people
- By 2030
- 1,364,937 · +6.0%
- By 2040
- 1,506,209 · +17.0%
- By 2050
- 1,624,373 · +26.1%
- By 2075
- 1,853,193 · +43.9%
- By 2100
- 1,901,231 · +47.6%
Race, ethnicity, and origin ACS 2023
- Neighborhood character
- Diverse neighborhood (Simpson 0.70)
- Race & ethnicity
- Hispanic / Latino 48% Two or more races 19% Asian 17% White 16% Black 13% Pacific Islander 1% Native American 1%
- Hispanic origin (detail)
- Mexican 38% Puerto Rican 1%
- Common ancestry
- Italian 1% Russian 1% Lithuanian 1%
- Foreign-born
- 34% · Canada, China, Vietnam
- Languages at home
- 47% English-only · Spanish 37% Tagalog/Filipino 6% Other Indo-European 4%
Political lean MEDSL · Contra Costa
- 2024 margin
- Solid D (+38.0) · D 67.3% · R 29.4% · Other 3.3%
- 2008→2024 swing
- +0.2pp no change · 2008: 37.8pp · 2024: 38.0pp
- All cycles
- 2024: D+38.0 2020: D+45.3 2016: D+43.5 2012: D+33.7 2008: D+37.8
Not yet ingested
- Civics
- —
Market trends
- HPI YoY
- ▼ -478.40%
- Current HPI
- 376.2576
- Rent YoY
- ▲ 1.11%
- Metro
- San Francisco-Oakland-Berkeley, CA
- State GDP YoY
- ▲ 3.21%
- F500 in state
- 116
Industry mix (Fortune 500 HQ in CA)
| Industry | F500 HQs | Revenue |
|---|---|---|
| Technology | 27 | $1,492B |
|
||
| Financial Services | 3 | $174B |
|
||
| Retail | 3 | $44B |
|
||
| Insurance | 3 | $26B |
|
||
| Media / Entertainment | 2 | $115B |
|
||
| Pharmaceuticals / Biotech | 2 | $62B |
|
||
Price history
4 events — show timeline
- 2026-05-23 Listed $183,000 bridgeMLS, Bay East AOR, or Contra Costa AOR
- 2025-05-30 Listing Removed — bridgeMLS, Bay East AOR, or Contra Costa AOR
- 2025-04-15 Price Changed — bridgeMLS, Bay East AOR, or Contra Costa AOR
- 2025-02-05 Listed — bridgeMLS, Bay East AOR, or Contra Costa AOR
Cash-flow waterfall
monthlySold comps — $/sqft
last 12 mo · ≤1 miLoading sold comps…