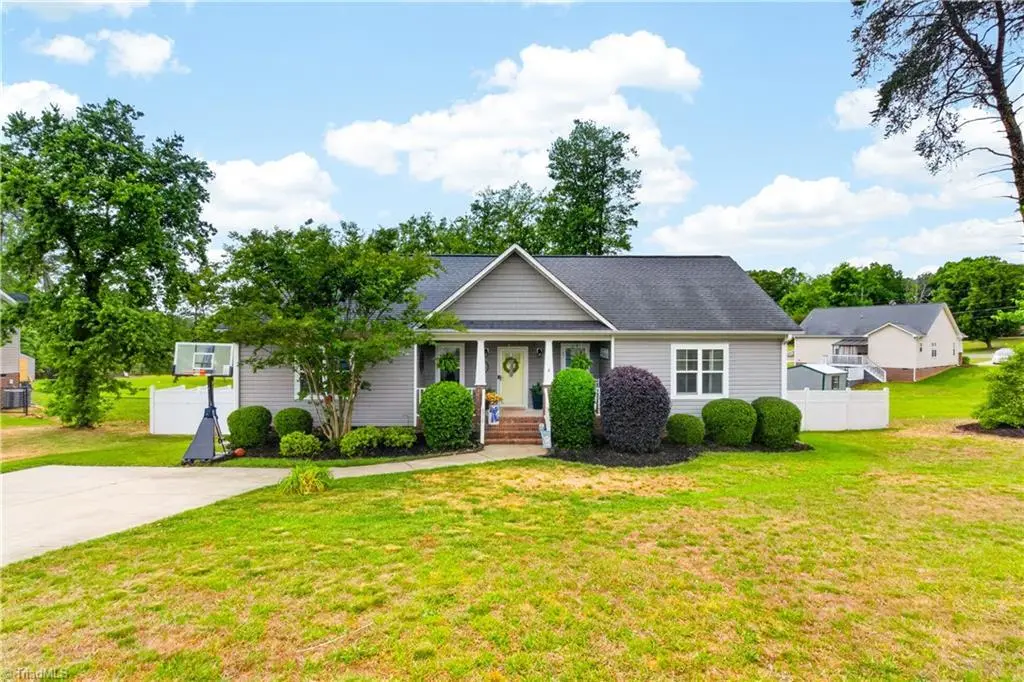
4319 Brown Oaks Rd · Randleman, NC
Flood risk 1/10 · Minimal
- FEMA flood zone
- X (unshaded)
- Chance of flooding over 30 yrs
- 0.0%
- Est. flood insurance / yr
- $507 – $1,088
Fire risk 4/10 · Minor
- Est. fire insurance / yr
- $906 – $1,684
Heat risk 5/10 · Moderate
- Hot days now (above 103°F)
- 7 days/yr
- Hot days in 30 yrs
- 17 days/yr
Wind risk 5/10 · Moderate
- Chance of severe wind over 30 yrs
- 21.0%
Air-quality risk 2/10 · Minimal
- Unhealthy air days now
- 1 days/yr
- Unhealthy air days in 30 yrs
- 1 days/yr
Risk factors via First Street. Map © Google.
Why this score? — see what drove the C- grade
The composite is a weighted blend of 9 inputs, each scored 0–100. Each bar is that input's sub-score; the figure is the points it added to the 100-point composite (weight × sub-score).
- Cash flow +19.5/30.0
- ARV discount +9.4/15.0
- DSCR +6.2/10.0
- 1% rule +4.5/10.0
- Schools +3.6/10.0
- Livability +3.4/5.0
- Rent growth +2.5/5.0
- Condition / age +2.5/5.0
- Appreciation +0.0/10.0
$280,000
🖨 Deal sheet (PDF) 📄 Offer letter ✓ Due diligence
Listing remarks MLS
Brand new 3 bedroom/2 bath home with split floor plan featuring large open family room, dining room and kitchen with island in center. On the right master bedroom has large walk in closet and master bath suite has a double bowl vanity and shower. On left are 2 bedrooms with bathroom. Large front porch for your rocking chairs for relaxing and deck at back for entertaining . Excellent location near downtown Randleman with quick access to I-73 and Hwy 311. This is a must see, call today for an appointment.
Key facts
- 0.46 acre lot
- Built 2014
- Listed 44 days
Property features AI
Finance
- Other: Approximate building area: 1,448 (listed)
- HOA & community: No homeowners association
Exterior
- Parking: Driveway
- Utilities: Public water; Public sewer; Electric water heater
- Home design: Residential stick/site-built house; One-story
- Construction: Built in 2014; Vinyl siding; Crawl space foundation
- Exterior features: Public-maintained road access; Lot in the North Fork subdivision; Lot number 4
Interior
- Bathrooms: Two full bathrooms
- Heating & cooling: Central air conditioning; Forced air heat; Heat pump; Electric heating fuel
- Interior features: Primary bedroom on the main level
- Laundry & utility: Electric water heater
Neighborhood map
What this means for you Summary
Snapshot
- This is a 3-bed/2.0-bath single-family listed at $280k.
Deal economics
- At list price, monthly cash flow is $317 ($4k/yr) — positive.
- The deal already cash-flows at list — no discount required.
- To meet the 1% rule (rent ≥ 1% of price), the offer needs to be $266k (5.1% below list).
- Recommended offer: $266k (5.1% below list) — sets the bar for 1% rule.
- Cap rate 7.6% vs local median 3.7% in Randleman — top-decile yield for the area; either an underpriced asset or a hidden risk that comps aren't pricing in. Stress-test before assuming the spread holds.
Location & tenants
- Location reads 67/100 on livability (#242 in NC) — a middle-class / working-renter tenant base. Strengths: cost of living A+, housing A+; Watch: schools F, amenities F, commute F.
- Randolph County School System (rural): math 43% / reading 43% proficiency, ranked #94 of 178 in NC (top 53%) — families likely to look elsewhere, expect single-tenant / working-renter base with shorter leases.
- Market conditions: 78 active listings in the ZIP; 2 comparable units currently listed for rent nearby; 789 units permitted in Randolph County in 2024 (168 in 5+ unit buildings).
Forward outlook
- Local home prices are declining (-3.0%/yr); year-one equity from $2k of loan paydown is wiped out by about $8k of value loss. Plan a longer hold.
- Randolph County population projected to shrink 10% by 2050 — rents likely to lag national; underwrite the cash flow, not the appreciation.
Negotiation context
- It's been on market 45 days — a 3% lower offer ($272k) is reasonable based on typical stale-listing flexibility.
- 2 sale attempts since 12y ago with the ask held roughly flat each time — persistent listings suggest the price (not the market) is what's stuck; bring a comps-based counter.
- Current owner paid $141k; list at $280k implies a 99% gain — meaningful room to come down on a strong offer.
Risks & watch-outs
- Climate carrying-cost: moderate wind risk, 21% chance of damaging wind over 30y; extreme-heat days projected 7→17/yr by 2055 (HVAC capex compounding) — expect insurance premiums to compound above CPI over the hold.
Questions for the listing agent
- It's been on market 45 days. Have you received any prior offers? Is the seller open to a 5% concession, seller financing, or rate buy-down credit?
- Is there a deadline driving the sale (1031 exchange, divorce, estate, relocation)? That informs how much negotiation room exists.
- Schools are F-rated, which usually means shorter tenancies and higher turnover. Who's the typical renter profile here, and what's been the actual vacancy rate?
- What's the average days-on-market for RENTAL listings here right now (not sales)? A rising rental-DOM trend means longer vacancies and softer asking-rent achievability than the comps imply.
- What's the recent tenant-quality profile in this submarket — average credit score on applications, eviction rate, late-payment / NSF rate, and stable-employment percentage? A property-management company in the area should have these aggregated.
- How much new for-sale + rental construction is in the pipeline within 1–3 miles? Heavy new supply typically softens prices + rents 12–24 months out; constrained supply supports both.
Investment metrics
- 1% rule
- 0.95% ✗
- Cap rate
- 7.65%
- Cash-on-cash
- 4.85%
- DSCR
- 1.22
- GRM
- 8.8
CMA / ARV
- ARV (on-the-fly)
- $292,496
- Comps found
- 12
Show comp detail 12 sales within ~0.75 mi
| Address | Dist | Beds/Ba | Sqft | Sold | Price | $/sf | Match |
|---|---|---|---|---|---|---|---|
| 514 Woods Dr | 0.20mi | 3/2.0 | 1,481 (+2%) | 14mo | $340,000 | $230 | 76 |
| 302 Trollinger St | 0.26mi | 3/2.0 | 1,310 (-10%) | 1mo | $260,000 | $198 | 72 |
| 4 Bradsher Ct | 0.36mi | 3/2.0 | 1,348 (-7%) | 2mo | $319,500 | $237 | 70 |
| 403 Shaw St | 0.46mi | 3/2.0 | 1,442 (-0%) | 9mo | $270,000 | $187 | 70 |
| 872 Charter Oaks Dr | 0.37mi | 3/2.0 | 1,358 (-6%) | 9mo | $269,500 | $198 | 65 |
| 570 New Salem Rd | 0.30mi | 3/2.0 | 1,562 (+8%) | 12mo | $320,000 | $205 | 62 |
| 4207 Fox St | 0.40mi | 3/2.0 | 1,313 (-9%) | 4mo | $260,000 | $198 | 62 |
| 4227 Fox St | 0.37mi | 3/2.0 | 1,320 (-9%) | 11mo | $269,000 | $204 | 59 |
| 117 Trollinger St | 0.35mi | 3/2.5 | 1,610 (+11%) | 10mo | $325,000 | $202 | 55 |
| 4220 N Pin Oak Dr | 0.38mi | 3/2.0 | 1,300 (-10%) | 12mo | $271,000 | $208 | 55 |
| 1056 Charter Oaks Dr | 0.57mi | 3/2.0 | 1,326 (-8%) | 10mo | $265,000 | $200 | 51 |
| 914 Charter Oaks Dr | 0.41mi | 3/2.5 | 1,646 (+14%) | 7mo | $249,900 | $152 | 51 |
Match score weights: distance 35% · size 25% · config 20% · recency 20%. Top-matched comps best support the ARV.
Projected returns pro-forma
-3.0% appreciation · 3.0% rent growth · sell at horizon
- IRR
- -8.8%
- Equity multiple
- 0.68×
- Total profit
- $-25,260
- Equity at exit
- $41,749
- IRR
- 0.7%
- Equity multiple
- 1.05×
- Total profit
- $3,752
- Equity at exit
- $24,209
Cash invested: $78,400 (down + closing). Projections, not guarantees.
Landlord ↔ Tenant lean methodology
- Overall (STATE)
- 85 Strongly Landlord-Friendly
- State North Carolina
- 85 Strongly Landlord-Friendly · R+3
- County
- — inherits STATE
- City
- — inherits STATE
ZIP-level market 27317
- Home prices YoY
- -15.3%
- Active inventory
- 78
- Price-to-rent
- 8.8×
Monthly cashflow live
- Estimated rent
- $2,656 medium interval (Pro) →
- Mortgage (P&I)
- −$1,468
- Tax from tax record
- −$197 /mo · $2,363/yr
- Insurance
- −$117
- HOA
- −$0
- Vacancy / Maint / Mgmt
- −$558
- Net cashflow
- $317
Break-even live
Sensitivity live
| Price | -10% $475 | -5% $396 | +0% $317 | +5% $237 | +10% $158 |
|---|---|---|---|---|---|
| Rent | -10% $107 | -5% $212 | +0% $317 | +5% $422 | +10% $526 |
| Rate | -1.0pp $458 | -0.5pp $388 | base $317 | +0.5pp $244 | +1.0pp $170 |
UW: 25.0% down · 7.5% · 30yr · 1.5% tax · 5.0% vac · 8.0% maint · 8.0% mgmt
Financing live
Cash to close
- Down payment
- $70,000
- Closing costs
- $8,400
- Reserves months
- —
- Total cash needed
- —
Loan-product check · same deal, 3 products live
Conventional
25% down · 7.5% · 30yr
- Down + closing
- —
- Monthly P&I
- —
- Monthly cashflow
- —
- DSCR
- —
- Eligible?
- —
Personal DTI + credit; lowest rate.
DSCR
20% down · 8.5% · 30yr
- Down + closing
- —
- Monthly P&I
- —
- Monthly cashflow
- —
- DSCR
- —
- Eligible?
- —
No personal income docs; deal must DSCR.
Hard money
10% down · 12.0% · 12mo
- Down + closing
- —
- Monthly P&I
- —
- Monthly cashflow
- —
- DSCR
- —
- Eligible?
- —
Short-term bridge; refi at stabilization.
Rent comps 2 comps
| Address | Beds | Baths | Sqft | Rent | $/sqft | DOM | Units | Dist |
|---|---|---|---|---|---|---|---|---|
| 518 Woods Dr Randleman, NC | 4.0 | 2.0 | 1800 | $3,000 | $1.67 | 15d | 1 | 0.19mi |
| 1125 N Main St Randleman, NC | 3.0 | 1.0 | 1134 | $1,400 | $1.23 | 24d | 1 | 0.66mi |
Listing history 20 events
-
2026-06-21days on market $280,000 Active 45 DOM
-
2026-06-18days on market $280,000 Active 42 DOM
-
2026-06-17days on market $280,000 Active 41 DOM
-
2026-06-16days on market $280,000 Active 40 DOM
-
2026-06-15days on market $280,000 Active 39 DOM
-
2026-06-14days on market $280,000 Active 37 DOM
-
2026-06-10days on market $280,000 Active 34 DOM
-
2026-06-09days on market $280,000 Active 33 DOM
-
2026-06-08days on market $280,000 Active 32 DOM
-
2026-06-07days on market $280,000 Active 31 DOM
-
2026-06-05days on market $280,000 Active 28 DOM
-
2026-06-03pricedays on market $280,000 Active 27 DOM
-
2026-06-02days on market $285,000 Active 26 DOM
-
2026-06-01days on market $285,000 Active 25 DOM
-
2026-05-31days on market $285,000 Active 24 DOM
-
2026-05-31days on market $285,000 Active 23 DOM
-
2026-05-08$285,000 Active
-
2026-05-07historical $285,000
-
2015-05-07soldstatus $140,900 Sold 509-char remark
Show marketing remark (509 chars)
Brand new 3 bedroom/2 bath home with split floor plan featuring large open family room, dining room and kitchen with island in center. On the right master bedroom has large walk in closet and master bath suite has a double bowl vanity and shower. On left are 2 bedrooms with bathroom. Large front porch for your rocking chairs for relaxing and deck at back for entertaining . Excellent location near downtown Randleman with quick access to I-73 and Hwy 311. This is a must see, call today for an appointment.
-
2014-07-22$135,900 509-char remark
Show marketing remark (509 chars)
Brand new 3 bedroom/2 bath home with split floor plan featuring large open family room, dining room and kitchen with island in center. On the right master bedroom has large walk in closet and master bath suite has a double bowl vanity and shower. On left are 2 bedrooms with bathroom. Large front porch for your rocking chairs for relaxing and deck at back for entertaining . Excellent location near downtown Randleman with quick access to I-73 and Hwy 311. This is a must see, call today for an appointment.
ⓘ Source: listings_history table (triggers on properties + properties_extension) + one-shot
backfill from property_details.listing_events for pre-trigger history.
Tax reassessment forecast NC · Resets to sale price
- Current annual tax
- $2,363 · $197/mo
- Projected year-2 tax
- $2,363 · $197/mo
- Expected delta
- $0/yr ($0/mo · 0.0%)
ⓘ Screening estimate from a state-policy table — verify with the county assessor before closing.
Climate risk First Street
- Flood 1/10 Low FEMA zone X (unshaded) · 0% chance over 30 yrs
- Wildfire 4/10 Moderate
- Heat 5/10 Major 7 d/yr ≥103°F today · 17 d/yr by 30 yrs out
- Wind 5/10 Major 21% chance of damaging wind over 30 yrs
- Air quality 2/10 Low 1 unhealthy d/yr today · 1 by 30 yrs out
Nearby sold comps map
Loading sold comps map…
Walkable amenities ~0.75 mi
Loading nearby amenities…
Taxation est. · year 1
- Rental income
- $31,877
- − Mortgage interest
- −$15,684
- − Property taxes
- −$2,363
- − Insurance
- −$1,400
- − Repairs & maintenance
- −$2,550
- − Management
- −$2,550
- − Depreciation
- −$8,145
- Taxable loss
- −$816
- Est. tax savings @ 24.0%
- +$196
- After-tax cash flow
- $3,995/yr
For passive investors: Depreciation is non-cash, so a rental often shows a tax loss while cash-flowing — sheltering income. Rental losses are passive: they offset passive income freely, and up to $25,000/yr can offset ordinary (W-2) income if you actively participate and your MAGI is under $100k (phasing out to $0 by $150k); unused losses carry forward. On sale, claimed depreciation is recaptured at up to 25%, and gains may owe capital-gains tax (a 1031 exchange can defer both). Figures are a year-1 estimate at your 24.0% rate — not tax advice; consult a CPA.
Schools (NCES district)
- District
- Randolph County School System
- NCES district ID
- 3703780
- Math proficiency
- 43% ▲ 1.00%
- Reading proficiency
- 43% ▲ 2.00%
- Median HH income
- $43,490
- Composite
- 36.37/100
- National rank
- #4686
- State rank
- #94 of 178 in NC
Livability — Randleman
- Score
- 67/100
- State rank
- #242
- US rank
- #10980
Category grades
Schools grade is shown separately in the Schools card above.
Census & demographics
- Census place
- Randleman, NC
- Population (ZIP)
- 17,769
Population outlook (Randolph County) Hauer SSP2
- Today (2025)
- 142,640 people
- By 2030
- 140,911 · -1.2%
- By 2040
- 135,692 · -4.9%
- By 2050
- 128,575 · -9.9%
- By 2075
- 111,507 · -21.8%
- By 2100
- 93,376 · -34.5%
Race, ethnicity, and origin ACS 2023
- Neighborhood character
- Predominantly White (79%)
- Race & ethnicity
- White 79% Hispanic / Latino 13% Two or more races 7% Black 4%
- Hispanic origin (detail)
- Mexican 11% Puerto Rican 2%
- Common ancestry
- Serbian 7% Slovak 3% Italian 2%
- Foreign-born
- 6% · Canada
- Languages at home
- 88% English-only · Spanish 12%
Political lean MEDSL · Randolph
- 2024 margin
- Solid R (+57.2) · D 21.0% · R 78.3%
- 2008→2024 swing
- -15.0pp toward R · 2008: -42.3pp · 2024: -57.2pp
- All cycles
- 2024: R+57.2 2020: R+56.3 2016: R+56.7 2012: R+50.2 2008: R+42.3
Not yet ingested
- Civics
- —
Market trends
- HPI YoY
- ▼ -43.66%
- Current HPI
- 241.7323
- Rent YoY
- —
- Metro
- —
- State GDP YoY
- ▲ 3.28%
- F500 in state
- 26
Industry mix (Fortune 500 HQ in NC)
| Industry | F500 HQs | Revenue |
|---|---|---|
| Financial Services | 2 | $213B |
|
||
| Retail | 2 | $95B |
|
||
| Industrial Conglomerate | 1 | $38B |
|
||
| Metals / Steel | 1 | $35B |
|
||
| Utilities | 1 | $30B |
|
||
| Industrial Machinery | 1 | $19B |
|
||
Price history
+109.7% since first listed4 events — show timeline
- 2026-05-08 Listed $285,000 Triad MLS
- 2026-05-07 Coming Soon $285,000 Triad MLS
- 2015-05-07 Sold (MLS) $140,900 Triad MLS
- 2014-07-22 Listed $135,900 Triad MLS
Property tax history
+4.4%/yrLatest (2025): $2,363 · +0.0% YoY. Source: county tax records.
Cash-flow waterfall
monthlySold comps — $/sqft
last 12 mo · ≤1 miLoading sold comps…