2457 Elmwood Dr · West Tawakoni, TX
Flood risk 1/10 · Minimal
- FEMA flood zone
- X (unshaded)
- Chance of flooding over 30 yrs
- 0.0%
- Est. flood insurance / yr
- $507 – $1,088
Fire risk 4/10 · Minor
- Est. fire insurance / yr
- $1,222 – $2,270
Heat risk 7/10 · Major
- Hot days now (above 110°F)
- 7 days/yr
- Hot days in 30 yrs
- 25 days/yr
Wind risk 6/10 · Moderate
- Chance of severe wind over 30 yrs
- 27.0%
Air-quality risk 2/10 · Minimal
- Unhealthy air days now
- 1 days/yr
- Unhealthy air days in 30 yrs
- 1 days/yr
Risk factors via First Street. Map © Google.
Why this score? — see what drove the B+ grade
The composite is a weighted blend of 9 inputs, each scored 0–100. Each bar is that input's sub-score; the figure is the points it added to the 100-point composite (weight × sub-score).
- Cash flow +30.0/30.0
- ARV discount +15.0/15.0
- 1% rule +10.0/10.0
- DSCR +10.0/10.0
- Livability +2.8/5.0
- Schools +2.6/10.0
- Rent growth +2.5/5.0
- Condition / age +2.5/5.0
- Appreciation +0.0/10.0
$70,000
🖨 Deal sheet (PDF) 📄 Offer letter ✓ Due diligence
Listing remarks
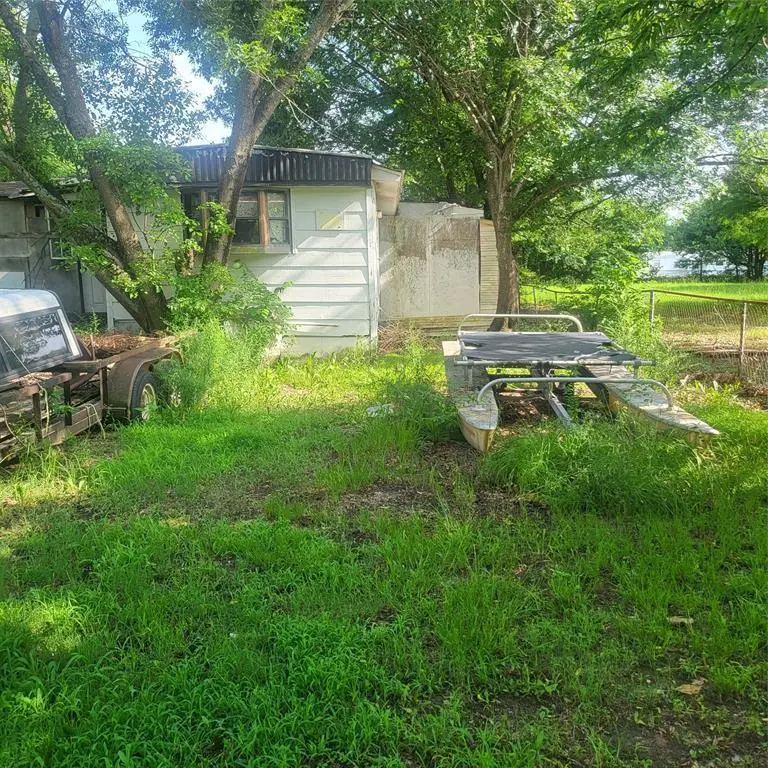
* * * * * INVESTOR SPECIAL * * * * * This property is being sold AS-IS. Owner will not be making any repairs. This property needs a lot of work. The mobile home is the most neglected. There is a room with a hot tub that does not work off the side of the house. There is an open area between the mobile and garage called the rock garden. The garage is large and there is a room upstairs for living quarters. The garage seems to be in the best shape. There is also a small shed on the property that has been turned into living quarters as well. It will need some cleanup and work. There is also an older storage building on the property that is included. The owner is not able to make repairs
Key facts
- Living quarters
- Hot tub
- Rock garden
Tags
Property features AI
Finance
- Other: Lot is under 0.5 acre (approx. 0.36 acre); Will not subdivide; No known restrictions
- HOA & community: No association
Exterior
- Parking: On-site parking; 2-car garage
- Utilities: City water; Septic
- Home design: Single-family residence; Residential property; One and one-half story; Property attached: yes; Accessible features present
- Construction: Composition roof; Other foundation; Built in 2000
- Exterior features: Chain link fencing; Cross-fenced; Grassed vegetation; Private pool with separate spa/hot tub
Interior
- Kitchen: Built-in cabinets; Dishwasher; Electric oven
- Bedrooms: Primary bedroom (1st floor) — approx. 10 x 10
- Flooring: Combination flooring
- Bathrooms: 2 full bathrooms
- Interior features: Cable TV available; Accessible approach with ramp and accessible grip
- Laundry & utility: Washer included
Neighborhood map
What this means for you Summary
Snapshot
- This is a 2-bed/2.0-bath single-family listed at $70k.
Deal economics
- At list price, monthly cash flow is $370 ($4k/yr) — positive.
- The deal already cash-flows at list — no discount required.
- Meets the 1% rule at list price ($1k rent vs $70k).
- Recommended offer: $69k (1.5% below list) — sets the bar for market timing.
- Cap rate 12.6% vs local median 4.6% in West Tawakoni — top-decile yield for the area; either an underpriced asset or a hidden risk that comps aren't pricing in. Stress-test before assuming the spread holds.
Location & tenants
- Location reads 56/100 on livability (#1,337 in TX) — a working-class tenant base; expect higher turnover. Strengths: cost of living A+, housing A+, crime A-; Watch: amenities F, commute F, employment F.
- Quinlan ISD (rural): math 27% / reading 34% proficiency, ranked #610 of 826 in TX (top 74%) — families likely to look elsewhere, expect single-tenant / working-renter base with shorter leases.
- Zoned schools: D C Cannon El (765 students, 81% FRL); C B Thompson Middle (math 33% / reading 36%, grade F, #858 of 1,662 statewide, top 54%, 628 students, 77% FRL); Wh Ford H S (math 17% / reading 44%, grade F, #1,085 of 1,632 statewide, top 67%, 786 students, 68% FRL) — zoned schools average 75% FRL vs 60% district-wide (16 pts higher); higher-poverty schools than district average — tighter screening recommended.
- Market conditions: 287 active listings in the ZIP; 1,289 units permitted in Hunt County in 2024 (527 in 5+ unit buildings).
Forward outlook
- Local home prices are declining (-3.0%/yr); year-one equity from $484 of loan paydown is wiped out by about $2k of value loss. Plan a longer hold.
- Hunt County population projected at +15% by 2050 — modest demand growth; plan on rents tracking national, not racing it.
- At projected returns (-3.0% appreciation + 3.0% rent growth), your $20k cash investment doubles in ~6 years — after that, you're playing with house money.
Negotiation context
- It's been on market 19 days — a 2% lower offer ($69k) is reasonable based on typical stale-listing flexibility.
- 2 sale attempts with the ask held roughly flat each time — persistent listings suggest the price (not the market) is what's stuck; bring a comps-based counter.
Risks & watch-outs
- Climate carrying-cost: major wind risk, 27% chance of damaging wind over 30y; extreme-heat days projected 7→25/yr by 2055 (HVAC capex compounding) — expect insurance premiums to compound above CPI over the hold.
Questions for the listing agent
- Is there a deadline driving the sale (1031 exchange, divorce, estate, relocation)? That informs how much negotiation room exists.
- Schools are F-rated, which usually means shorter tenancies and higher turnover. Who's the typical renter profile here, and what's been the actual vacancy rate?
- What's the average days-on-market for RENTAL listings here right now (not sales)? A rising rental-DOM trend means longer vacancies and softer asking-rent achievability than the comps imply.
- What's the recent tenant-quality profile in this submarket — average credit score on applications, eviction rate, late-payment / NSF rate, and stable-employment percentage? A property-management company in the area should have these aggregated.
- How much new for-sale + rental construction is in the pipeline within 1–3 miles? Heavy new supply typically softens prices + rents 12–24 months out; constrained supply supports both.
Investment metrics
- 1% rule
- 1.60% ✓
- Cap rate
- 12.64%
- Cash-on-cash
- 22.68%
- DSCR
- 2.01
- GRM
- 5.2
CMA / ARV
- ARV (median comp)
- $115,827
- List price
- $70,000
- Delta
- -39.56%
- Verdict
- UNDERPRICED
- Comps
- 9 within 1.0 mi
Projected returns pro-forma
-3.0% appreciation · 3.0% rent growth · sell at horizon
- IRR
- 15.6%
- Equity multiple
- 1.63×
- Total profit
- $12,281
- Equity at exit
- $10,437
- IRR
- 24.3%
- Equity multiple
- 3.10×
- Total profit
- $41,211
- Equity at exit
- $6,052
Cash invested: $19,600 (down + closing). Projections, not guarantees.
Landlord ↔ Tenant lean methodology
- Overall (STATE)
- 87 Strongly Landlord-Friendly
- State Texas
- 87 Strongly Landlord-Friendly · R+5
- County
- — inherits STATE
- City
- — inherits STATE
ZIP-level market 75169
- Home prices YoY
- -15.4%
- Active inventory
- 287
- Price-to-rent
- 5.2×
Monthly cashflow live
- Estimated rent
- $1,119 medium interval (Pro) →
- Mortgage (P&I)
- −$367
- Tax from tax record
- −$117 /mo · $1,408/yr
- Insurance
- −$29
- HOA
- −$0
- Vacancy / Maint / Mgmt
- −$235
- Net cashflow
- $370
Break-even live
Sensitivity live
| Price | -10% $410 | -5% $390 | +0% $370 | +5% $351 | +10% $331 |
|---|---|---|---|---|---|
| Rent | -10% $282 | -5% $326 | +0% $370 | +5% $415 | +10% $459 |
| Rate | -1.0pp $406 | -0.5pp $388 | base $370 | +0.5pp $352 | +1.0pp $334 |
UW: 25.0% down · 7.5% · 30yr · 1.5% tax · 5.0% vac · 8.0% maint · 8.0% mgmt
Financing live
Cash to close
- Down payment
- $17,500
- Closing costs
- $2,100
- Reserves months
- —
- Total cash needed
- —
Loan-product check · same deal, 3 products live
Conventional
25% down · 7.5% · 30yr
- Down + closing
- —
- Monthly P&I
- —
- Monthly cashflow
- —
- DSCR
- —
- Eligible?
- —
Personal DTI + credit; lowest rate.
DSCR
20% down · 8.5% · 30yr
- Down + closing
- —
- Monthly P&I
- —
- Monthly cashflow
- —
- DSCR
- —
- Eligible?
- —
No personal income docs; deal must DSCR.
Hard money
10% down · 12.0% · 12mo
- Down + closing
- —
- Monthly P&I
- —
- Monthly cashflow
- —
- DSCR
- —
- Eligible?
- —
Short-term bridge; refi at stabilization.
Listing history 16 events
-
2026-06-21days on market $70,000 Active 19 DOM
-
2026-06-18days on market $70,000 Active 16 DOM
-
2026-06-17days on market $70,000 Active 15 DOM
-
2026-06-16days on market $70,000 Active 14 DOM
-
2026-06-15days on market $70,000 Active 13 DOM
-
2026-06-13days on market $70,000 Active 11 DOM
-
2026-06-09days on market $70,000 Active 7 DOM
-
2026-06-08days on market $70,000 Active 6 DOM
-
2026-06-07days on market $70,000 Active 5 DOM
-
2026-06-04days on market $70,000 Active 2 DOM
-
2026-06-03statusdays on market $70,000 Active 1 DOM
-
2026-05-16historical
-
2026-03-12soldstatus
-
2025-10-19price $70,000
-
2025-08-26price $80,000
-
2025-06-18$100,000 Active
ⓘ Source: listings_history table (triggers on properties + properties_extension) + one-shot
backfill from property_details.listing_events for pre-trigger history.
Tax reassessment forecast TX · Resets to sale price
- Current annual tax
- $1,408 · $117/mo
- Projected year-2 tax
- $1,408 · $117/mo
- Expected delta
- $0/yr ($0/mo · 0.0%)
ⓘ Screening estimate from a state-policy table — verify with the county assessor before closing.
Climate risk First Street
- Flood 1/10 Low FEMA zone X (unshaded) · 0% chance over 30 yrs
- Wildfire 4/10 Moderate
- Heat 7/10 Severe 7 d/yr ≥110°F today · 25 d/yr by 30 yrs out
- Wind 6/10 Major 27% chance of damaging wind over 30 yrs
- Air quality 2/10 Low 1 unhealthy d/yr today · 1 by 30 yrs out
Nearby sold comps map
Loading sold comps map…
Walkable amenities ~0.75 mi
Loading nearby amenities…
Taxation est. · year 1
- Rental income
- $13,427
- − Mortgage interest
- −$3,921
- − Property taxes
- −$1,408
- − Insurance
- −$350
- − Repairs & maintenance
- −$1,074
- − Management
- −$1,074
- − Depreciation
- −$2,036
- Taxable income
- $3,563
- Est. tax owed @ 24.0%
- −$855
- After-tax cash flow
- $3,589/yr
For passive investors: Depreciation is non-cash, so a rental often shows a tax loss while cash-flowing — sheltering income. Rental losses are passive: they offset passive income freely, and up to $25,000/yr can offset ordinary (W-2) income if you actively participate and your MAGI is under $100k (phasing out to $0 by $150k); unused losses carry forward. On sale, claimed depreciation is recaptured at up to 25%, and gains may owe capital-gains tax (a 1031 exchange can defer both). Figures are a year-1 estimate at your 24.0% rate — not tax advice; consult a CPA.
Schools (NCES district)
- District
- Quinlan ISD
- NCES district ID
- 4836240
- Math proficiency
- 27% ▼ -10.00%
- Reading proficiency
- 34% ▼ -2.00%
- Median HH income
- $45,461
- Composite
- 26.16/100
- National rank
- #7271
- State rank
- #610 of 826 in TX
Livability — West Tawakoni
- Score
- 56/100
- State rank
- #1337
- US rank
- #23022
Category grades
Schools grade is shown separately in the Schools card above.
Census & demographics
- Population (ZIP)
- 15,744
Population outlook (Hunt County) Hauer SSP2
- Today (2025)
- 97,090 people
- By 2030
- 100,452 · +3.5%
- By 2040
- 106,544 · +9.7%
- By 2050
- 111,218 · +14.6%
- By 2075
- 121,695 · +25.3%
- By 2100
- 123,683 · +27.4%
Race, ethnicity, and origin ACS 2023
- Neighborhood character
- Predominantly White (78%)
- Race & ethnicity
- White 78% Hispanic / Latino 15% Two or more races 7% Black 4%
- Hispanic origin (detail)
- Mexican 15%
- Common ancestry
- Slovak 2% Italian 1% Lithuanian 1%
- Foreign-born
- 4% · Canada
- Languages at home
- 92% English-only · Spanish 8%
Political lean MEDSL · Hunt
- 2024 margin
- Solid R (+55.5) · D 21.9% · R 77.4%
- 2008→2024 swing
- -14.9pp toward R · 2008: -40.6pp · 2024: -55.5pp
- All cycles
- 2024: R+55.5 2020: R+52.5 2016: R+56.3 2012: R+51.2 2008: R+40.6
Not yet ingested
- Civics
- —
Market trends
- HPI YoY
- ▼ -45.68%
- Current HPI
- 250.2271
- Rent YoY
- —
- Metro
- —
- State GDP YoY
- ▲ 3.95%
- F500 in state
- 110
Industry mix (Fortune 500 HQ in TX)
| Industry | F500 HQs | Revenue |
|---|---|---|
| Energy | 16 | $1,198B |
|
||
| Technology | 5 | $198B |
|
||
| Engineering / Construction | 4 | $72B |
|
||
| Energy Services | 3 | $60B |
|
||
| Utilities | 3 | $41B |
|
||
| Healthcare | 2 | $330B |
|
||
Price history
-30.0% since first listed6 events — show timeline
- 2026-06-02 Listed $70,000 NTREIS
- 2026-05-16 Listing Removed — NTREIS
- 2026-03-12 Sold (Public Records) — Public Records
- 2025-10-19 Price Changed $70,000 NTREIS
- 2025-08-26 Price Changed $80,000 NTREIS
- 2025-06-18 Listed $100,000 NTREIS
Property tax history
+7.4%/yrLatest (2025): $1,408 · +4.7% YoY. Source: county tax records.
Cash-flow waterfall
monthlySold comps — $/sqft
last 12 mo · ≤1 miLoading sold comps…