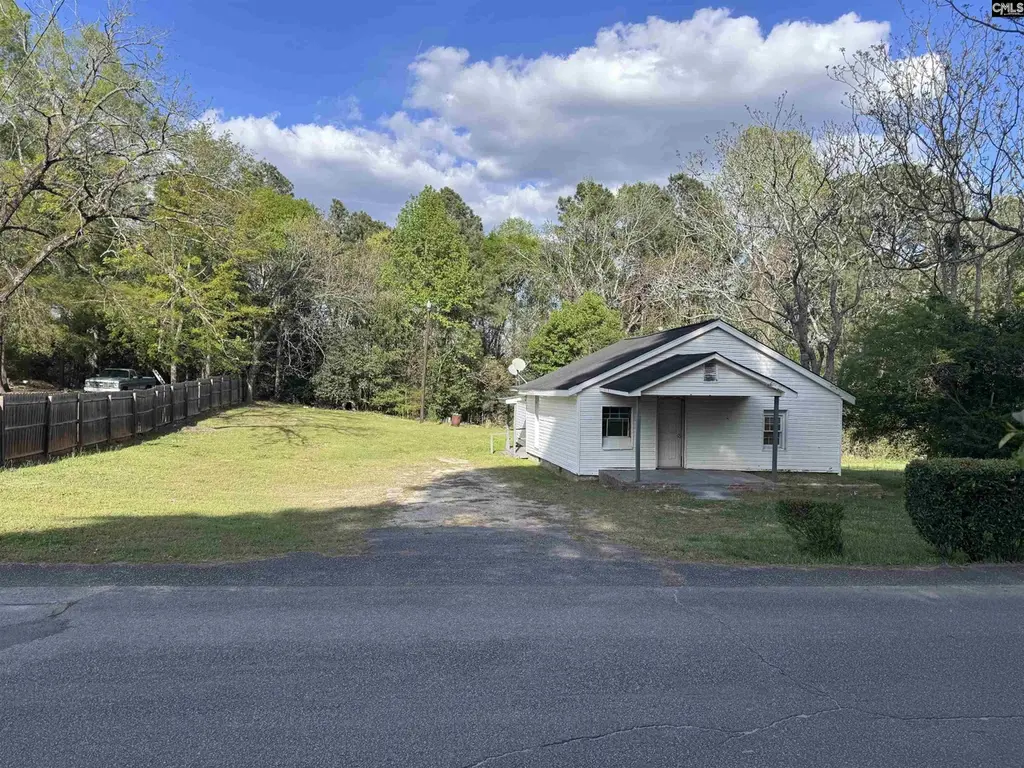
269 Cherry Rd · Winnsboro Mills, SC
Flood risk 1/10 · Minimal
- FEMA flood zone
- X (unshaded)
- Chance of flooding over 30 yrs
- 0.0%
- Est. flood insurance / yr
- $507 – $1,088
Fire risk 4/10 · Minor
- Est. fire insurance / yr
- $783 – $1,453
Heat risk 6/10 · Moderate
- Hot days now (above 106°F)
- 7 days/yr
- Hot days in 30 yrs
- 16 days/yr
Wind risk 6/10 · Moderate
- Chance of severe wind over 30 yrs
- 49.0%
Air-quality risk 2/10 · Minimal
- Unhealthy air days now
- 1 days/yr
- Unhealthy air days in 30 yrs
- 1 days/yr
Risk factors via First Street. Map © Google.
Why this score? — see what drove the B- grade
The composite is a weighted blend of 9 inputs, each scored 0–100. Each bar is that input's sub-score; the figure is the points it added to the 100-point composite (weight × sub-score).
- Cash flow +30.0/30.0
- 1% rule +10.0/10.0
- DSCR +10.0/10.0
- ARV discount +7.5/15.0
- Livability +2.9/5.0
- Schools +2.6/10.0
- Rent growth +2.5/5.0
- Condition / age +2.5/5.0
- Appreciation +0.0/10.0
$60,000
🖨 Deal sheet 📄 Offer letter ✓ Due diligence
Listing remarks
Whether you're looking for your next fix-and-flip, rental investment, or renovation project, this property has solid potential. With a functional layout and plenty of outdoor space, there’s room to create something special here. Located in a quiet area of Winnsboro, this property offers the charm of country living while still being within a reasonable drive to Columbia and surrounding areas. Features:3 Bedrooms, 1 Bath Large lot with plenty of spaceInvestment opportunity No HOA Sold AS-IS. Cash or renovation loans likely best. Don’t miss your chance to turn this diamond in the rough into something great—opportunities like this don’t sit long! Disclaimer: CMLS has no
Key facts
- Large lot
- Outdoor space
- 0.49 acre lot
Tags
Property features AI
Exterior
- Utilities: Public sewer
- Home design: Single-story home
- Construction: Crawlspace foundation
- Exterior features: Vinyl exterior; Paved road access; Approximately 0.49-acre lot; Public water
Interior
- Bedrooms: Master bedroom on the main level
- Bathrooms: One full bathroom
- Heating & cooling: Heated living area approximately 1,266
- Interior features: One fireplace
Neighborhood map
What this means for you Summary
Snapshot
- This is a 3-bed/1.0-bath single-family listed at $60k.
Deal economics
- At list price, monthly cash flow is $480 ($6k/yr) — positive.
- The deal already cash-flows at list — no discount required.
- Meets the 1% rule at list price ($1k rent vs $60k).
- Recommended offer: $58k (3.0% below list) — sets the bar for market timing.
Location & tenants
- Location reads 58/100 on livability (#265 in SC) — a working-class tenant base; expect higher turnover. Strengths: cost of living A+, housing A-, crime B; Watch: amenities F, commute F, employment D-.
- Fairfield 01 (rural): math 26% / reading 38% proficiency, ranked #53 of 80 in SC (top 66%) — families likely to look elsewhere, expect single-tenant / working-renter base with shorter leases; 80% free/reduced lunch — lower-income household profile, screen leases tightly.
- Zoned schools: Fairfield Central High (math 37% / reading 77%, grade C, #120 of 196 statewide, top 64%, 662 students, 100% FRL) — zoned schools average 100% FRL vs 80% district-wide (20 pts higher); higher-poverty schools than district average — tighter screening recommended.
- Zoned-school proficiency averages 57% at this address vs 32% district-wide (+25 pts) — the actual schools serving this property are materially stronger than the Fairfield 01 average implies; a family-tenant draw the district grade alone would hide.
- Market conditions: 75 active listings in the ZIP; 3 comparable units currently listed for rent nearby; rentals at typical pace (median 24d on market — plan ~3-4 weeks tenant-placement turnaround); lower-income renter base — watch delinquency; 91 units permitted in Fairfield County in 2024 (0 in 5+ unit buildings).
- This rent runs 32% of the median local income ($43k/yr) — at the standard rent-burdened threshold; future hikes will face affordability resistance.
Forward outlook
- Local home prices are declining (-3.0%/yr); year-one equity from $415 of loan paydown is wiped out by about $2k of value loss. Plan a longer hold.
- Fairfield County population projected at -32% by 2050 — secular population decline; favor cash flow + early exit over multi-decade hold.
- At projected returns (-3.0% appreciation + 3.0% rent growth), your $17k cash investment doubles in ~4 years — after that, you're playing with house money.
Negotiation context
- It's been on market 50 days — a 3% lower offer ($58k) is reasonable based on typical stale-listing flexibility.
Risks & watch-outs
- Climate carrying-cost: major wind risk, 49% chance of damaging wind over 30y; extreme-heat days projected 7→16/yr by 2055 (HVAC capex compounding) — expect insurance premiums to compound above CPI over the hold.
Questions for the listing agent
- It's been on market 50 days. Have you received any prior offers? Is the seller open to a 3% concession, seller financing, or rate buy-down credit?
- Built in 1970 — when were the roof, HVAC, electrical panel, plumbing, and water heater last replaced?
- Is there a deadline driving the sale (1031 exchange, divorce, estate, relocation)? That informs how much negotiation room exists.
- Schools are F-rated, which usually means shorter tenancies and higher turnover. Who's the typical renter profile here, and what's been the actual vacancy rate?
- What's the average days-on-market for RENTAL listings here right now (not sales)? A rising rental-DOM trend means longer vacancies and softer asking-rent achievability than the comps imply.
- What's the recent tenant-quality profile in this submarket — average credit score on applications, eviction rate, late-payment / NSF rate, and stable-employment percentage? A property-management company in the area should have these aggregated.
- How much new for-sale + rental construction is in the pipeline within 1–3 miles? Heavy new supply typically softens prices + rents 12–24 months out; constrained supply supports both.
Investment metrics
- 1% rule
- 1.94% ✓
- Cap rate
- 15.89%
- Cash-on-cash
- 34.26%
- DSCR
- 2.52
- GRM
- 4.3
CMA / ARV
No comps found within radius.
Projected returns pro-forma
-3.0% appreciation · 3.0% rent growth · sell at horizon
- IRR
- 29.7%
- Equity multiple
- 2.24×
- Total profit
- $20,862
- Equity at exit
- $8,946
- IRR
- 37.0%
- Equity multiple
- 4.43×
- Total profit
- $57,643
- Equity at exit
- $5,188
Cash invested: $16,800 (down + closing). Projections, not guarantees.
Landlord ↔ Tenant lean methodology
- Overall (STATE)
- 90 Strongly Landlord-Friendly
- State South Carolina
- 90 Strongly Landlord-Friendly · R+6
- County
- — inherits STATE
- City
- — inherits STATE
ZIP-level market 29180
- Home prices YoY
- -30.7%
- Active inventory
- 75
- Price-to-rent
- 4.3×
Monthly cashflow live
- Estimated rent
- $1,166 medium interval (Pro) →
- Mortgage (P&I)
- −$315
- Tax from tax record
- −$102 /mo · $1,218/yr
- Insurance
- −$25
- HOA
- −$0
- Vacancy / Maint / Mgmt
- −$245
- Net cashflow
- $480
Break-even live
UW: 25.0% down · 7.5% · 30yr · 1.5% tax · 5.0% vac · 8.0% maint · 8.0% mgmt
Financing live
Cash to close
- Down payment
- $15,000
- Closing costs
- $1,800
- Reserves months
- —
- Total cash needed
- —
Loan-product check · same deal, 3 products live
Conventional
25% down · 7.5% · 30yr
- Down + closing
- —
- Monthly P&I
- —
- Monthly cashflow
- —
- DSCR
- —
- Eligible?
- —
Personal DTI + credit; lowest rate.
DSCR
20% down · 8.5% · 30yr
- Down + closing
- —
- Monthly P&I
- —
- Monthly cashflow
- —
- DSCR
- —
- Eligible?
- —
No personal income docs; deal must DSCR.
Hard money
10% down · 12.0% · 12mo
- Down + closing
- —
- Monthly P&I
- —
- Monthly cashflow
- —
- DSCR
- —
- Eligible?
- —
Short-term bridge; refi at stabilization.
Rent comps 3 comps
| Address | Beds | Baths | Sqft | Rent | $/sqft | DOM | Units | Dist |
|---|---|---|---|---|---|---|---|---|
| 315 Columbia Rd Winnsboro, SC | 2.0 | 1.0 | 981 | $1,000 | $1.02 | 23d | 1 | 0.72mi |
| 850 8th St Unit A Winnsboro, SC | 2.0 | 1.0 | 900 | $1,275 | $1.42 | 23d | 1 | 0.88mi |
| 850 8th St Unit B Winnsboro, SC | 2.0 | 1.0 | 900 | $1,250 | $1.39 | 23d | 1 | 0.88mi |
Listing history 15 events
-
2026-06-18days on market $60,000 Active 50 DOM
-
2026-06-17days on market $60,000 Active 49 DOM
-
2026-06-16days on market $60,000 Active 48 DOM
-
2026-06-15status $60,000 Active 47 DOM
-
2026-06-07statusdays on market $60,000 Pending 47 DOM
-
2026-06-03days on market $60,000 Active 46 DOM
-
2026-06-03days on market $60,000 Active 45 DOM
-
2026-06-01days on market $60,000 Active 44 DOM
-
2026-05-31days on market $60,000 Active 43 DOM
-
2026-05-07status Pending
-
2026-04-30price $60,000
-
2026-04-23price $70,000
-
2026-04-11price $80,000
-
2026-03-30$90,000 Active
-
2019-02-07soldstatus $170,000
ⓘ Source: listings_history table (triggers on properties + properties_extension) + one-shot
backfill from property_details.listing_events for pre-trigger history.
Tax reassessment forecast SC · Resets to sale price
- Current annual tax
- $1,218 · $102/mo
- Projected year-2 tax
- $1,218 · $102/mo
- Expected delta
- $0/yr ($0/mo · 0.0%)
ⓘ Screening estimate from a state-policy table — verify with the county assessor before closing.
Climate risk First Street
- Flood 1/10 Low FEMA zone X (unshaded) · 0% chance over 30 yrs
- Wildfire 4/10 Moderate
- Heat 6/10 Major 7 d/yr ≥106°F today · 16 d/yr by 30 yrs out
- Wind 6/10 Major 49% chance of damaging wind over 30 yrs
- Air quality 2/10 Low 1 unhealthy d/yr today · 1 by 30 yrs out
Nearby sold comps map
Loading sold comps map…
Walkable amenities ~0.75 mi
Loading nearby amenities…
Taxation est. · year 1
- Rental income
- $13,987
- − Mortgage interest
- −$3,361
- − Property taxes
- −$1,218
- − Insurance
- −$300
- − Repairs & maintenance
- −$1,119
- − Management
- −$1,119
- − Depreciation
- −$1,745
- Taxable income
- $5,125
- Est. tax owed @ 24.0%
- −$1,230
- After-tax cash flow
- $4,526/yr
For passive investors: Depreciation is non-cash, so a rental often shows a tax loss while cash-flowing — sheltering income. Rental losses are passive: they offset passive income freely, and up to $25,000/yr can offset ordinary (W-2) income if you actively participate and your MAGI is under $100k (phasing out to $0 by $150k); unused losses carry forward. On sale, claimed depreciation is recaptured at up to 25%, and gains may owe capital-gains tax (a 1031 exchange can defer both). Figures are a year-1 estimate at your 24.0% rate — not tax advice; consult a CPA.
Schools (NCES district)
- District
- Fairfield 01
- NCES district ID
- 4502100
- Math proficiency
- 26% ▼ -10.00%
- Reading proficiency
- 38% ▲ 4.00%
- Median HH income
- $34,836
- Composite
- 26.37/100
- National rank
- #7232
- State rank
- #53 of 80 in SC
Livability — Winnsboro Mills
- Score
- 58/100
- State rank
- #265
- US rank
- #21184
Category grades
Schools grade is shown separately in the Schools card above.
Census & demographics
- Census place
- Winnsboro Mills, SC
- County
- Fairfield County · 11,730 people
- Metro
- Columbia, SC
- Population (ZIP)
- 11,730
- Household income
- $43,330
- Rent vs Own
- Severe rent burden
- 367.0
Population outlook (Fairfield County) Hauer SSP2
- Today (2025)
- 21,017 people
- By 2030
- 19,778 · -5.9%
- By 2040
- 16,973 · -19.2%
- By 2050
- 14,251 · -32.2%
- By 2075
- 9,195 · -56.2%
- By 2100
- 5,722 · -72.8%
Race, ethnicity, and origin ACS 2023
- Neighborhood character
- Majority Black (56%)
- Race & ethnicity
- Black 56% White 38% Two or more races 5% Hispanic / Latino 2%
- Common ancestry
- Serbian 1% Lithuanian 1% Slovak 1%
- Foreign-born
- 1% · Canada
- Languages at home
- 97% English-only · Spanish 2%
Political lean MEDSL · Fairfield
- 2024 margin
- D (+13.2) · D 56.0% · R 42.7% · Other 1.3%
- 2008→2024 swing
- -18.4pp toward R · 2008: 31.7pp · 2024: 13.2pp
- All cycles
- 2024: D+13.2 2020: D+22.7 2016: D+25.9 2012: D+31.6 2008: D+31.7
Not yet ingested
- Civics
- —
Market trends
- HPI YoY
- ▼ -60.28%
- Current HPI
- 135.9723
- Rent YoY
- —
- Metro
- Columbia, SC
- State GDP YoY
- ▲ 4.51%
- F500 in state
- 2
Industry mix (Fortune 500 HQ in SC)
| Industry | F500 HQs | Revenue |
|---|---|---|
| Packaging | 1 | $7B |
|
||
Price history
-64.7% since first listed6 events — show timeline
- 2026-05-07 Pending — Consolidated MLS
- 2026-04-30 Price Changed $60,000 Consolidated MLS
- 2026-04-23 Price Changed $70,000 Consolidated MLS
- 2026-04-11 Price Changed $80,000 Consolidated MLS
- 2026-03-30 Listed $90,000 Consolidated MLS
- 2019-02-07 Sold (Public Records) $170,000 Public Records
Property tax history
+4.7%/yrLatest (2025): $1,218 · +18.7% YoY. Source: county tax records.
Cash-flow waterfall
monthlySold comps — $/sqft
last 12 mo · ≤1 miLoading sold comps…