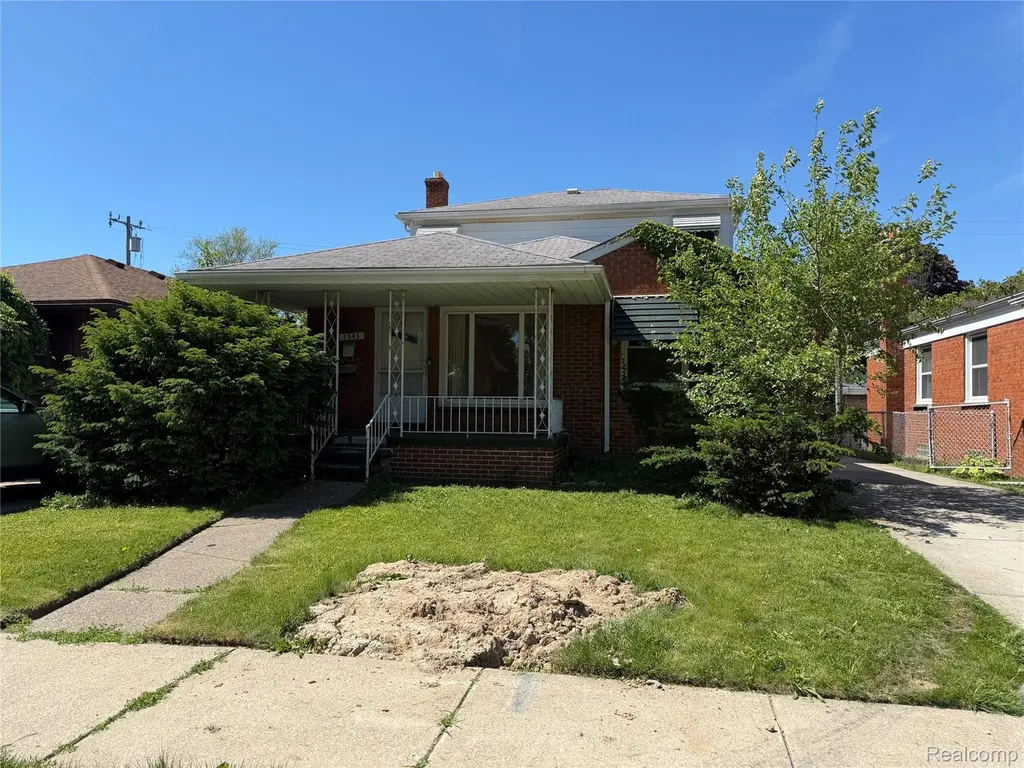
1543 Arlington Ave · Lincoln Park, MI
Flood risk 1/10 · Minimal
- FEMA flood zone
- X (unshaded)
- Chance of flooding over 30 yrs
- 0.0%
- Est. flood insurance / yr
- $473 – $860
Fire risk 1/10 · Minimal
- Est. fire insurance / yr
- $784 – $1,456
Heat risk 3/10 · Minor
- Hot days now (above 97°F)
- 7 days/yr
- Hot days in 30 yrs
- 15 days/yr
Wind risk 2/10 · Minimal
- Chance of severe wind over 30 yrs
- —
Air-quality risk 3/10 · Minor
- Unhealthy air days now
- 2 days/yr
- Unhealthy air days in 30 yrs
- 4 days/yr
Risk factors via First Street. Map © Google.
Why this score? — see what drove the B- grade
The composite is a weighted blend of 9 inputs, each scored 0–100. Each bar is that input's sub-score; the figure is the points it added to the 100-point composite (weight × sub-score).
- Cash flow +25.8/30.0
- ARV discount +13.5/15.0
- DSCR +8.6/10.0
- 1% rule +6.7/10.0
- Livability +4.0/5.0
- Rent growth +3.7/5.0
- Condition / age +2.5/5.0
- Schools +2.0/10.0
- Appreciation +0.0/10.0
$139,900
🖨 Deal sheet 📄 Offer letter ✓ Due diligence
Listing remarks MLS
Opportunity knocks!! Great potential! Four bedroom 2 full bath colonial with an oversize garage on a full basement at a really great price!! Price reflects needed repairs and or updates. Being sold strictly as-is. .. seller will do no cleanout nor any repairs. Hardwood under carpet. First floor bath is full ceramic. No FHA or VA offers please. All sizes shown are strictly estimates. Information contained in this listing is deemed reliable but not guaranteed. .. .. .buyer or buyer's agent to verify all information. Seller will not consider offers where purchaser has not viewed first. Buyer to order any required city inspections and perform any required repairs at buyer's expense after closing for Certificate of Occupancy. Owner is a licensed broker in the state of Michigan. A licensed agent must be physically present for all showings…NO EXCEPTIONS.
Key facts
- 4,356 sq ft lot
- 2 garage spots
- Built 1956
Property features AI
Finance
- Other: Directions: Enter Arlington west off Fort St; Subdivision: Elmwood Heights Sub; Cross streets: North of Southfield Rd & west of Fort St
- Financial info: No additional financial details provided
- HOA & community: No HOA information provided
Exterior
- Parking: Detached garage with about 2.5 garage spaces
- Security: No security features provided
- Utilities: Public water; Public sewer
- Home design: Single-family residence; Two levels; Ground-level entry with steps; Aluminum siding and brick exterior
- Construction: Block foundation
- Exterior features: Paved road access; Lot dimensions approximately 40 x 113 (0.1 acre); No pool
Interior
- Kitchen: No kitchen appliance details provided
- Bedrooms: Total of 7 rooms (bedroom count not specified)
- Flooring: No flooring information provided
- Bathrooms: 2 full bathrooms
- Heating & cooling: Forced air heating (natural gas); Central air conditioning; Ceiling fan(s)
- Interior features: Gas water heater; Unfinished basement
- Laundry & utility: No laundry details provided
Neighborhood map
What this means for you Summary
Snapshot
- This is a 4-bed/2.0-bath single-family listed at $140k.
Deal economics
- At list price, monthly cash flow is $338 ($4k/yr) — positive.
- The deal already cash-flows at list — no discount required.
- Meets the 1% rule at list price ($2k rent vs $140k).
- Cap rate 9.2% vs local median 6.4% in Lincoln Park — top-decile yield for the area; either an underpriced asset or a hidden risk that comps aren't pricing in. Stress-test before assuming the spread holds.
Location & tenants
- Location reads 80/100 on livability (#82 in MI, #1,720 nationally) — a professional / high-income tenant draw. Strengths: amenities A+, commute A+, cost of living A+; Watch: schools D-, crime F, employment D-.
- Lincoln Park School District (suburban): math 15% / reading 32% proficiency, ranked #440 of 540 in MI (top 82%) — low school quality limits family demand, transient renter base, plan for 1-2y turnover; 72% free/reduced lunch — lower-income household profile, screen leases tightly.
- Market conditions: Rents rising fast (+4.7%/yr); 151 active listings in the ZIP; 5 comparable units currently listed for rent nearby; rentals leasing fast (median 2d on market — plan ~1-2 weeks tenant-placement turnaround); 2,639 units permitted in Wayne County in 2024 (1,216 in 5+ unit buildings).
- This rent runs 34% of the median local income ($59k/yr) — at the standard rent-burdened threshold; future hikes will face affordability resistance.
Forward outlook
- Local home prices are declining (-3.0%/yr); year-one equity from $967 of loan paydown is wiped out by about $4k of value loss. Plan a longer hold.
- Wayne County population projected at -17% by 2050 — secular population decline; favor cash flow + early exit over multi-decade hold.
- At projected returns (-3.0% appreciation + 4.7% rent growth), your $39k cash investment doubles in ~9 years — after that, you're playing with house money.
Negotiation context
- Only 8 days on market — expect competitive offers; lowballing is unlikely to land.
- 2 sale attempts with the ask held roughly flat each time — persistent listings suggest the price (not the market) is what's stuck; bring a comps-based counter.
Risks & watch-outs
- Watch-outs: built in 1956 — expect roof / HVAC / electrical / plumbing capex.
Questions for the listing agent
- Built in 1956 — when were the roof, HVAC, electrical panel, plumbing, and water heater last replaced?
- Is there a deadline driving the sale (1031 exchange, divorce, estate, relocation)? That informs how much negotiation room exists.
- Schools are D-rated, which usually means shorter tenancies and higher turnover. Who's the typical renter profile here, and what's been the actual vacancy rate?
- Crime grade is F in this area — have there been break-ins, vandalism, or insurance claims at this property in the last 3 years? What carrier currently insures it and at what premium?
- What's the average days-on-market for RENTAL listings here right now (not sales)? A rising rental-DOM trend means longer vacancies and softer asking-rent achievability than the comps imply.
- What's the recent tenant-quality profile in this submarket — average credit score on applications, eviction rate, late-payment / NSF rate, and stable-employment percentage? A property-management company in the area should have these aggregated.
- How much new for-sale + rental construction is in the pipeline within 1–3 miles? Heavy new supply typically softens prices + rents 12–24 months out; constrained supply supports both.
Investment metrics
- 1% rule
- 1.17% ✓
- Cap rate
- 9.19%
- Cash-on-cash
- 10.35%
- DSCR
- 1.46
- GRM
- 7.1
CMA / ARV
- ARV (on-the-fly)
- $161,460
- Comps found
- 12
Show comp detail 12 sales within ~0.75 mi
| Address | Dist | Beds/Ba | Sqft | Sold | Price | $/sf | Match |
|---|---|---|---|---|---|---|---|
| 1417 Lincoln Ave | 0.42mi | 3/2.0 (-1) | 1,368 (-3%) | 3mo | $160,000 | $117 | 69 |
| 1784 Anne Ave | 0.35mi | 3/2.0 (-1) | 1,468 (+5%) | 4mo | $149,899 | $102 | 68 |
| 1424 Cicotte Ave | 0.42mi | 5/1.5 (+1) | 1,344 (-4%) | 4mo | $155,000 | $115 | 64 |
| 1472 Philomene Blvd | 0.25mi | 3/2.0 (-1) | 1,574 (+12%) | 0mo | $185,000 | $118 | 63 |
| 1519 Fort Park Blvd | 0.31mi | 4/2.5 | 1,587 (+13%) | 2mo | $137,000 | $86 | 60 |
| 1458 Cicotte Ave | 0.41mi | 4/2.0 | 1,592 (+13%) | 4mo | $145,000 | $91 | 55 |
| 1575 Philomene Blvd | 0.29mi | 3/1.0 (-1) | 1,200 (-14%) | 3mo | $130,000 | $108 | 51 |
| 1214 Lincoln Ave | 0.52mi | 3/1.5 (-1) | 1,230 (-12%) | 1mo | $188,000 | $153 | 47 |
| 1133 Mill St | 0.67mi | 3/1.0 (-1) | 1,512 (+8%) | 1mo | $170,000 | $112 | 46 |
| 1812 Hanford Ave | 0.52mi | 3/1.0 (-1) | 1,566 (+12%) | 3mo | $120,500 | $77 | 46 |
| 1558 College Ave | 0.55mi | 5/2.0 (+1) | 1,600 (+14%) | 2mo | $200,000 | $125 | 44 |
| 2933 Fort Park Ave | 0.74mi | 4/2.5 | 1,563 (+11%) | 1mo | $206,000 | $132 | 44 |
Match score weights: distance 35% · size 25% · config 20% · recency 20%. Top-matched comps best support the ARV.
Projected returns pro-forma
-3.0% appreciation · 4.65% rent growth · sell at horizon
- IRR
- 1.1%
- Equity multiple
- 1.04×
- Total profit
- $1,652
- Equity at exit
- $20,860
- IRR
- 12.3%
- Equity multiple
- 2.05×
- Total profit
- $41,011
- Equity at exit
- $12,096
Cash invested: $39,172 (down + closing). Projections, not guarantees.
Landlord ↔ Tenant lean methodology
- Overall (STATE)
- 62 Landlord-Friendly
- State Michigan
- 62 Landlord-Friendly · EVEN
- County
- — inherits STATE
- City
- — inherits STATE
ZIP-level market 48146
- Home prices YoY
- -32.7%
- Rents YoY
- 4.7%
- Active inventory
- 151
- Price-to-rent
- 7.1×
Monthly cashflow live
- Estimated rent
- $1,643 high interval (Pro) →
- Mortgage (P&I)
- −$734
- Tax from tax record
- −$168 /mo · $2,019/yr
- Insurance
- −$58
- HOA
- −$0
- Vacancy / Maint / Mgmt
- −$345
- Net cashflow
- $338
Break-even live
UW: 25.0% down · 7.5% · 30yr · 1.5% tax · 5.0% vac · 8.0% maint · 8.0% mgmt
Financing live
Cash to close
- Down payment
- $34,975
- Closing costs
- $4,197
- Reserves months
- —
- Total cash needed
- —
Loan-product check · same deal, 3 products live
Conventional
25% down · 7.5% · 30yr
- Down + closing
- —
- Monthly P&I
- —
- Monthly cashflow
- —
- DSCR
- —
- Eligible?
- —
Personal DTI + credit; lowest rate.
DSCR
20% down · 8.5% · 30yr
- Down + closing
- —
- Monthly P&I
- —
- Monthly cashflow
- —
- DSCR
- —
- Eligible?
- —
No personal income docs; deal must DSCR.
Hard money
10% down · 12.0% · 12mo
- Down + closing
- —
- Monthly P&I
- —
- Monthly cashflow
- —
- DSCR
- —
- Eligible?
- —
Short-term bridge; refi at stabilization.
Rent comps 5 comps
| Address | Beds | Baths | Sqft | Rent | $/sqft | DOM | Units | Dist |
|---|---|---|---|---|---|---|---|---|
| 1774 College Ave Lincoln Park, MI | 3.0 | 1.0 | 944 | $1,525 | $1.62 | 2d | 1 | 0.63mi |
| 1473 Empire Ave Lincoln Park, MI | 3.0 | 2.0 | 1342 | $1,700 | $1.27 | 2d | 1 | 1.00mi |
| 3575 S Ethel St Detroit, MI | 3.0 | 1.0 | 894 | $1,350 | $1.51 | 17d | 1 | 1.20mi |
| 4015 16th St Ecorse, MI | 3.0 | 1.5 | 1170 | $1,300 | $1.11 | 24d | 1 | 1.37mi |
| 15806 Meyer Ave Allen Park, MI | 3.0 | 2.0 | 1100 | $1,650 | $1.50 | 2d | 1 | 1.45mi |
Listing history 7 events
-
2026-06-13statusdays on market $139,900 Pending 8 DOM
-
2026-06-09days on market $139,900 Active 7 DOM
-
2026-06-08days on market $139,900 Active 6 DOM
-
2026-06-07days on market $139,900 Active 5 DOM
-
2026-06-04days on market $139,900 Active 2 DOM
-
2026-06-03remarks 699-char remark
-
2026-06-03$139,900 Active 1 DOM
ⓘ Source: listings_history table (triggers on properties + properties_extension) + one-shot
backfill from property_details.listing_events for pre-trigger history.
Tax reassessment forecast MI · Partial reset (capped growth)
- Current annual tax
- $2,019 · $168/mo
- Projected year-2 tax
- $2,087 · $174/mo
- Expected delta
- +$68/yr (+$6/mo · 3.4%)
ⓘ Screening estimate from a state-policy table — verify with the county assessor before closing.
Climate risk First Street
- Flood 1/10 Low FEMA zone X (unshaded) · 0% chance over 30 yrs
- Wildfire 1/10 Low
- Heat 3/10 Moderate 7 d/yr ≥97°F today · 15 d/yr by 30 yrs out
- Wind 2/10 Low
- Air quality 3/10 Moderate 2 unhealthy d/yr today · 4 by 30 yrs out
Nearby sold comps map
Loading sold comps map…
Walkable amenities ~0.75 mi
Loading nearby amenities…
Taxation est. · year 1
- Rental income
- $19,719
- − Mortgage interest
- −$7,837
- − Property taxes
- −$2,019
- − Insurance
- −$700
- − Repairs & maintenance
- −$1,578
- − Management
- −$1,578
- − Depreciation
- −$4,070
- Taxable income
- $1,939
- Est. tax owed @ 24.0%
- −$465
- After-tax cash flow
- $3,591/yr
For passive investors: Depreciation is non-cash, so a rental often shows a tax loss while cash-flowing — sheltering income. Rental losses are passive: they offset passive income freely, and up to $25,000/yr can offset ordinary (W-2) income if you actively participate and your MAGI is under $100k (phasing out to $0 by $150k); unused losses carry forward. On sale, claimed depreciation is recaptured at up to 25%, and gains may owe capital-gains tax (a 1031 exchange can defer both). Figures are a year-1 estimate at your 24.0% rate — not tax advice; consult a CPA.
Schools (NCES district)
- District
- Lincoln Park School District
- NCES district ID
- 2621600
- Math proficiency
- 15% ▼ -5.00%
- Reading proficiency
- 32% ▬ 0.00%
- Median HH income
- $41,486
- Composite
- 19.93/100
- National rank
- #8678
- State rank
- #440 of 540 in MI
Livability — Lincoln Park
- Score
- 80/100
- State rank
- #82
- US rank
- #1720
Category grades
Schools grade is shown separately in the Schools card above.
Census & demographics
- Census place
- Lincoln Park, MI
- County
- Wayne County · 1,562,939 people
- City population
- 39,257
- Metro
- Detroit-Warren-Dearborn, MI
- Population (ZIP)
- 39,257
- Household income
- $58,616
- Rent vs Own
- Severe rent burden
- 1142.0
Population outlook (Wayne County) Hauer SSP2
- Today (2025)
- 1,675,273 people
- By 2030
- 1,620,300 · -3.3%
- By 2040
- 1,502,341 · -10.3%
- By 2050
- 1,384,039 · -17.4%
- By 2075
- 1,124,592 · -32.9%
- By 2100
- 881,193 · -47.4%
Race, ethnicity, and origin ACS 2023
- Neighborhood character
- Diverse neighborhood (Simpson 0.57)
- Race & ethnicity
- White 60% Hispanic / Latino 25% Two or more races 12% Black 9% Native American 1%
- Hispanic origin (detail)
- Mexican 19% Puerto Rican 3%
- Common ancestry
- Romanian 6% Lithuanian 4% Slovak 1%
- Foreign-born
- 9% · Canada
- Languages at home
- 80% English-only · Spanish 17% Arabic 2%
Political lean MEDSL · Wayne
- 2024 margin
- Strong D (+29.0) · D 62.7% · R 33.7% · Other 3.6%
- 2008→2024 swing
- -20.5pp toward R · 2008: 49.5pp · 2024: 29.0pp
- All cycles
- 2024: D+29.0 2020: D+38.1 2016: D+37.3 2012: D+46.9 2008: D+49.5
Not yet ingested
- Civics
- —
Market trends
- HPI YoY
- ▼ -108.25%
- Current HPI
- 222.8545
- Rent YoY
- ▲ 4.65%
- Metro
- Detroit-Warren-Dearborn, MI
- State GDP YoY
- ▲ 1.37%
- F500 in state
- 28
Industry mix (Fortune 500 HQ in MI)
| Industry | F500 HQs | Revenue |
|---|---|---|
| Automotive Parts | 3 | $48B |
|
||
| Automotive | 2 | $372B |
|
||
| Chemicals | 1 | $45B |
|
||
| Automotive Retail | 1 | $29B |
|
||
| Healthcare / Medical Devices | 1 | $23B |
|
||
| Automotive Technology | 1 | $20B |
|
||
Price history
+0.0% since first listed2 events — show timeline
- 2026-06-02 Listed $139,900 MiRealSource-MiMLS
- 2026-06-02 Listed $139,900 REALCOMP
Property tax history
+1.9%/yrLatest (2025): $2,019 · +0.5% YoY. Source: county tax records.
Cash-flow waterfall
monthlySold comps — $/sqft
last 12 mo · ≤1 miLoading sold comps…