 Triplex
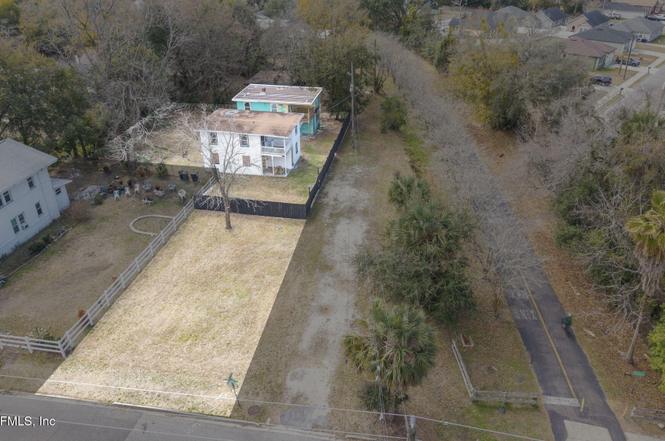
1036 W 12th St · Jacksonville, FL
Flood risk 1/10 · Minimal
- FEMA flood zone
- X (unshaded)
- Chance of flooding over 30 yrs
- 0.0%
- Est. flood insurance / yr
- $507 – $1,088
Fire risk 1/10 · Minimal
- Est. fire insurance / yr
- $947 – $1,759
Heat risk 9/10 · Severe
- Hot days now (above 107°F)
- 7 days/yr
- Hot days in 30 yrs
- 19 days/yr
Wind risk 9/10 · Severe
- Chance of severe wind over 30 yrs
- 99.0%
Air-quality risk 4/10 · Minor
- Unhealthy air days now
- 6 days/yr
- Unhealthy air days in 30 yrs
- 6 days/yr
Risk factors via First Street. Map © Google.
Why this score? — see what drove the C+ grade
The composite is a weighted blend of 9 inputs, each scored 0–100. Each bar is that input's sub-score; the figure is the points it added to the 100-point composite (weight × sub-score).
- Cash flow +29.1/30.0
- DSCR +10.0/10.0
- 1% rule +8.2/10.0
- Livability +4.2/5.0
- Schools +3.9/10.0
- Rent growth +3.0/5.0
- Condition / age +2.5/5.0
- ARV discount +0.0/15.0
- Appreciation +0.0/10.0
$259,000
🖨 Deal sheet (PDF) 📄 Offer letter ✓ Due diligence
Multi-family units
County records classify this as Multi-Family (5+ Unit). Listing-text estimate: 3 units. estimate disagrees with records
5+ unit building — per-unit beds/baths from public records are typically unavailable; the breakdown below (if shown) is an estimate from the listing text.
Listing remarks
Value add opportunity for the multi-family investor! 2 duplexes on ONE parcel - 4 doors in all. This block build quadraplex provides potential cash flow. Each building contains two 2 bed, one bath units, equaling 8 bedrooms and 4 baths total. All units have NEW dual paned windows! Unit 1036/1038 has new roof, decking, new electrical panel and much more. Units 1040/1042 are a blank canvas to finish out with your vision. Seller is motivated - cash or hard money offers only! Great opportunity for the seasoned investor! Showings by appointment only!
Key facts
- 0.28 acre lot
- 8 parking spots
- Built 1956
Property features AI
Finance
- Financial info: Annual taxes listed (see listing for amount and year)
Exterior
- Parking: Off-street parking lot with space for 8 vehicles
- Utilities: Electricity available; Sewer available; Water available
- Home design: Quadruplex (residential); 2 buildings
- Construction: Block construction; Other roof
- Exterior features: Chain link and wood fencing; Irregular lot; City street frontage; Asphalt road surface
Interior
- Bedrooms: 8 total bedrooms
- Flooring: Vinyl and other
- Bathrooms: 4 full bathrooms
- Heating & cooling: Heating available (type: other); Cooling available (type: other)
- Interior features: Vinyl and other flooring
Neighborhood map
What this means for you Summary
Snapshot
- This is a 3 × 3-bed/1.3-bath units multifamily listed at $259k.
Deal economics
- At list price, monthly cash flow is $892 ($11k/yr) — positive. Per door: $297/mo.
- The deal already cash-flows at list — no discount required.
- Meets the 1% rule at list price ($3k rent vs $259k).
- Recommended offer: $236k (9.0% below list) — sets the bar for market timing.
- Cap rate 10.4% vs local median 3.9% in Jacksonville — top-decile yield for the area; either an underpriced asset or a hidden risk that comps aren't pricing in. Stress-test before assuming the spread holds.
Location & tenants
- Location reads 83/100 on livability (#50 in FL, #911 nationally) — a professional / high-income tenant draw. Strengths: amenities A+, commute A+, housing A+.
- Duval (urban): math 46% / reading 45% proficiency, ranked #48 of 73 in FL (top 66%) — families likely to look elsewhere, expect single-tenant / working-renter base with shorter leases.
- Zoned schools: Northwestern Legends Elementary (math 21% / reading 14%, grade F, #2,117 of 2,144 statewide, top 99%, 528 students, 88% FRL); Joseph Stilwell Middle School (math 31% / reading 33%, grade F, #448 of 571 statewide, top 79%, 612 students, 68% FRL); William M. Raines High School (math 14% / reading 13%, grade F, #616 of 667 statewide, top 92%, 1,217 students, 78% FRL) — zoned schools average 78% FRL vs 49% district-wide (29 pts higher); higher-poverty schools than district average — tighter screening recommended.
- Zoned-school proficiency averages 21% at this address vs 46% district-wide (-24 pts) — the specific schools serving this property underperform the Duval average; the district grade overstates school quality for this exact location.
- Market conditions: Rents rising (+1.8%/yr); 399 active listings in the ZIP; 40 comparable units currently listed for rent nearby; rentals at typical pace (median 25d on market — plan ~3-4 weeks tenant-placement turnaround); lower-income renter base — watch delinquency; 6,503 units permitted in Duval County in 2024 (1,131 in 5+ unit buildings).
Forward outlook
- Local home prices are declining (-3.0%/yr); year-one equity from $2k of loan paydown is wiped out by about $8k of value loss. Plan a longer hold.
- Duval County population projected at +19% by 2050 — long-run rental-demand tailwind backs the buy-and-hold thesis.
- At projected returns (-3.0% appreciation + 1.8% rent growth), your $73k cash investment doubles in ~9 years — after that, you're playing with house money.
Negotiation context
- It's been on market 107 days — a 9% lower offer ($236k) is reasonable based on typical stale-listing flexibility.
- Current owner paid $119k; list at $259k implies a 118% gain — meaningful room to come down on a strong offer.
Risks & watch-outs
- Watch-outs: built in 1956 — expect roof / HVAC / electrical / plumbing capex.
- Climate carrying-cost: severe wind risk, 99% chance of damaging wind over 30y; extreme-heat days projected 7→19/yr by 2055 (HVAC capex compounding) — expect insurance premiums to compound above CPI over the hold.
Questions for the listing agent
- It's been on market 107 days. Have you received any prior offers? Is the seller open to a 9% concession, seller financing, or rate buy-down credit?
- Can we see the unit-by-unit rent roll, current vacancy, and any below-market leases? What's the average tenancy length?
- What capital expenditures (roof, boiler, parking lot, exteriors) have been made in the last 5 years, and what's planned in the next 2?
- Built in 1956 — when were the roof, HVAC, electrical panel, plumbing, and water heater last replaced?
- Why hasn't it sold? Are there any deal-killer items the seller is aware of (foundation, flood, title, zoning, code violations)?
- Is there a deadline driving the sale (1031 exchange, divorce, estate, relocation)? That informs how much negotiation room exists.
- Schools are B-rated — typically a magnet for longer-tenancy family renters. What's the average tenant stay here, and is there a school-zone premium baked into asking?
- What's the average days-on-market for RENTAL listings here right now (not sales)? A rising rental-DOM trend means longer vacancies and softer asking-rent achievability than the comps imply.
- What's the recent tenant-quality profile in this submarket — average credit score on applications, eviction rate, late-payment / NSF rate, and stable-employment percentage? A property-management company in the area should have these aggregated.
- How much new apartment / multifamily construction is in the pipeline within 1–3 miles? Heavy new supply (>2% of stock underway) typically softens rents 12–24 months out; light construction supports rent growth.
Investment metrics
- 1% rule
- 1.32% ✓
- Cap rate
- 10.43%
- Cash-on-cash
- 14.77%
- DSCR
- 1.66
- GRM
- 6.3
CMA / ARV
- ARV (on-the-fly)
- $175,392
- Comps found
- 4
Show comp detail 4 sales within ~0.75 mi
| Address | Dist | Beds/Ba | Sqft | Sold | Price | $/sf | Match |
|---|---|---|---|---|---|---|---|
| 1431-1433 McConihe St | 0.56mi | 4/2.0 | 1,352 (-3%) | 6mo | $60,280 | $45 | 65 |
| 1325 W 25th St | 0.75mi | 4/2.0 | 1,440 (+3%) | 0mo | $174,000 | $121 | 59 |
| 1538 Ella St | 0.69mi | 4/2.0 | 1,344 (-3%) | 8mo | $170,000 | $126 | 56 |
| 1544 Ella St | 0.70mi | 4/2.0 | 1,344 (-3%) | 18mo | $190,000 | $141 | 47 |
Match score weights: distance 35% · size 25% · config 20% · recency 20%. Top-matched comps best support the ARV.
Projected returns pro-forma
-3.0% appreciation · 1.81% rent growth · sell at horizon
- IRR
- 3.9%
- Equity multiple
- 1.15×
- Total profit
- $10,891
- Equity at exit
- $38,618
- IRR
- 12.3%
- Equity multiple
- 1.92×
- Total profit
- $66,746
- Equity at exit
- $22,394
Cash invested: $72,520 (down + closing). Projections, not guarantees.
Landlord ↔ Tenant lean methodology
- Overall (STATE)
- 87 Strongly Landlord-Friendly
- State Florida
- 87 Strongly Landlord-Friendly · R+3
- County
- — inherits STATE
- City
- — inherits STATE
ZIP-level market 32209
- Home prices YoY
- -22.1%
- Rents YoY
- 1.8%
- Active inventory
- 399
- Price-to-rent
- 19.0×
Monthly cashflow live
- Estimated rent
- $3,408 medium interval (Pro) →
- Mortgage (P&I)
- −$1,358
- Tax from tax record
- −$334 /mo · $4,006/yr
- Insurance
- −$108
- HOA
- −$0
- Vacancy / Maint / Mgmt
- −$716
- Net cashflow
- $892
Break-even live
Sensitivity live
| Price | -10% $1,039 | -5% $966 | +0% $892 | +5% $819 | +10% $746 |
|---|---|---|---|---|---|
| Rent | -10% $623 | -5% $758 | +0% $892 | +5% $1,027 | +10% $1,162 |
| Rate | -1.0pp $1,023 | -0.5pp $958 | base $892 | +0.5pp $825 | +1.0pp $757 |
3-unit breakdown (identical units grouped — click to expand)
| Units | Beds | Baths | Est. rent |
|---|---|---|---|
| 3× units | 3 | 1.3 | $3,408 |
| #1 | 3 | 1.3 | $1,136 |
| #2 | 3 | 1.3 | $1,136 |
| #3 | 3 | 1.3 | $1,136 |
| Total (3 units) | $3,408 | ||
UW: 25.0% down · 7.5% · 30yr · 1.5% tax · 5.0% vac · 8.0% maint · 8.0% mgmt
Financing live
Cash to close
- Down payment
- $64,750
- Closing costs
- $7,770
- Reserves months
- —
- Total cash needed
- —
Loan-product check · same deal, 3 products live
Conventional
25% down · 7.5% · 30yr
- Down + closing
- —
- Monthly P&I
- —
- Monthly cashflow
- —
- DSCR
- —
- Eligible?
- —
Personal DTI + credit; lowest rate.
DSCR
20% down · 8.5% · 30yr
- Down + closing
- —
- Monthly P&I
- —
- Monthly cashflow
- —
- DSCR
- —
- Eligible?
- —
No personal income docs; deal must DSCR.
Hard money
10% down · 12.0% · 12mo
- Down + closing
- —
- Monthly P&I
- —
- Monthly cashflow
- —
- DSCR
- —
- Eligible?
- —
Short-term bridge; refi at stabilization.
Rent comps 40 comps
| Address | Beds | Baths | Sqft | Rent | $/sqft | DOM | Units | Dist |
|---|---|---|---|---|---|---|---|---|
| 2313 Janette St Jacksonville, FL | 4.0 | 2.0 | 1148 | $1,349 | $1.18 | 18d | 1 | 0.05mi |
| 2904 Moncrief Rd Jacksonville, FL | 3.0 | 1.0 | 952 | $1,100 | $1.16 | 25d | 1 | 0.34mi |
| 1018 W 23rd St Jacksonville, FL | 3.0 | 2.5 | 1161 | $1,600 | $1.38 | 25d | 1 | 0.49mi |
| 503 W 16th St Jacksonville, FL | 4.0 | 1.5 | 1216 | $1,420 | $1.17 | 25d | 1 | 0.54mi |
| 1454 Francis St Jacksonville, FL | 3.0 | 2.0 | 1084 | $1,243 | $1.15 | 25d | 1 | 0.57mi |
| 1410 W 20th St Jacksonville, FL | 3.0 | 2.0 | 1170 | $1,485 | $1.27 | 15d | 1 | 0.58mi |
| 1029 W 25th St Unit 1 Jacksonville, FL | 5.0 | 2.0 | 1410 | $2,200 | $1.56 | 25d | 1 | 0.61mi |
| 1025 W 25th St Unit 1 Jacksonville, FL | 5.0 | 2.0 | 1500 | $2,000 | $1.33 | 25d | 1 | 0.61mi |
| 522 W 21st St Jacksonville, FL | 3.0 | 2.0 | 1045 | $1,350 | $1.29 | 25d | 1 | 0.62mi |
| 1511 W 15th St Jacksonville, FL | 5.0 | 3.0 | 1720 | $2,100 | $1.22 | 25d | 1 | 0.64mi |
| 1431 W 21st St Jacksonville, FL | 3.0 | 2.0 | 1199 | $1,425 | $1.19 | 16d | 1 | 0.65mi |
| 1031 W 26th St Jacksonville, FL | 3.0 | 2.0 | 1261 | $1,445 | $1.15 | 25d | 1 | 0.65mi |
| 1525 W 15th St Jacksonville, FL | 3.0 | 1.0 | 1100 | $1,245 | $1.13 | 25d | 1 | 0.66mi |
| 1355 Grothe St Jacksonville, FL | 4.0 | 1.0 | 1312 | $1,350 | $1.03 | 19d | 1 | 0.69mi |
| 1173 W 27th St Jacksonville, FL | 3.0 | 1.0 | 1080 | $1,145 | $1.06 | 15d | 1 | 0.72mi |
| 1619 Whitner St Jacksonville, FL | 3.0 | 2.0 | 1547 | $1,150 | $0.74 | 3d | 1 | 0.73mi |
| 1201 W 27th St Jacksonville, FL | 3.0 | 2.0 | 1120 | $1,145 | $1.02 | 25d | 1 | 0.73mi |
| 1537 W 7th St Jacksonville, FL | 3.0 | 1.0 | 950 | $1,050 | $1.11 | 9d | 1 | 0.74mi |
| 1537 7th St W Unit B Jacksonville, FL | 3.0 | 1.0 | 950 | $1,050 | $1.11 | 25d | 1 | 0.74mi |
| 231 W 10th St Jacksonville, FL | 3.0 | 1.0 | 1200 | $1,500 | $1.25 | 25d | 1 | 0.75mi |
| 1220 W 28th St Jacksonville, FL | 3.0 | 1.0 | 1122 | $1,299 | $1.16 | 25d | 1 | 0.76mi |
| 1149 W 28th St Jacksonville, FL | 4.0 | 2.0 | 1344 | $1,302 | $0.97 | 25d | 1 | 0.76mi |
| 1478 W 5th St Jacksonville, FL | 3.0 | 1.0 | 960 | $1,225 | $1.28 | 25d | 1 | 0.76mi |
| 1478 W 5th St Jacksonville, FL | 3.0 | 1.0 | 960 | $1,225 | $1.28 | 6d | 1 | 0.76mi |
| 1288 W 28th St Jacksonville, FL | 4.0 | 1.5 | 1449 | $1,267 | $0.87 | 15d | 1 | 0.79mi |
| 347 W 23rd St Jacksonville, FL | 3.0 | 1.5 | 1176 | $1,112 | $0.95 | 9d | 1 | 0.83mi |
| 1358 Prince St Jacksonville, FL | 3.0 | 2.5 | 1044 | $1,350 | $1.29 | 25d | 1 | 0.85mi |
| 1358 Prince St Jacksonville, FL | 3.0 | 3.5 | 1044 | $1,350 | $1.29 | 23d | 1 | 0.85mi |
| 204 W 23rd St Jacksonville, FL | 3.0 | 1.0 | 960 | $1,225 | $1.28 | 3d | 1 | 0.92mi |
| 30 W 12th St Jacksonville, FL | 4.0 | 3.0 | 1792 | $2,580 | $1.44 | 3d | 1 | 0.92mi |
| 1740 W 9th St Jacksonville, FL | 4.0 | 2.0 | 1148 | $1,285 | $1.12 | 22d | 1 | 0.92mi |
| 1514 Silver St Jacksonville, FL | 3.0 | 2.0 | 1726 | $2,275 | $1.32 | 25d | 1 | 0.94mi |
| 3020 N Laura St Jacksonville, FL | 3.0 | 1.0 | 1162 | $1,300 | $1.12 | 25d | 1 | 0.94mi |
| 146 W 6th St Jacksonville, FL | 3.0 | 1.0 | 1600 | $1,475 | $0.92 | 21d | 1 | 0.95mi |
| 1730 W 19th St Jacksonville, FL | 3.0 | 2.0 | 1323 | $1,100 | $0.83 | 3d | 1 | 0.96mi |
| 1609 W 24th St Jacksonville, FL | 3.0 | 2.0 | 1169 | $1,223 | $1.05 | 23d | 1 | 0.96mi |
| 1645 W 23rd St Unit 2 Jacksonville, FL | 3.0 | 1.0 | 912 | $1,275 | $1.40 | 25d | 1 | 0.98mi |
| 421 Golfair Blvd Jacksonville, FL | 4.0 | 2.5 | 1761 | $1,381 | $0.78 | 18d | 1 | 0.98mi |
| 2306 Fairfax St Unit 1 Jacksonville, FL | 3.0 | 1.0 | 900 | $700 | $0.78 | 25d | 1 | 0.98mi |
| 1640 W 4th St Unit 1 Jacksonville, FL | 4.0 | 2.0 | 1119 | $1,675 | $1.50 | 21d | 1 | 1.00mi |
Listing history 18 events
-
2026-06-21days on market $259,000 Active 107 DOM
-
2026-06-18days on market $259,000 Active 104 DOM
-
2026-06-17days on market $259,000 Active 103 DOM
-
2026-06-16days on market $259,000 Active 102 DOM
-
2026-06-15days on market $259,000 Active 101 DOM
-
2026-06-10days on market $259,000 Active 95 DOM
-
2026-06-08days on market $259,000 Active 94 DOM
-
2026-06-07days on market $259,000 Active 93 DOM
-
2026-06-03days on market $259,000 Active 89 DOM
-
2026-06-02days on market $259,000 Active 88 DOM
-
2026-06-01days on market $259,000 Active 87 DOM
-
2026-05-31days on market $259,000 Active 86 DOM
-
2026-05-04price $299,000
-
2026-03-06$319,000 Active
-
2026-03-04price $319,000
-
2006-09-29soldstatus $119,000
-
1998-05-18soldstatus $36,000
-
1996-11-27soldstatus $20,000
ⓘ Source: listings_history table (triggers on properties + properties_extension) + one-shot
backfill from property_details.listing_events for pre-trigger history.
Tax reassessment forecast FL · Resets to sale price
- Current annual tax
- $4,006 · $334/mo
- Projected year-2 tax
- $4,006 · $334/mo
- Expected delta
- $0/yr ($0/mo · 0.0%)
ⓘ Screening estimate from a state-policy table — verify with the county assessor before closing.
Climate risk First Street
- Flood 1/10 Low FEMA zone X (unshaded) · 0% chance over 30 yrs
- Wildfire 1/10 Low
- Heat 9/10 Extreme 7 d/yr ≥107°F today · 19 d/yr by 30 yrs out
- Wind 9/10 Extreme 99% chance of damaging wind over 30 yrs
- Air quality 4/10 Moderate 6 unhealthy d/yr today · 6 by 30 yrs out
Nearby sold comps map
Loading sold comps map…
Walkable amenities ~0.75 mi
Loading nearby amenities…
Taxation est. · year 1
- Rental income
- $40,896
- − Mortgage interest
- −$14,508
- − Property taxes
- −$4,006
- − Insurance
- −$1,295
- − Repairs & maintenance
- −$3,272
- − Management
- −$3,272
- − Depreciation
- −$7,535
- Taxable income
- $7,009
- Est. tax owed @ 24.0%
- −$1,682
- After-tax cash flow
- $9,026/yr
For passive investors: Depreciation is non-cash, so a rental often shows a tax loss while cash-flowing — sheltering income. Rental losses are passive: they offset passive income freely, and up to $25,000/yr can offset ordinary (W-2) income if you actively participate and your MAGI is under $100k (phasing out to $0 by $150k); unused losses carry forward. On sale, claimed depreciation is recaptured at up to 25%, and gains may owe capital-gains tax (a 1031 exchange can defer both). Figures are a year-1 estimate at your 24.0% rate — not tax advice; consult a CPA.
Schools (NCES district)
- District
- Duval
- NCES district ID
- 1200480
- Math proficiency
- 46% ▼ -11.00%
- Reading proficiency
- 45% ▼ -4.00%
- Median HH income
- $48,987
- Composite
- 38.97/100
- National rank
- #4076
- State rank
- #48 of 73 in FL
Livability — Jacksonville
- Score
- 83/100
- State rank
- #50
- US rank
- #911
Category grades
Schools grade is shown separately in the Schools card above.
Census & demographics
- Census place
- Jacksonville, FL
- County
- Duval County · 1,015,274 people
- City population
- 979,034
- Metro
- Jacksonville, FL
- Population (ZIP)
- 34,657
- Household income
- $30,514
- Rent vs Own
- Severe rent burden
- 2921.0
Population outlook (Duval County) Hauer SSP2
- Today (2025)
- 1,013,010 people
- By 2030
- 1,059,228 · +4.6%
- By 2040
- 1,141,439 · +12.7%
- By 2050
- 1,205,258 · +19.0%
- By 2075
- 1,324,282 · +30.7%
- By 2100
- 1,319,620 · +30.3%
Race, ethnicity, and origin ACS 2023
- Neighborhood character
- Predominantly Black (88%)
- Race & ethnicity
- Black 88% White 5% Hispanic / Latino 5% Two or more races 2%
- Hispanic origin (detail)
- Puerto Rican 3%
- Common ancestry
- Hispanic 1% Romanian 1%
- Foreign-born
- 3% · Canada
- Languages at home
- 95% English-only · Spanish 4% French/Haitian/Cajun 1%
Political lean MEDSL · Duval
- 2024 margin
- Toss-up / Even · D 48.7% · R 50.1% · Other 1.2%
- 2008→2024 swing
- +0.4pp no change · 2008: -1.9pp · 2024: -1.5pp
- All cycles
- 2024: R+1.5 2020: D+3.8 2016: R+1.5 2012: R+3.6 2008: R+1.9
Not yet ingested
- Civics
- —
Market trends
- HPI YoY
- ▼ -53.92%
- Current HPI
- 189.5977
- Rent YoY
- ▲ 1.81%
- Metro
- Jacksonville, FL
- State GDP YoY
- ▲ 3.28%
- F500 in state
- 36
Industry mix (Fortune 500 HQ in FL)
| Industry | F500 HQs | Revenue |
|---|---|---|
| Industrial Technology | 2 | $29B |
|
||
| Insurance | 2 | $17B |
|
||
| Retail | 1 | $60B |
|
||
| Technology Distribution | 1 | $58B |
|
||
| Homebuilding | 1 | $35B |
|
||
| Technology Manufacturing | 1 | $35B |
|
||
Price history
+1395.0% since first listed6 events — show timeline
- 2026-05-04 Price Changed $299,000 realMLS
- 2026-03-06 Listed $319,000 realMLS
- 2026-03-04 Price Changed $319,000 realMLS
- 2006-09-29 Sold (Public Records) $119,000 Public Records
- 1998-05-18 Sold (Public Records) $36,000 Public Records
- 1996-11-27 Sold (Public Records) $20,000 Public Records
Property tax history
+10.7%/yrLatest (2025): $4,006 · +39.6% YoY. Source: county tax records.
Cash-flow waterfall
monthlySold comps — $/sqft
last 12 mo · ≤1 miLoading sold comps…