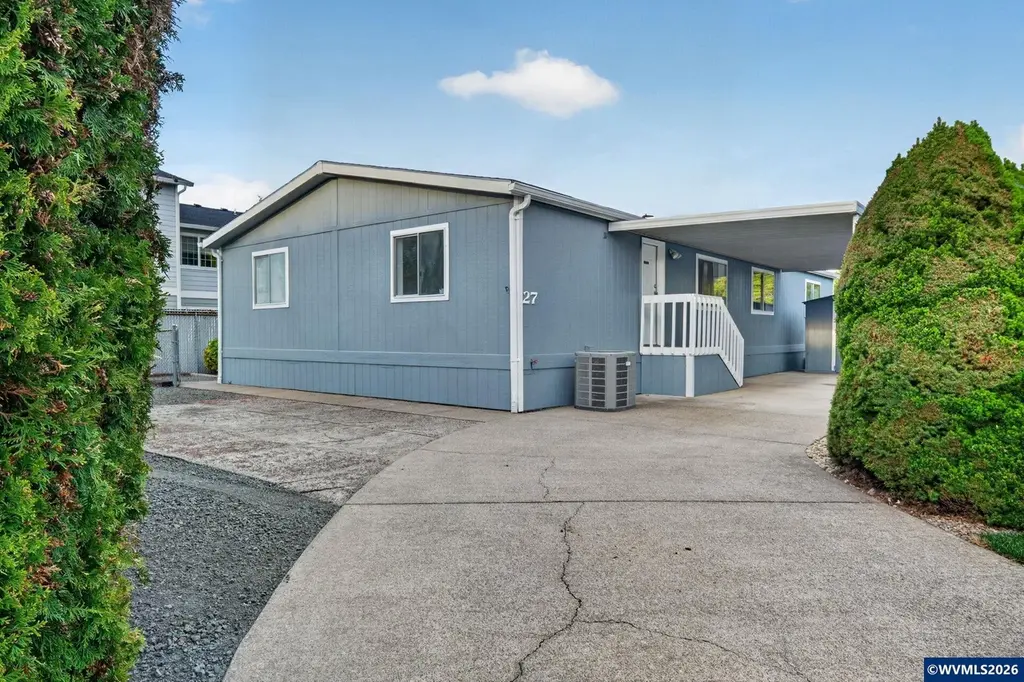
1500 NE Gabriela Ct · Salem, OR
Flood risk 1/10 · Minimal
- FEMA flood zone
- X (unshaded)
- Chance of flooding over 30 yrs
- 0.0%
- Est. flood insurance / yr
- $507 – $1,088
Fire risk 1/10 · Minimal
- Est. fire insurance / yr
- $498 – $926
Heat risk 3/10 · Minor
- Hot days now (above 92°F)
- 7 days/yr
- Hot days in 30 yrs
- 14 days/yr
Wind risk 1/10 · Minimal
- Chance of severe wind over 30 yrs
- —
Air-quality risk 9/10 · Severe
- Unhealthy air days now
- 12 days/yr
- Unhealthy air days in 30 yrs
- 13 days/yr
Risk factors via First Street. Map © Google.
Why this score? — see what drove the C+ grade
The composite is a weighted blend of 9 inputs, each scored 0–100. Each bar is that input's sub-score; the figure is the points it added to the 100-point composite (weight × sub-score).
- Cash flow +30.0/30.0
- 1% rule +10.0/10.0
- DSCR +10.0/10.0
- Livability +4.0/5.0
- Schools +3.7/10.0
- Condition / age +2.5/5.0
- Rent growth +2.3/5.0
- ARV discount +0.0/15.0
- Appreciation +0.0/10.0
$124,900
🖨 Deal sheet 📄 Offer letter ✓ Due diligence
Listing remarks MLS
Beautifully remodeled and updated 1991 Skyline home in the desirable Royal Oaks Estates 55+ community! This move-in-ready 3-bedroom, 2-bath home shines with fresh interior texture and paint, along with new skirting & exterior paint for great curb appeal.Step inside to find all-new luxury vinyl plank flooring throughout—stylish, durable, and easy to maintain. The updated kitchen features new stainless steel appliances and a fresh, modern feel, while the entire home has been professionally cleaned and thoughtfully refreshed.Privately tucked into a corner location, this property offers a peaceful setting with standout outdoor living. Enjoy the expansive covered deck with ramp access, perfect for relaxing or entertaining. The beautifully landscaped, wrap-around fenced yard includes lawn, mature trees and plantings, plus raised garden beds for those with a green thumb.Additional features include a spacious carport with extra parking and a brand-new storage shed. Located in a quiet, well-maintained park close to shopping and everyday services, this home offers comfort, convenience, and easy living.
Key facts
- Raised garden beds
- Landscaped yard
- Updated kitchen
Tags
Neighborhood map
What this means for you Summary
Snapshot
- This is a 3-bed/2.0-bath land listed at $125k.
Deal economics
- At list price, monthly cash flow is $680 ($8k/yr) — positive.
- The deal already cash-flows at list — no discount required.
- Meets the 1% rule at list price ($2k rent vs $125k).
- Recommended offer: $117k (6.0% below list) — sets the bar for market timing.
- Cap rate 12.8% vs local median 2.9% in Salem — top-decile yield for the area; either an underpriced asset or a hidden risk that comps aren't pricing in. Stress-test before assuming the spread holds.
Location & tenants
- Location reads 79/100 on livability (#59 in OR, #2,084 nationally) — a middle-class / working-renter tenant base. Strengths: amenities A+, commute A+, housing A+; Watch: schools D, crime F.
- Salem-Keizer SD 24J (urban): math 34% / reading 47% proficiency, ranked #103 of 183 in OR (top 56%) — families likely to look elsewhere, expect single-tenant / working-renter base with shorter leases.
- Market conditions: Rents soft (-0.7%/yr); 276 active listings in the ZIP; 24 comparable units currently listed for rent nearby; rentals at typical pace (median 24d on market — plan ~3-4 weeks tenant-placement turnaround); 1,591 units permitted in Marion County in 2024 (716 in 5+ unit buildings).
- This rent runs 39% of the median local income ($60k/yr) — at the standard rent-burdened threshold; future hikes will face affordability resistance.
Forward outlook
- Local home prices are declining (-3.0%/yr); year-one equity from $864 of loan paydown is wiped out by about $4k of value loss. Plan a longer hold.
- Marion County population projected at +17% by 2050 — long-run rental-demand tailwind backs the buy-and-hold thesis.
- At projected returns (-3.0% appreciation + 0.0% rent growth), your $35k cash investment doubles in ~7 years — after that, you're playing with house money.
Negotiation context
- It's been on market 65 days — a 6% lower offer ($117k) is reasonable based on typical stale-listing flexibility.
- 2 sale attempts; this cycle's ask has dropped $15k (11%) from the opening price — seller is motivated, your offer sets the floor, not the list.
Questions for the listing agent
- It's been on market 65 days. Have you received any prior offers? Is the seller open to a 6% concession, seller financing, or rate buy-down credit?
- Why hasn't it sold? Are there any deal-killer items the seller is aware of (foundation, flood, title, zoning, code violations)?
- Is there a deadline driving the sale (1031 exchange, divorce, estate, relocation)? That informs how much negotiation room exists.
- Schools are D-rated, which usually means shorter tenancies and higher turnover. Who's the typical renter profile here, and what's been the actual vacancy rate?
- Crime grade is F in this area — have there been break-ins, vandalism, or insurance claims at this property in the last 3 years? What carrier currently insures it and at what premium?
- What's the average days-on-market for RENTAL listings here right now (not sales)? A rising rental-DOM trend means longer vacancies and softer asking-rent achievability than the comps imply.
- What's the recent tenant-quality profile in this submarket — average credit score on applications, eviction rate, late-payment / NSF rate, and stable-employment percentage? A property-management company in the area should have these aggregated.
- How much new for-sale + rental construction is in the pipeline within 1–3 miles? Heavy new supply typically softens prices + rents 12–24 months out; constrained supply supports both.
Investment metrics
- 1% rule
- 1.56% ✓
- Cap rate
- 12.83%
- Cash-on-cash
- 23.35%
- DSCR
- 2.04
- GRM
- 5.3
CMA / ARV
- ARV (median comp)
- $104,840
- List price
- $124,900
- Delta
- 19.13%
- Verdict
- OVERPRICED
- Comps
- 20 within 1.0 mi
Projected returns pro-forma
-3.0% appreciation · 0.0% rent growth · sell at horizon
- IRR
- 13.0%
- Equity multiple
- 1.50×
- Total profit
- $17,397
- Equity at exit
- $18,623
- IRR
- 19.4%
- Equity multiple
- 2.40×
- Total profit
- $48,937
- Equity at exit
- $10,799
Cash invested: $34,972 (down + closing). Projections, not guarantees.
Landlord ↔ Tenant lean methodology
- Overall (STATE)
- 28 Tenant-Leaning
- State Oregon
- 28 Tenant-Leaning · D+6
- County
- — inherits STATE
- City
- — inherits STATE
ZIP-level market 97301
- Rents YoY
- -0.7%
- Active inventory
- 276
- Price-to-rent
- 5.3×
Monthly cashflow live
- Estimated rent
- $1,954 high interval (Pro) →
- Mortgage (P&I)
- −$655
- Tax est. 1.5%
- −$156 /mo · $1,874/yr
- Insurance
- −$52
- HOA
- −$0
- Vacancy / Maint / Mgmt
- −$410
- Net cashflow
- $680
Break-even live
UW: 25.0% down · 7.5% · 30yr · 1.5% tax · 5.0% vac · 8.0% maint · 8.0% mgmt
Financing live
Cash to close
- Down payment
- $31,225
- Closing costs
- $3,747
- Reserves months
- —
- Total cash needed
- —
Loan-product check · same deal, 3 products live
Conventional
25% down · 7.5% · 30yr
- Down + closing
- —
- Monthly P&I
- —
- Monthly cashflow
- —
- DSCR
- —
- Eligible?
- —
Personal DTI + credit; lowest rate.
DSCR
20% down · 8.5% · 30yr
- Down + closing
- —
- Monthly P&I
- —
- Monthly cashflow
- —
- DSCR
- —
- Eligible?
- —
No personal income docs; deal must DSCR.
Hard money
10% down · 12.0% · 12mo
- Down + closing
- —
- Monthly P&I
- —
- Monthly cashflow
- —
- DSCR
- —
- Eligible?
- —
Short-term bridge; refi at stabilization.
Rent comps 24 comps
| Address | Beds | Baths | Sqft | Rent | $/sqft | DOM | Units | Dist |
|---|---|---|---|---|---|---|---|---|
| 1973 45th Ave NE Salem, OR | 2.0 | 1.0–2.0 | 1043 | $1,360 | $1.30 | 13d | 2 | 0.67mi |
| 4768 El Cedro Loop NE Salem, OR | 3.0 | 2.0 | 1344 | $1,895 | $1.41 | 43d | 1 | 0.79mi |
| 4200 Sunnyview Rd NE Salem, OR | 2.0 | 1.0–2.0 | 880 | $1,445 | $1.64 | 23d | 1 | 0.86mi |
| 434 Greencrest St NE Salem, OR | 3.0 | 2.0 | 1637 | $3,900 | $2.38 | 23d | 1 | 0.87mi |
| 412 Lost Lake St NE Salem, OR | 4.0 | 3.0 | 1662 | $2,495 | $1.50 | 23d | 1 | 0.88mi |
| 4098 Market St NE Unit MT21 Salem, OR | 2.0 | 1.0 | 900 | $1,275 | $1.42 | 23d | 1 | 0.89mi |
| 4154 Sunnyview Rd NE Salem, OR | 1.0–2.0 | 1.0 | 806 | $1,375 | $1.71 | 13d | 6 | 0.97mi |
| 4359 Rodeo Dr NE Salem, OR | 3.0 | 2.0 | 1170 | $2,245 | $1.92 | 21d | 1 | 1.07mi |
| 4485 Monroe Ave NE Salem, OR | 4.0 | 2.0 | 1200 | $2,195 | $1.83 | 43d | 1 | 1.08mi |
| 4889 Saunter Loop NE Salem, OR | 3.0 | 1.5 | 1186 | $1,925 | $1.62 | 43d | 1 | 1.11mi |
| 4833 Thyme Ave NE Salem, OR | 3.0 | 2.5 | 1681 | $2,545 | $1.51 | 13d | 1 | 1.12mi |
| 3910-3930 Sunnyview Rd NE Salem, OR | 3.0 | 2.5 | 1300 | $1,845 | $1.42 | 13d | 6 | 1.17mi |
| 102 Greencrest St NE Salem, OR | 3.0 | 1.0–2.0 | 914 | $2,205 | $2.41 | 13d | 25 | 1.20mi |
| 3695 D St NE Salem, OR | 1.0–2.0 | 1.0–2.0 | 1037 | $1,650 | $1.59 | 43d | 3 | 1.26mi |
| 435 Fountain Valley Way NE Salem, OR | 1.0–2.0 | 1.0–2.0 | 939 | $1,559 | $1.66 | 21d | 5 | 1.27mi |
| 2500 Lancaster Dr NE Unit 35 Salem, OR | 2.0 | 1.0 | 890 | $1,295 | $1.46 | 43d | 1 | 1.32mi |
| 2500 Lancaster Dr NE Salem, OR | 1.0–2.0 | 1.0 | 771 | $1,350 | $1.75 | 13d | 11 | 1.32mi |
| 4252 Ash Grove Dr NE Salem, OR | 3.0 | 2.0 | 1357 | $2,100 | $1.55 | 13d | 1 | 1.35mi |
| 4824 Falcon Ct NE Salem, OR | 3.0 | 1.5 | 1246 | $1,995 | $1.60 | 23d | 1 | 1.36mi |
| 2489 Coral Ave NE Salem, OR | 1.0–2.0 | 1.0 | 817 | $1,301 | $1.59 | 13d | 11 | 1.38mi |
| 143 Connecticut Ave SE Unit 145 Salem, OR | 3.0 | 1.0 | 1207 | $1,595 | $1.32 | 13d | 1 | 1.39mi |
| 430 Brittany Way NE Unit 369-421 Salem, OR | 2.0 | 2.0 | 920 | $1,400 | $1.52 | 43d | 1 | 1.42mi |
| 124 Stafford Ln NE Unit 124-203 Salem, OR | 3.0 | 2.0 | 1052 | $1,595 | $1.52 | 43d | 1 | 1.43mi |
| 2970 Phipps Ln NE Salem, OR | 4.0 | 2.0 | 1350 | $2,450 | $1.81 | 23d | 1 | 1.44mi |
Listing history 21 events
-
2026-06-18days on market $124,900 Active 65 DOM
-
2026-06-17days on market $124,900 Active 64 DOM
-
2026-06-16days on market $124,900 Active 63 DOM
-
2026-06-15price $124,900 Active 62 DOM
-
2026-06-15days on market $134,900 Active 62 DOM
-
2026-06-14days on market $134,900 Active 60 DOM
-
2026-06-10days on market $134,900 Active 57 DOM
-
2026-06-09days on market $134,900 Active 56 DOM
-
2026-06-08days on market $134,900 Active 55 DOM
-
2026-06-07days on market $134,900 Active 54 DOM
-
2026-06-03days on market $134,900 Active 50 DOM
-
2026-06-02days on market $134,900 Active 49 DOM
-
2026-06-01days on market $134,900 Active 48 DOM
-
2026-05-31days on market $134,900 Active 47 DOM
-
2026-05-30days on market $134,900 Active 46 DOM
-
2026-05-17price $134,900 1119-char remark
Show marketing remark (1119 chars)
Beautifully remodeled and updated 1991 Skyline home in the desirable Royal Oaks Estates 55+ community! This move-in-ready 3-bedroom, 2-bath home shines with fresh interior texture and paint, along with new skirting & exterior paint for great curb appeal.Step inside to find all-new luxury vinyl plank flooring throughout—stylish, durable, and easy to maintain. The updated kitchen features new stainless steel appliances and a fresh, modern feel, while the entire home has been professionally cleaned and thoughtfully refreshed.Privately tucked into a corner location, this property offers a peaceful setting with standout outdoor living. Enjoy the expansive covered deck with ramp access, perfect for relaxing or entertaining. The beautifully landscaped, wrap-around fenced yard includes lawn, mature trees and plantings, plus raised garden beds for those with a green thumb.Additional features include a spacious carport with extra parking and a brand-new storage shed. Located in a quiet, well-maintained park close to shopping and everyday services, this home offers comfort, convenience, and easy living.
-
2026-04-14$139,900 Active 1119-char remark
Show marketing remark (1104 chars)
Beautifully remodeled and updated 1991 Skyline home in the desirable Royal OaksEstates 55+ community! This move-in-ready 3-bedroom, 2-bath home shines with fresh interior texture and paint, along with new exterior paint for great curb appeal. Step inside to find all-new luxury vinyl plank flooring throughout—stylish, durable, and easy to maintain. The updated kitchen features new stainless steel appliances and a fresh, modern feel, while the entire home has been professionally cleaned and thoughtfully refreshed.Privately tucked into a corner location, this property offers a peaceful setting with standout outdoor living. Enjoy the expansive covered deck with ramp access, perfect for relaxing or entertaining. The beautifully landscaped, wrap-around fenced yard includes lawn, mature trees and plantings, plus raised garden beds for those with a green thumb.Additional features include a spacious carport with extra parking and a brand-new storage shed. Located in a quiet, well-maintained park close to shopping and everyday services, this home offers comfort, convenience, and easy living.
-
2026-04-14$139,900 Active 1104-char remark
Show marketing remark (1104 chars)
Beautifully remodeled and updated 1991 Skyline home in the desirable Royal OaksEstates 55+ community! This move-in-ready 3-bedroom, 2-bath home shines with fresh interior texture and paint, along with new exterior paint for great curb appeal. Step inside to find all-new luxury vinyl plank flooring throughout—stylish, durable, and easy to maintain. The updated kitchen features new stainless steel appliances and a fresh, modern feel, while the entire home has been professionally cleaned and thoughtfully refreshed.Privately tucked into a corner location, this property offers a peaceful setting with standout outdoor living. Enjoy the expansive covered deck with ramp access, perfect for relaxing or entertaining. The beautifully landscaped, wrap-around fenced yard includes lawn, mature trees and plantings, plus raised garden beds for those with a green thumb.Additional features include a spacious carport with extra parking and a brand-new storage shed. Located in a quiet, well-maintained park close to shopping and everyday services, this home offers comfort, convenience, and easy living.
-
2008-01-07soldstatus $2,100,000
-
1995-03-30soldstatus $1,080,000
-
1990-11-14soldstatus $31,895
ⓘ Source: listings_history table (triggers on properties + properties_extension) + one-shot
backfill from property_details.listing_events for pre-trigger history.
Climate risk First Street
- Flood 1/10 Low FEMA zone X (unshaded) · 0% chance over 30 yrs
- Wildfire 1/10 Low
- Heat 3/10 Moderate 7 d/yr ≥92°F today · 14 d/yr by 30 yrs out
- Wind 1/10 Low
- Air quality 9/10 Extreme 12 unhealthy d/yr today · 13 by 30 yrs out
Nearby sold comps map
Loading sold comps map…
Walkable amenities ~0.75 mi
Loading nearby amenities…
Taxation est. · year 1
- Rental income
- $23,446
- − Mortgage interest
- −$6,996
- − Property taxes
- −$1,874
- − Insurance
- −$624
- − Repairs & maintenance
- −$1,876
- − Management
- −$1,876
- − Depreciation
- −$3,633
- Taxable income
- $6,567
- Est. tax owed @ 24.0%
- −$1,576
- After-tax cash flow
- $6,588/yr
For passive investors: Depreciation is non-cash, so a rental often shows a tax loss while cash-flowing — sheltering income. Rental losses are passive: they offset passive income freely, and up to $25,000/yr can offset ordinary (W-2) income if you actively participate and your MAGI is under $100k (phasing out to $0 by $150k); unused losses carry forward. On sale, claimed depreciation is recaptured at up to 25%, and gains may owe capital-gains tax (a 1031 exchange can defer both). Figures are a year-1 estimate at your 24.0% rate — not tax advice; consult a CPA.
Schools (NCES district)
- District
- Salem-Keizer SD 24J
- NCES district ID
- 4110820
- Math proficiency
- 34% ▼ -1.00%
- Reading proficiency
- 47% ▼ -2.00%
- Median HH income
- $48,632
- Composite
- 37.16/100
- National rank
- #9017
- State rank
- #103 of 183 in OR
Livability — Salem
- Score
- 79/100
- State rank
- #59
- US rank
- #2084
Category grades
Schools grade is shown separately in the Schools card above.
Census & demographics
- Census place
- Salem, OR
- County
- Marion County · 258,219 people
- City population
- 193,601
- Metro
- Salem, OR
- Population (ZIP)
- 57,574
- Household income
- $60,422
- Rent vs Own
- Severe rent burden
- 3089.0
Population outlook (Marion County) Hauer SSP2
- Today (2025)
- 360,940 people
- By 2030
- 375,178 · +3.9%
- By 2040
- 400,914 · +11.1%
- By 2050
- 422,187 · +17.0%
- By 2075
- 460,305 · +27.5%
- By 2100
- 464,025 · +28.6%
Race, ethnicity, and origin ACS 2023
- Neighborhood character
- Diverse neighborhood (Simpson 0.58)
- Race & ethnicity
- White 55% Hispanic / Latino 35% Two or more races 19% Asian 2% Black 2% Native American 1% Pacific Islander 1%
- Hispanic origin (detail)
- Mexican 31%
- Common ancestry
- Italian 4% Portuguese 2% Lithuanian 2%
- Foreign-born
- 17% · Canada, China, Philippines
- Languages at home
- 68% English-only · Spanish 27% Other Asian/Pacific 1% Russian/Polish/Slavic 1%
Political lean MEDSL · Marion
- 2024 margin
- Toss-up / Even · D 47.5% · R 49.5% · Other 3.0%
- 2008→2024 swing
- -4.2pp toward R · 2008: 2.2pp · 2024: -2.0pp
- All cycles
- 2024: R+2.0 2020: D+1.1 2016: R+5.0 2012: R+3.5 2008: D+2.2
Not yet ingested
- Civics
- —
Market trends
- HPI YoY
- ▼ -548.17%
- Current HPI
- 335.8199
- Rent YoY
- ▼ -0.70%
- Metro
- Salem, OR
- State GDP YoY
- ▲ 2.05%
- F500 in state
- 2
Industry mix (Fortune 500 HQ in OR)
| Industry | F500 HQs | Revenue |
|---|---|---|
| Consumer Goods | 1 | $51B |
|
||
Price history
+323.0% since first listed6 events — show timeline
- 2026-05-17 Price Changed $134,900 RMLS
- 2026-04-14 Listed $139,900 WVMLS
- 2026-04-14 Listed $139,900 RMLS
- 2008-01-07 Sold (Public Records) $2,100,000 Public Records
- 1995-03-30 Sold (Public Records) $1,080,000 Public Records
- 1990-11-14 Sold (Public Records) $31,895 Public Records
Property tax history
+4.4%/yrLatest (2025): $28,881 · +7.8% YoY. Source: county tax records.
Cash-flow waterfall
monthlySold comps — $/sqft
last 12 mo · ≤1 miLoading sold comps…