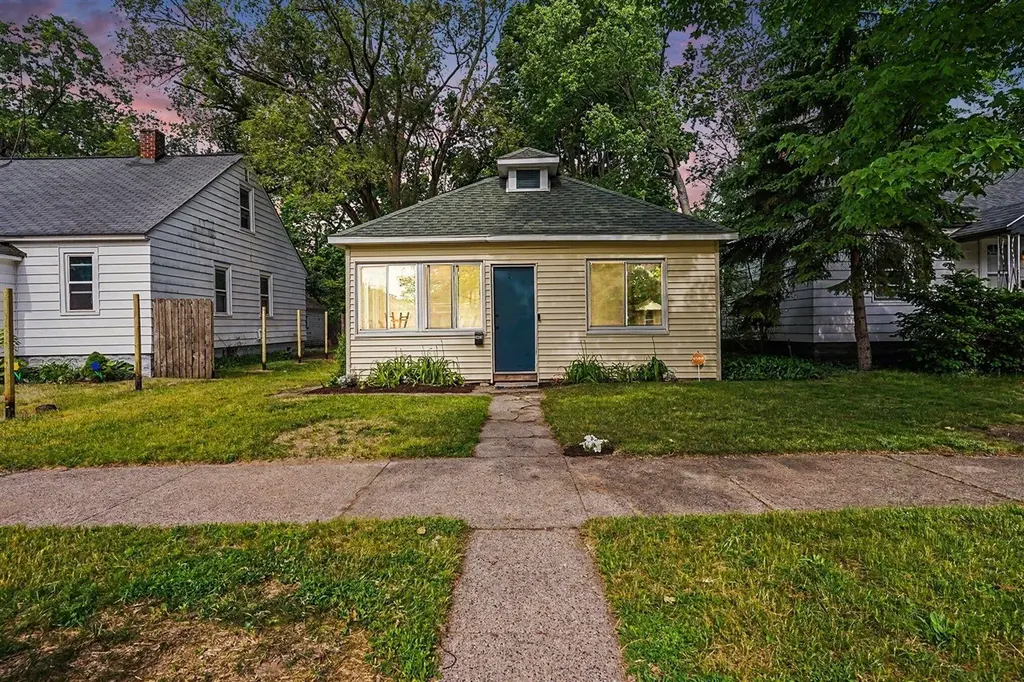
3013 Leahy St · Muskegon Heights, MI
Flood risk 1/10 · Minimal
- FEMA flood zone
- X (unshaded)
- Chance of flooding over 30 yrs
- 0.0%
- Est. flood insurance / yr
- $473 – $860
Fire risk 1/10 · Minimal
- Est. fire insurance / yr
- $784 – $1,456
Heat risk 2/10 · Minimal
- Hot days now (above 93°F)
- 7 days/yr
- Hot days in 30 yrs
- 15 days/yr
Wind risk 1/10 · Minimal
- Chance of severe wind over 30 yrs
- —
Air-quality risk 4/10 · Minor
- Unhealthy air days now
- 4 days/yr
- Unhealthy air days in 30 yrs
- 6 days/yr
Risk factors via First Street. Map © Google.
Why this score? — see what drove the B- grade
The composite is a weighted blend of 9 inputs, each scored 0–100. Each bar is that input's sub-score; the figure is the points it added to the 100-point composite (weight × sub-score).
- Cash flow +27.2/30.0
- DSCR +9.5/10.0
- ARV discount +9.3/15.0
- 1% rule +6.6/10.0
- Schools +5.0/10.0
- Livability +3.1/5.0
- Rent growth +2.5/5.0
- Condition / age +2.5/5.0
- Appreciation +0.0/10.0
$89,900
🖨 Deal sheet 📄 Offer letter ✓ Due diligence
Listing remarks MLS
Move in ready 2 bedroom 1 bath home in City of Muskegon Heights. This home offers an open concept living and dining area, enclosed porch, and partial basement. Kitchen offers access to the back yard with a firepit and patio. This home has vinyl siding, replacement windows, and a newer roof. Situated on a one-block-long road of well maintained homes. Great opportunity for a homeowner or turn-key rental opportunity. Buyer to verify all information.
Key facts
- Open concept living
- Firepit
- Partial basement
Tags
Property features AI
Exterior
- Utilities: Natural gas water heater; Public water service
- Home design: Single family residence; Residential property; Built in 1920
- Construction: Vinyl siding; Composition roof
- Exterior features: Public water; 0.12-acre lot
Interior
- Kitchen: Range; Refrigerator
- Bedrooms: Primary bedroom; Second bedroom
- Bathrooms: 1 full bathroom
- Heating & cooling: Forced air heating
- Interior features: Replacement windows; 7 total rooms; Crawl space/partial basement
- Laundry & utility: In-home laundry
Neighborhood map
What this means for you Summary
Snapshot
- This is a 2-bed/1.0-bath single-family listed at $90k.
Deal economics
- At list price, monthly cash flow is $258 ($3k/yr) — positive.
- The deal already cash-flows at list — no discount required.
- Meets the 1% rule at list price ($1k rent vs $90k).
Location & tenants
- Location reads 61/100 on livability (#574 in MI) — a middle-class / working-renter tenant base. Strengths: cost of living A+, housing A; Watch: schools D+, crime F, amenities F.
- Market conditions: 237 active listings in the ZIP; 10 comparable units currently listed for rent nearby; rentals at typical pace (median 21d on market — plan ~3-4 weeks tenant-placement turnaround); 438 units permitted in Muskegon County in 2024 (115 in 5+ unit buildings).
Forward outlook
- Local home prices are declining (-3.0%/yr); year-one equity from $622 of loan paydown is wiped out by about $3k of value loss. Plan a longer hold.
- Muskegon County population projected to shrink 8% by 2050 — rents likely to lag national; underwrite the cash flow, not the appreciation.
- At projected returns (-3.0% appreciation + 3.0% rent growth), your $25k cash investment doubles in ~10 years — after that, you're playing with house money.
Negotiation context
- Only 8 days on market — expect competitive offers; lowballing is unlikely to land.
- 10 sale attempts since 16y ago with the ask held roughly flat each time — persistent listings suggest the price (not the market) is what's stuck; bring a comps-based counter.
- Current owner paid $45k; list at $90k implies a 100% gain — meaningful room to come down on a strong offer.
Risks & watch-outs
- Watch-outs: built in 1920 — expect roof / HVAC / electrical / plumbing capex.
Questions for the listing agent
- Built in 1920 — when were the roof, HVAC, electrical panel, plumbing, and water heater last replaced?
- Is there a deadline driving the sale (1031 exchange, divorce, estate, relocation)? That informs how much negotiation room exists.
- Schools are D-rated, which usually means shorter tenancies and higher turnover. Who's the typical renter profile here, and what's been the actual vacancy rate?
- Crime grade is F in this area — have there been break-ins, vandalism, or insurance claims at this property in the last 3 years? What carrier currently insures it and at what premium?
- What's the average days-on-market for RENTAL listings here right now (not sales)? A rising rental-DOM trend means longer vacancies and softer asking-rent achievability than the comps imply.
- What's the recent tenant-quality profile in this submarket — average credit score on applications, eviction rate, late-payment / NSF rate, and stable-employment percentage? A property-management company in the area should have these aggregated.
- How much new for-sale + rental construction is in the pipeline within 1–3 miles? Heavy new supply typically softens prices + rents 12–24 months out; constrained supply supports both.
Investment metrics
- 1% rule
- 1.16% ✓
- Cap rate
- 9.73%
- Cash-on-cash
- 12.29%
- DSCR
- 1.55
- GRM
- 7.2
CMA / ARV
- ARV (on-the-fly)
- $93,702
- Comps found
- 12
Show comp detail 12 sales within ~0.75 mi
| Address | Dist | Beds/Ba | Sqft | Sold | Price | $/sf | Match |
|---|---|---|---|---|---|---|---|
| 3044 Morton Ave | 0.17mi | 2/1.0 | 984 (+2%) | 3mo | $95,000 | $97 | 86 |
| 2933 Baker St | 0.08mi | 2/1.0 | 900 (-7%) | 1mo | $111,000 | $123 | 84 |
| 3017 Merriam St | 0.10mi | 2/1.0 | 864 (-11%) | 5mo | $49,900 | $58 | 74 |
| 2833 Hoyt St | 0.17mi | 2/1.0 | 848 (-12%) | 4mo | $90,000 | $106 | 69 |
| 2917 Jefferson St | 0.33mi | 3/1.0 (+1) | 898 (-7%) | 6mo | $73,000 | $81 | 62 |
| 3301 7th St | 0.56mi | 2/1.0 | 880 (-9%) | 2mo | $82,000 | $93 | 57 |
| 2618 Hoyt St | 0.49mi | 3/1.0 (+1) | 878 (-9%) | 1mo | $74,900 | $85 | 56 |
| 2513 5th St | 0.72mi | 3/1.0 (+1) | 980 (+1%) | 4mo | $50,000 | $51 | 56 |
| 375 W Maplewood Ave | 0.75mi | 3/1.0 (+1) | 984 (+2%) | 2mo | $105,894 | $108 | 55 |
| 3229 7th St | 0.55mi | 2/1.0 | 846 (-12%) | 2mo | $78,000 | $92 | 52 |
| 356 Amsterdam Ave | 0.65mi | 2/1.0 | 876 (-9%) | 3mo | $99,900 | $114 | 52 |
| 3354 Highland St | 0.65mi | 3/1.0 (+1) | 1,068 (+11%) | 6mo | $129,900 | $122 | 42 |
Match score weights: distance 35% · size 25% · config 20% · recency 20%. Top-matched comps best support the ARV.
Projected returns pro-forma
-3.0% appreciation · 3.0% rent growth · sell at horizon
- IRR
- 1.9%
- Equity multiple
- 1.07×
- Total profit
- $1,830
- Equity at exit
- $13,404
- IRR
- 11.5%
- Equity multiple
- 1.90×
- Total profit
- $22,654
- Equity at exit
- $7,773
Cash invested: $25,172 (down + closing). Projections, not guarantees.
Landlord ↔ Tenant lean methodology
- Overall (STATE)
- 62 Landlord-Friendly
- State Michigan
- 62 Landlord-Friendly · EVEN
- County
- — inherits STATE
- City
- — inherits STATE
ZIP-level market 49444
- Active inventory
- 237
- Price-to-rent
- 7.2×
Monthly cashflow live
- Estimated rent
- $1,040 high interval (Pro) →
- Mortgage (P&I)
- −$471
- Tax from tax record
- −$55 /mo · $660/yr
- Insurance
- −$37
- HOA
- −$0
- Vacancy / Maint / Mgmt
- −$218
- Net cashflow
- $258
Break-even live
UW: 25.0% down · 7.5% · 30yr · 1.5% tax · 5.0% vac · 8.0% maint · 8.0% mgmt
Financing live
Cash to close
- Down payment
- $22,475
- Closing costs
- $2,697
- Reserves months
- —
- Total cash needed
- —
Loan-product check · same deal, 3 products live
Conventional
25% down · 7.5% · 30yr
- Down + closing
- —
- Monthly P&I
- —
- Monthly cashflow
- —
- DSCR
- —
- Eligible?
- —
Personal DTI + credit; lowest rate.
DSCR
20% down · 8.5% · 30yr
- Down + closing
- —
- Monthly P&I
- —
- Monthly cashflow
- —
- DSCR
- —
- Eligible?
- —
No personal income docs; deal must DSCR.
Hard money
10% down · 12.0% · 12mo
- Down + closing
- —
- Monthly P&I
- —
- Monthly cashflow
- —
- DSCR
- —
- Eligible?
- —
Short-term bridge; refi at stabilization.
Rent comps 10 comps
| Address | Beds | Baths | Sqft | Rent | $/sqft | DOM | Units | Dist |
|---|---|---|---|---|---|---|---|---|
| 232 E Lincoln Ave Muskegon, MI | 2.0 | 1.0 | 1020 | $1,100 | $1.08 | 21d | 1 | 0.17mi |
| 2516 5th St Apt 1 Muskegon Heights, MI | 1.0 | 1.0 | 630 | $775 | $1.23 | 21d | 1 | 0.67mi |
| 2516 5th St Apt 2 Muskegon Heights, MI | 1.0 | 1.0 | 630 | $750 | $1.19 | 21d | 1 | 0.67mi |
| 3040 Temple St Muskegon, MI | 2.0 | 1.0 | 900 | $1,150 | $1.28 | 21d | 1 | 0.81mi |
| 2901 Temple St Unit 1 Muskegon Heights, MI | 2.0 | 1.0 | 850 | $1,095 | $1.29 | 43d | 1 | 0.84mi |
| 3041 Lemuel St Muskegon, MI | 3.0 | 1.0 | 872 | $1,195 | $1.37 | 21d | 1 | 0.90mi |
| 889 Woodside Rd Unit 36 Muskegon, MI | 2.0 | 1.0 | 880 | $1,125 | $1.28 | 43d | 1 | 1.26mi |
| 3223 Bailey St Norton Shores, MI | 2.0–3.0 | 2.0 | 1096 | $1,249 | $1.14 | 21d | 1 | 1.30mi |
| 121 E Holbrook Ave Apt 3 Muskegon, MI | 2.0 | 1.0 | 650 | $950 | $1.46 | 21d | 1 | 1.36mi |
| 1893 Jefferson St Unit 2 Muskegon, MI | 1.0 | 1.0 | 594 | $700 | $1.18 | 21d | 1 | 1.42mi |
Listing history 7 events
-
2026-06-14statusdays on market $89,900 Pending 8 DOM
-
2026-06-13days on market $89,900 Active 7 DOM
-
2026-06-10days on market $89,900 Active 5 DOM
-
2026-06-09days on market $89,900 Active 4 DOM
-
2026-06-08days on market $89,900 Active 3 DOM
-
2026-06-07remarks 450-char remark
-
2026-06-07$89,900 Active 2 DOM
ⓘ Source: listings_history table (triggers on properties + properties_extension) + one-shot
backfill from property_details.listing_events for pre-trigger history.
Tax reassessment forecast MI · Partial reset (capped growth)
- Current annual tax
- $660 · $55/mo
- Projected year-2 tax
- $1,022 · $85/mo
- Expected delta
- +$362/yr (+$30/mo · 54.8%)
ⓘ Screening estimate from a state-policy table — verify with the county assessor before closing.
Climate risk First Street
- Flood 1/10 Low FEMA zone X (unshaded) · 0% chance over 30 yrs
- Wildfire 1/10 Low
- Heat 2/10 Low 7 d/yr ≥93°F today · 15 d/yr by 30 yrs out
- Wind 1/10 Low
- Air quality 4/10 Moderate 4 unhealthy d/yr today · 6 by 30 yrs out
Nearby sold comps map
Loading sold comps map…
Walkable amenities ~0.75 mi
Loading nearby amenities…
Taxation est. · year 1
- Rental income
- $12,482
- − Mortgage interest
- −$5,036
- − Property taxes
- −$660
- − Insurance
- −$450
- − Repairs & maintenance
- −$999
- − Management
- −$999
- − Depreciation
- −$2,615
- Taxable income
- $1,724
- Est. tax owed @ 24.0%
- −$414
- After-tax cash flow
- $2,680/yr
For passive investors: Depreciation is non-cash, so a rental often shows a tax loss while cash-flowing — sheltering income. Rental losses are passive: they offset passive income freely, and up to $25,000/yr can offset ordinary (W-2) income if you actively participate and your MAGI is under $100k (phasing out to $0 by $150k); unused losses carry forward. On sale, claimed depreciation is recaptured at up to 25%, and gains may owe capital-gains tax (a 1031 exchange can defer both). Figures are a year-1 estimate at your 24.0% rate — not tax advice; consult a CPA.
Schools (NCES district)
No district data.
Livability — Muskegon Heights
- Score
- 61/100
- State rank
- #574
- US rank
- #18269
Category grades
Schools grade is shown separately in the Schools card above.
Census & demographics
- Census place
- Muskegon Heights, MI
- County
- Muskegon County · 107,917 people
- Metro
- Muskegon, MI
- Population (ZIP)
- 26,372
- Household income
- $53,054
- Rent vs Own
- Severe rent burden
- 930.0
Population outlook (Muskegon County) Hauer SSP2
- Today (2025)
- 174,032 people
- By 2030
- 173,365 · -0.4%
- By 2040
- 168,877 · -3.0%
- By 2050
- 160,306 · -7.9%
- By 2075
- 134,426 · -22.8%
- By 2100
- 98,836 · -43.2%
Race, ethnicity, and origin ACS 2023
- Neighborhood character
- Diverse neighborhood (Simpson 0.55)
- Race & ethnicity
- White 59% Black 31% Two or more races 6% Hispanic / Latino 4% Native American 1%
- Common ancestry
- Iranian 6% Romanian 4% Lithuanian 2%
- Foreign-born
- 1% · Canada
- Languages at home
- 97% English-only · Spanish 2%
Political lean MEDSL · Muskegon
- 2024 margin
- Toss-up / Even · D 48.4% · R 50.2% · Other 1.5%
- 2008→2024 swing
- -31.1pp toward R · 2008: 29.3pp · 2024: -1.8pp
- All cycles
- 2024: R+1.8 2020: D+0.6 2016: D+0.9 2012: D+17.8 2008: D+29.3
Not yet ingested
- Civics
- —
Market trends
- HPI YoY
- ▼ -150.02%
- Current HPI
- 209.2698
- Rent YoY
- —
- Metro
- Muskegon, MI
- State GDP YoY
- ▲ 1.37%
- F500 in state
- 28
Industry mix (Fortune 500 HQ in MI)
| Industry | F500 HQs | Revenue |
|---|---|---|
| Automotive Parts | 3 | $48B |
|
||
| Automotive | 2 | $372B |
|
||
| Chemicals | 1 | $45B |
|
||
| Automotive Retail | 1 | $29B |
|
||
| Healthcare / Medical Devices | 1 | $23B |
|
||
| Automotive Technology | 1 | $20B |
|
||
Price history
+799.0% since first listed17 events — show timeline
- 2026-06-02 Listed $89,900 SW Michigan MLS
- 2026-06-02 Listed $89,900 REALCOMP
- 2026-06-02 Listed $89,900 MiRealSource-MiMLS
- 2022-05-17 Sold (Public Records) $45,000 Public Records
- 2022-05-02 Listed $45,000 MiRealSource-MiMLS
- 2022-05-02 Listed $45,000 SW Michigan MLS
- 2022-05-02 Listed $45,000 REALCOMP
- 2022-05-02 Sold (MLS) $45,000 SW Michigan MLS
- 2022-05-02 Sold (MLS) $45,000 REALCOMP
- 2014-09-18 Listing Removed — SW Michigan MLS
- 2011-09-06 Listing Removed — SW Michigan MLS
- 2011-09-06 Listing Removed — REALCOMP
- 2011-06-24 Listed $9,900 SW Michigan MLS
- 2011-06-24 Listed $9,900 REALCOMP
- 2011-03-13 Listing Removed — REALCOMP
- 2010-09-13 Listed $10,000 REALCOMP
- 2010-09-13 Listed $10,000 SW Michigan MLS
Property tax history
+0.6%/yrLatest (2025): $660 · +2.8% YoY. Source: county tax records.
Cash-flow waterfall
monthlySold comps — $/sqft
last 12 mo · ≤1 miLoading sold comps…