 🏗️ New Construction
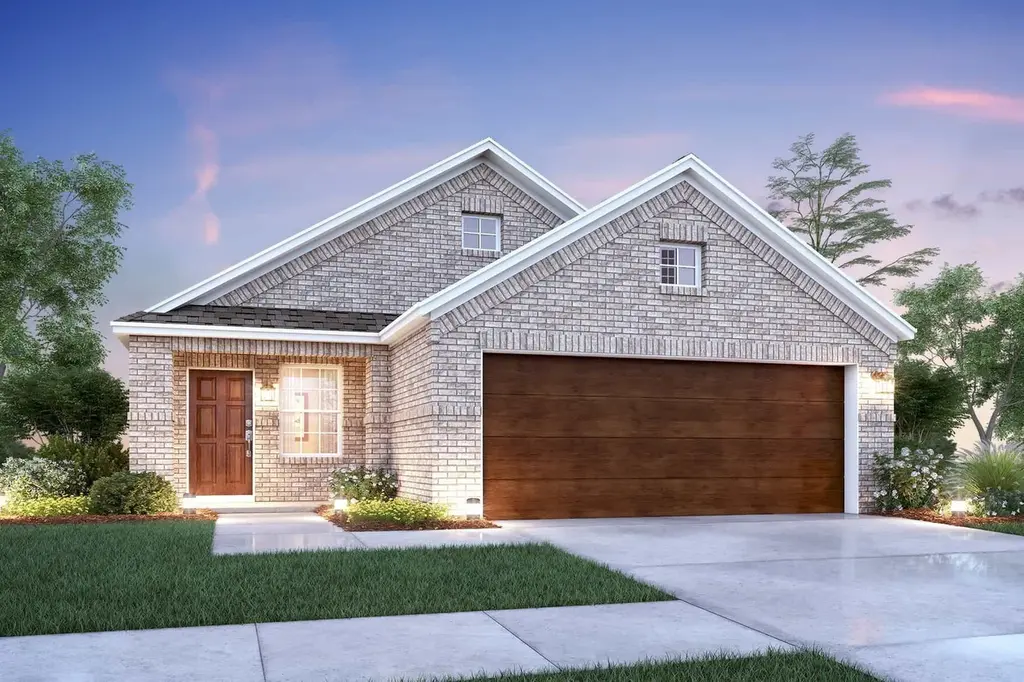
Magnolia Plan · Sanger, TX
Flood risk No data
- FEMA flood zone
- —
- Chance of flooding over 30 yrs
- —
- Est. flood insurance / yr
- —
Fire risk No data
- Est. fire insurance / yr
- —
Heat risk No data
- Hot days now (above threshold)
- —
- Hot days in 30 yrs
- —
Wind risk No data
- Chance of severe wind over 30 yrs
- —
Air-quality risk No data
- Unhealthy air days now
- —
- Unhealthy air days in 30 yrs
- —
Risk factors via First Street. Map © Google.
Why this score? — see what drove the F grade
The composite is a weighted blend of 9 inputs, each scored 0–100. Each bar is that input's sub-score; the figure is the points it added to the 100-point composite (weight × sub-score).
- ARV discount +7.5/15.0
- Cash flow +5.7/30.0
- Schools +3.8/10.0
- Livability +3.1/5.0
- Rent growth +2.6/5.0
- Condition / age +2.5/5.0
- 1% rule +1.2/10.0
- DSCR +0.1/10.0
- Appreciation +0.0/10.0
$264,990
🖨 Deal sheet (PDF) 📄 Offer letter ✓ Due diligence
Listing remarks MLS
The Magnolia is a single-story home that boasts 1,571-1,619 square feet of functional living space, and features 3 bedrooms, 2 bathrooms, and a 2-car garage. This open-concept Smart Series design is built with your lifestyle in mind!
Key facts
- 2 garage spots
- Listed 303 days
Neighborhood map
What this means for you Summary
Snapshot
- This is a 3-bed/2.0-bath single-family listed at $265k.
Deal economics
- At list price, monthly cash flow is $-682 ($-8k/yr) — negative.
- To cash-flow at today's rent, offer at most $234k (11.8% below list).
- To meet the 1% rule (rent ≥ 1% of price), the offer needs to be $205k (22.8% below list).
- Recommended offer: $205k (22.8% below list) — sets the bar for 1% rule.
Location & tenants
- Location reads 62/100 on livability (#958 in TX) — a middle-class / working-renter tenant base. Strengths: crime A+, cost of living A+, housing A+; Watch: schools C-, amenities F, commute F.
- Sanger ISD (rural): math 38% / reading 47% proficiency, ranked #281 of 826 in TX (top 34%) — families likely to look elsewhere, expect single-tenant / working-renter base with shorter leases.
- Market conditions: Rents flat; 327 active listings in the ZIP; 18 comparable units currently listed for rent nearby; rentals at typical pace (median 14d on market — plan ~3-4 weeks tenant-placement turnaround); solid renter incomes; 10,531 units permitted in Denton County in 2024 (2,713 in 5+ unit buildings).
Forward outlook
- Local home prices are declining (-3.0%/yr); year-one equity from $2k of loan paydown is wiped out by about $10k of value loss. Plan a longer hold.
- Denton County population projected at +66% by 2050 — long-run rental-demand tailwind backs the buy-and-hold thesis.
Negotiation context
- It's been on market 303 days — a 12% lower offer ($233k) is reasonable based on typical stale-listing flexibility.
- 2 sale attempts with the ask held roughly flat each time — persistent listings suggest the price (not the market) is what's stuck; bring a comps-based counter.
Questions for the listing agent
- What do current leases actually rent for vs. the listed asking? Can we see a recent rent roll and the last 12 months of T-12 income?
- It's been on market 303 days. Have you received any prior offers? Is the seller open to a 23% concession, seller financing, or rate buy-down credit?
- Why hasn't it sold? Are there any deal-killer items the seller is aware of (foundation, flood, title, zoning, code violations)?
- Is there a deadline driving the sale (1031 exchange, divorce, estate, relocation)? That informs how much negotiation room exists.
- The area grade is low — what's the realistic commute time and amenity access for the typical tenant pool here? Any planned neighborhood developments (good or bad) we should know about?
- What's the average days-on-market for RENTAL listings here right now (not sales)? A rising rental-DOM trend means longer vacancies and softer asking-rent achievability than the comps imply.
- What's the recent tenant-quality profile in this submarket — average credit score on applications, eviction rate, late-payment / NSF rate, and stable-employment percentage? A property-management company in the area should have these aggregated.
- How much new for-sale + rental construction is in the pipeline within 1–3 miles? Heavy new supply typically softens prices + rents 12–24 months out; constrained supply supports both.
Investment metrics
- 1% rule
- 0.62% ✗
- Cap rate
- 3.83%
- Cash-on-cash
- -8.79%
- DSCR
- 0.61
- GRM
- 13.5
CMA / ARV
- ARV (median comp)
- $332,549
- List price
- $264,990
- Delta
- -20.32%
- Verdict
- UNDERPRICED
- Comps
- 20 within 1.0 mi
Show comp detail 12 sales within ~0.75 mi
| Address | Dist | Beds/Ba | Sqft | Sold | Price | $/sf | Match |
|---|---|---|---|---|---|---|---|
| 13 Bluebird Ln | 0.14mi | 3/2.0 | 1,592 (+1%) | 12mo | $329,900 | $207 | 82 |
| 60 N Highland Dr | 0.14mi | 3/2.0 | 1,608 (+2%) | 12mo | $295,000 | $183 | 80 |
| 136 Creekside Dr | 0.42mi | 3/2.0 | 1,552 (-1%) | 2mo | $309,000 | $199 | 77 |
| 2 Grouse Run | 0.34mi | 3/2.0 | 1,507 (-4%) | 2mo | $305,000 | $202 | 76 |
| 5 S Highland Dr | 0.07mi | 3/2.0 | 1,699 (+8%) | 9mo | $309,000 | $182 | 76 |
| 9 Pheasant Run | 0.38mi | 3/2.0 | 1,598 (+2%) | 13mo | $319,000 | $200 | 69 |
| 724 Dove Rdg | 0.42mi | 3/2.0 | 1,441 (-8%) | 13mo | $299,900 | $208 | 56 |
| 223 Jones St | 0.68mi | 3/2.0 | 1,485 (-6%) | 4mo | $304,995 | $205 | 56 |
| 713 Dove Rdg | 0.47mi | 3/2.0 | 1,749 (+11%) | 8mo | $299,900 | $171 | 53 |
| 4909-4911 Villas Dr | 0.65mi | 3/2.5 | 1,482 (-6%) | 12mo | $450,000 | $304 | 49 |
| 720 Dove Rdg | 0.42mi | 4/2.0 (+1) | 1,806 (+15%) | 14mo | $369,900 | $205 | 39 |
| 111 Arrowhead Dr | 0.67mi | 3/2.0 | 1,367 (-13%) | 12mo | $292,000 | $214 | 38 |
Match score weights: distance 35% · size 25% · config 20% · recency 20%. Top-matched comps best support the ARV.
Projected returns pro-forma
-3.0% appreciation · 0.57% rent growth · sell at horizon
- IRR
- -34.6%
- Equity multiple
- -0.10×
- Total profit
- $-102,198
- Equity at exit
- $49,584
- IRR
- -62.5%
- Equity multiple
- -0.76×
- Total profit
- $-163,910
- Equity at exit
- $28,753
Cash invested: $93,114 (down + closing). Projections, not guarantees.
Landlord ↔ Tenant lean methodology
- Overall (STATE)
- 87 Strongly Landlord-Friendly
- State Texas
- 87 Strongly Landlord-Friendly · R+5
- County
- — inherits STATE
- City
- — inherits STATE
ZIP-level market 76266
- Home prices YoY
- -18.2%
- Rents YoY
- 0.6%
- Active inventory
- 327
- Price-to-rent
- 10.8×
Monthly cashflow live
- Estimated rent
- $2,045 high interval (Pro) →
- Mortgage (P&I)
- −$1,744
- Tax est. 1.5%
- −$416 /mo · $4,988/yr
- Insurance
- −$139
- HOA
- −$0
- Vacancy / Maint / Mgmt
- −$430
- Net cashflow
- $-682
Break-even live
Sensitivity live
| Price | -10% $-453 | -5% $-567 | +0% $-682 | +5% $-797 | +10% $-912 |
|---|---|---|---|---|---|
| Rent | -10% $-844 | -5% $-763 | +0% $-682 | +5% $-602 | +10% $-521 |
| Rate | -1.0pp $-515 | -0.5pp $-598 | base $-682 | +0.5pp $-769 | +1.0pp $-856 |
UW: 25.0% down · 7.5% · 30yr · 1.5% tax · 5.0% vac · 8.0% maint · 8.0% mgmt
Financing live
Cash to close
- Down payment
- $83,137
- Closing costs
- $9,976
- Reserves months
- —
- Total cash needed
- —
Loan-product check · same deal, 3 products live
Conventional
25% down · 7.5% · 30yr
- Down + closing
- —
- Monthly P&I
- —
- Monthly cashflow
- —
- DSCR
- —
- Eligible?
- —
Personal DTI + credit; lowest rate.
DSCR
20% down · 8.5% · 30yr
- Down + closing
- —
- Monthly P&I
- —
- Monthly cashflow
- —
- DSCR
- —
- Eligible?
- —
No personal income docs; deal must DSCR.
Hard money
10% down · 12.0% · 12mo
- Down + closing
- —
- Monthly P&I
- —
- Monthly cashflow
- —
- DSCR
- —
- Eligible?
- —
Short-term bridge; refi at stabilization.
Rent comps 18 comps
| Address | Beds | Baths | Sqft | Rent | $/sqft | DOM | Units | Dist |
|---|---|---|---|---|---|---|---|---|
| 3024 Lake Side Dr Sanger, TX | 4.0 | 2.0 | 1862 | $2,245 | $1.21 | 8d | 1 | 0.31mi |
| 5002 Villas Dr Sanger, TX | 3.0 | 2.5 | 1484 | $1,800 | $1.21 | 45d | 1 | 0.63mi |
| 5000 Villas Dr Sanger, TX | 3.0 | 2.5 | 1484 | $1,800 | $1.21 | 45d | 1 | 0.63mi |
| 5018 Villas Dr Sanger, TX | 3.0 | 3.0 | 1485 | $1,945 | $1.31 | 22d | 1 | 0.63mi |
| 4929 Sanger Circle Dr Sanger, TX | 3.0 | 2.5 | 1481 | $1,795 | $1.21 | 14d | 1 | 0.66mi |
| 203 W Willow St Sanger, TX | 3.0 | 1.0 | 1135 | $1,650 | $1.45 | 14d | 1 | 0.88mi |
| 909 N 6th St Sanger, TX | 3.0 | 2.0 | 1200 | $1,800 | $1.50 | 14d | 1 | 1.01mi |
| 4001 Avion Dr Sanger, TX | 3.0 | 2.5 | 1866 | $1,995 | $1.07 | 12d | 1 | 1.08mi |
| 4601 Avion Dr Sanger, TX | 3.0 | 2.5 | 1589 | $1,995 | $1.26 | 12d | 1 | 1.10mi |
| 4807 Avion Dr Sanger, TX | 3.0 | 2.0 | 1834 | $2,450 | $1.34 | 14d | 1 | 1.17mi |
| 108 Magnolia Dr Sanger, TX | 3.0 | 2.0 | 1653 | $2,010 | $1.22 | 26d | 1 | 1.18mi |
| 101 Hillcrest St Sanger, TX | 4.0 | 2.0 | 1093 | $2,195 | $2.01 | 0d | 1 | 1.23mi |
| 1102 First St Sanger, TX | 3.0 | 2.0 | 1386 | $1,999 | $1.44 | 4d | 1 | 1.27mi |
| 204 Hillcrest St Sanger, TX | 3.0 | 2.0 | 1302 | $1,875 | $1.44 | 45d | 1 | 1.29mi |
| 226 Hillcrest St Sanger, TX | 3.0 | 2.0 | 1903 | $1,900 | $1.00 | 26d | 1 | 1.44mi |
| 2014 Jackson LN Sanger, TX | 1.0–3.0 | 1.0–2.0 | 1136 | $2,428 | $2.14 | 0d | 40 | 1.48mi |
| 101 Berry St Sanger, TX | 3.0 | 2.0 | 2056 | $2,400 | $1.17 | 14d | 1 | 1.49mi |
| 140 Ringneck Dr Sanger, TX | 3.0 | 2.0 | 1466 | $1,785 | $1.22 | 22d | 1 | 1.49mi |
Listing history 23 events
-
2026-06-21days on market $264,990 Active 303 DOM
-
2026-06-18days on market $264,990 Active 300 DOM
-
2026-06-17days on market $264,990 Active 299 DOM
-
2026-06-16days on market $264,990 Active 298 DOM
-
2026-06-15days on market $264,990 Active 297 DOM
-
2026-06-13days on market $264,990 Active 295 DOM
-
2026-06-13days on market $264,990 Active 294 DOM
-
2026-06-09days on market $264,990 Active 291 DOM
-
2026-06-08days on market $264,990 Active 290 DOM
-
2026-06-07days on market $264,990 Active 289 DOM
-
2026-06-04days on market $264,990 Active 286 DOM
-
2026-06-03days on market $264,990 Active 285 DOM
-
2026-06-02days on market $264,990 Active 284 DOM
-
2026-06-01days on market $264,990 Active 283 DOM
-
2026-05-31days on market $264,990 Active 282 DOM
-
2026-03-11price $264,990 233-char remark
Show marketing remark (233 chars)
The Magnolia is a single-story home that boasts 1,571-1,619 square feet of functional living space, and features 3 bedrooms, 2 bathrooms, and a 2-car garage. This open-concept Smart Series design is built with your lifestyle in mind!
-
2026-01-08price $263,990 233-char remark
Show marketing remark (233 chars)
The Magnolia is a single-story home that boasts 1,571-1,619 square feet of functional living space, and features 3 bedrooms, 2 bathrooms, and a 2-car garage. This open-concept Smart Series design is built with your lifestyle in mind!
-
2025-12-04status Active 233-char remark
Show marketing remark (233 chars)
The Magnolia is a single-story home that boasts 1,571-1,619 square feet of functional living space, and features 3 bedrooms, 2 bathrooms, and a 2-car garage. This open-concept Smart Series design is built with your lifestyle in mind!
-
2025-11-22historical 233-char remark
Show marketing remark (233 chars)
The Magnolia is a single-story home that boasts 1,571-1,619 square feet of functional living space, and features 3 bedrooms, 2 bathrooms, and a 2-car garage. This open-concept Smart Series design is built with your lifestyle in mind!
-
2025-10-30price $262,990 233-char remark
Show marketing remark (233 chars)
The Magnolia is a single-story home that boasts 1,571-1,619 square feet of functional living space, and features 3 bedrooms, 2 bathrooms, and a 2-car garage. This open-concept Smart Series design is built with your lifestyle in mind!
-
2025-10-30price $259,990 233-char remark
Show marketing remark (233 chars)
The Magnolia is a single-story home that boasts 1,571-1,619 square feet of functional living space, and features 3 bedrooms, 2 bathrooms, and a 2-car garage. This open-concept Smart Series design is built with your lifestyle in mind!
-
2025-10-30price $262,990 233-char remark
Show marketing remark (233 chars)
The Magnolia is a single-story home that boasts 1,571-1,619 square feet of functional living space, and features 3 bedrooms, 2 bathrooms, and a 2-car garage. This open-concept Smart Series design is built with your lifestyle in mind!
-
2025-08-09$259,990 Active 233-char remark
Show marketing remark (233 chars)
The Magnolia is a single-story home that boasts 1,571-1,619 square feet of functional living space, and features 3 bedrooms, 2 bathrooms, and a 2-car garage. This open-concept Smart Series design is built with your lifestyle in mind!
ⓘ Source: listings_history table (triggers on properties + properties_extension) + one-shot
backfill from property_details.listing_events for pre-trigger history.
Nearby sold comps map
Loading sold comps map…
Walkable amenities ~0.75 mi
Loading nearby amenities…
Taxation est. · year 1
- Rental income
- $24,544
- − Mortgage interest
- −$18,628
- − Property taxes
- −$4,988
- − Insurance
- −$1,663
- − Repairs & maintenance
- −$1,964
- − Management
- −$1,964
- − Depreciation
- −$9,674
- Taxable loss
- −$14,336
- Est. tax savings @ 24.0%
- +$3,441
- After-tax cash flow
- $-4,748/yr
For passive investors: Depreciation is non-cash, so a rental often shows a tax loss while cash-flowing — sheltering income. Rental losses are passive: they offset passive income freely, and up to $25,000/yr can offset ordinary (W-2) income if you actively participate and your MAGI is under $100k (phasing out to $0 by $150k); unused losses carry forward. On sale, claimed depreciation is recaptured at up to 25%, and gains may owe capital-gains tax (a 1031 exchange can defer both). Figures are a year-1 estimate at your 24.0% rate — not tax advice; consult a CPA.
Schools (NCES district)
- District
- Sanger ISD
- NCES district ID
- 4839180
- Math proficiency
- 38% ▼ -13.00%
- Reading proficiency
- 47% ▼ -2.00%
- Median HH income
- $62,803
- Composite
- 37.76/100
- National rank
- #4349
- State rank
- #281 of 826 in TX
Livability — Sanger
- Score
- 62/100
- State rank
- #958
- US rank
- #16973
Category grades
Schools grade is shown separately in the Schools card above.
Census & demographics
- Census place
- Sanger, TX
- County
- Denton County · 901,654 people
- City population
- 18,155
- Metro
- Dallas-Fort Worth-Arlington, TX
- Population (ZIP)
- 18,155
- Household income
- $99,425
- Rent vs Own
- Severe rent burden
- 325.0
Population outlook (Denton County) Hauer SSP2
- Today (2025)
- 1,053,010 people
- By 2030
- 1,192,269 · +13.2%
- By 2040
- 1,472,920 · +39.9%
- By 2050
- 1,746,506 · +65.9%
- By 2075
- 2,358,497 · +124.0%
- By 2100
- 2,779,183 · +163.9%
Race, ethnicity, and origin ACS 2023
- Neighborhood character
- Predominantly White (74%)
- Race & ethnicity
- White 74% Hispanic / Latino 18% Two or more races 10% Black 5% Asian 1%
- Hispanic origin (detail)
- Mexican 15%
- Common ancestry
- Italian 4% Iranian 2% Lithuanian 2%
- Foreign-born
- 8% · Canada
- Languages at home
- 86% English-only · Spanish 11% Other Indo-European 1% Russian/Polish/Slavic 1%
Political lean MEDSL · Denton
- 2024 margin
- R (+13.2) · D 42.7% · R 55.8% · Other 1.5%
- 2008→2024 swing
- +11.0pp toward D · 2008: -24.2pp · 2024: -13.2pp
- All cycles
- 2024: R+13.2 2020: R+8.1 2016: R+20.2 2012: R+31.7 2008: R+24.2
Not yet ingested
- Civics
- —
Market trends
- HPI YoY
- ▼ -63.07%
- Current HPI
- 284.2146
- Rent YoY
- ▲ 0.57%
- Metro
- Dallas-Fort Worth-Arlington, TX
- State GDP YoY
- ▲ 3.95%
- F500 in state
- 110
Industry mix (Fortune 500 HQ in TX)
| Industry | F500 HQs | Revenue |
|---|---|---|
| Energy | 16 | $1,198B |
|
||
| Technology | 5 | $198B |
|
||
| Engineering / Construction | 4 | $72B |
|
||
| Energy Services | 3 | $60B |
|
||
| Utilities | 3 | $41B |
|
||
| Healthcare | 2 | $330B |
|
||
Price history
+1.9% since first listed8 events — show timeline
- 2026-03-11 Price Changed $264,990 Zillow
- 2026-01-08 Price Changed $263,990 Zillow
- 2025-12-04 Relisted — Zillow
- 2025-11-22 Delisted — Zillow
- 2025-10-30 Price Changed $262,990 Zillow
- 2025-10-30 Price Changed $259,990 Zillow
- 2025-10-30 Price Changed $262,990 Zillow
- 2025-08-09 Listed $259,990 Zillow
Cash-flow waterfall
monthlySold comps — $/sqft
last 12 mo · ≤1 miLoading sold comps…