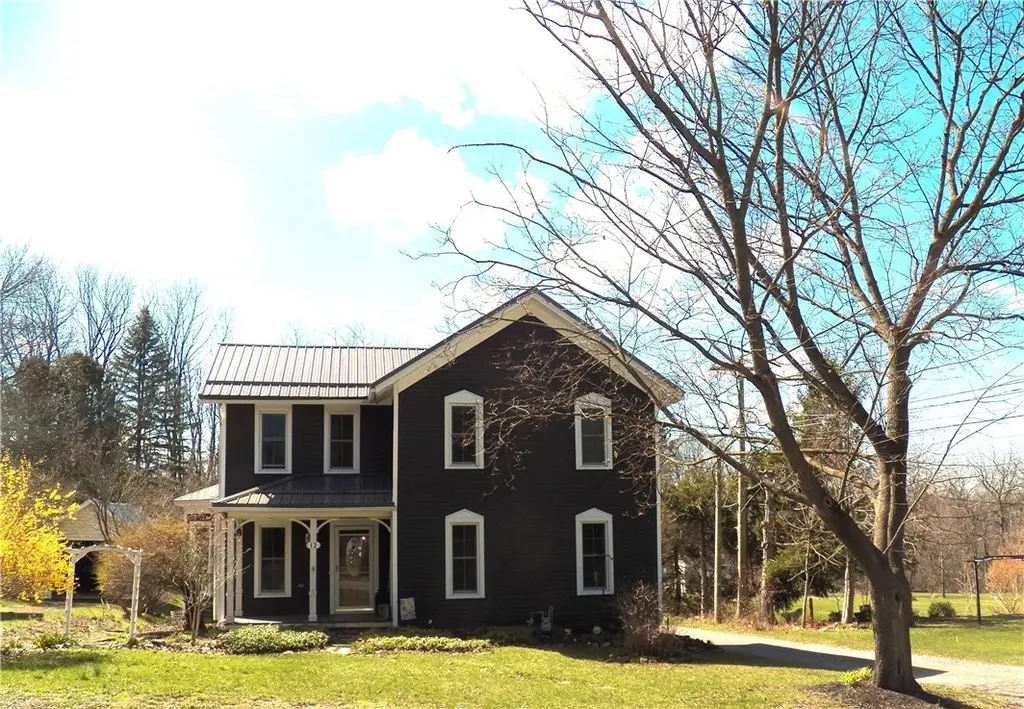
13 Michigan St · Bloomfield, NY
Flood risk 1/10 · Minimal
- FEMA flood zone
- —
- Chance of flooding over 30 yrs
- 0.0%
- Est. flood insurance / yr
- —
Fire risk 2/10 · Minimal
- Est. fire insurance / yr
- $691 – $1,283
Heat risk 2/10 · Minimal
- Hot days now (above 93°F)
- 7 days/yr
- Hot days in 30 yrs
- 16 days/yr
Wind risk 1/10 · Minimal
- Chance of severe wind over 30 yrs
- —
Air-quality risk 2/10 · Minimal
- Unhealthy air days now
- 0 days/yr
- Unhealthy air days in 30 yrs
- 1 days/yr
Risk factors via First Street. Map © Google.
Why this score? — see what drove the D- grade
The composite is a weighted blend of 9 inputs, each scored 0–100. Each bar is that input's sub-score; the figure is the points it added to the 100-point composite (weight × sub-score).
- Cash flow +14.4/30.0
- Schools +5.4/10.0
- 1% rule +4.6/10.0
- DSCR +4.4/10.0
- Livability +3.5/5.0
- Rent growth +2.5/5.0
- Condition / age +2.5/5.0
- ARV discount +0.0/15.0
- Appreciation +0.0/10.0
$239,000
🖨 Deal sheet (PDF) 📄 Offer letter ✓ Due diligence
Listing remarks
Large colonial with many updates . Newer metal roof 2017. Siding only 5 years old . Hardwood floors, some newer windows , Newer bathroom . Formal dinning room with hardwood floors and build in cupboards . Two living rooms . Newer solid wood front door . small laundry room . Furnace and Central air 2016 . Back closed in porch . Nice patio between garage and house. level backyard with gardens and large shed . Flower Gardens in side yard and front yard . Garage and workshop has concrete floor , electric , and gas heat . please 24 hour notice for showings . Delayed negotiations until 4 /20 /26 NOON
Key facts
- Formal dining room
- Newer bathroom
- Back closed in porch
Tags
Neighborhood map
What this means for you Summary
Snapshot
- This is a 2-bed/1.0-bath single-family listed at $239k.
Deal economics
- At list price, monthly cash flow is $47 ($565/yr) — positive.
- The deal already cash-flows at list — no discount required.
- To meet the 1% rule (rent ≥ 1% of price), the offer needs to be $230k (4.0% below list).
- Recommended offer: $230k (4.0% below list) — sets the bar for 1% rule.
Location & tenants
- Location reads 69/100 on livability (#484 in NY) — a middle-class / working-renter tenant base. Strengths: housing A+, crime A, employment A-; Watch: amenities F, commute F, health & safety D-.
- East Bloomfield Central School District (rural): math 64% / reading 61% proficiency, ranked #196 of 590 in NY (top 33%) — acceptable for families but not a draw, mixed tenant base, ~2y average lease.
- Zoned schools: Bloomfield Elementary School (math 72% / reading 62%, grade B+, #525 of 2,108 statewide, top 27%, 350 students, 0% FRL); Bloomfield Middle School (math 42% / reading 57%, grade C, #280 of 729 statewide, top 40%, 171 students, 37% FRL); Bloomfield High School (math 87%, 265 students, 41% FRL) — zoned schools at 26% FRL track the district average.
- Market conditions: 21 active listings in the ZIP; 1 comparable units currently listed for rent nearby; 284 units permitted in Ontario County in 2024 (69 in 5+ unit buildings).
Forward outlook
- Local home prices are declining (-3.0%/yr); year-one equity from $2k of loan paydown is wiped out by about $7k of value loss. Plan a longer hold.
- Ontario County population projected to shrink 6% by 2050 — rents likely to lag national; underwrite the cash flow, not the appreciation.
Negotiation context
- It's been on market 15 days — a 2% lower offer ($235k) is reasonable based on typical stale-listing flexibility.
- Current owner paid $40k; list at $239k implies a 497% gain — meaningful room to come down on a strong offer.
Risks & watch-outs
- Watch-outs: built in 1856 — expect roof / HVAC / electrical / plumbing capex.
Questions for the listing agent
- Built in 1856 — when were the roof, HVAC, electrical panel, plumbing, and water heater last replaced?
- Is there a deadline driving the sale (1031 exchange, divorce, estate, relocation)? That informs how much negotiation room exists.
- Schools are A-rated — typically a magnet for longer-tenancy family renters. What's the average tenant stay here, and is there a school-zone premium baked into asking?
- The area grade is low — what's the realistic commute time and amenity access for the typical tenant pool here? Any planned neighborhood developments (good or bad) we should know about?
- What's the average days-on-market for RENTAL listings here right now (not sales)? A rising rental-DOM trend means longer vacancies and softer asking-rent achievability than the comps imply.
- What's the recent tenant-quality profile in this submarket — average credit score on applications, eviction rate, late-payment / NSF rate, and stable-employment percentage? A property-management company in the area should have these aggregated.
- How much new for-sale + rental construction is in the pipeline within 1–3 miles? Heavy new supply typically softens prices + rents 12–24 months out; constrained supply supports both.
Investment metrics
- 1% rule
- 0.96% ✗
- Cap rate
- 6.53%
- Cash-on-cash
- 0.84%
- DSCR
- 1.04
- GRM
- 8.7
CMA / ARV
- ARV (on-the-fly)
- $176,400
- Comps found
- 3
Show comp detail 3 sales within ~0.75 mi
| Address | Dist | Beds/Ba | Sqft | Sold | Price | $/sf | Match |
|---|---|---|---|---|---|---|---|
| 21 Michigan St | 0.04mi | 3/1.0 (+1) | 1,788 (-1%) | 9mo | $175,000 | $98 | 84 |
| 39 South Ave | 0.49mi | 3/1.5 (+1) | 1,888 (+5%) | 2mo | $165,000 | $87 | 60 |
| 131 Main St | 0.15mi | 3/1.5 (+1) | 1,944 (+8%) | 20mo | $260,000 | $134 | 56 |
Match score weights: distance 35% · size 25% · config 20% · recency 20%. Top-matched comps best support the ARV.
Projected returns pro-forma
-3.0% appreciation · 3.0% rent growth · sell at horizon
- IRR
- -14.9%
- Equity multiple
- 0.47×
- Total profit
- $-35,624
- Equity at exit
- $35,636
- IRR
- -6.2%
- Equity multiple
- 0.60×
- Total profit
- $-26,732
- Equity at exit
- $20,664
Cash invested: $66,920 (down + closing). Projections, not guarantees.
Landlord ↔ Tenant lean methodology
- Overall (STATE)
- 15 Strongly Tenant-Friendly
- State New York
- 15 Strongly Tenant-Friendly · D+10
- County
- — inherits STATE
- City
- — inherits STATE
ZIP-level market 14469
- Home prices YoY
- -15.4%
- Active inventory
- 21
- Price-to-rent
- 8.7×
Monthly cashflow live
- Estimated rent
- $2,295 medium interval (Pro) →
- Mortgage (P&I)
- −$1,253
- Tax from tax record
- −$413 /mo · $4,956/yr
- Insurance
- −$100
- HOA
- −$0
- Vacancy / Maint / Mgmt
- −$482
- Net cashflow
- $47
Break-even live
Sensitivity live
| Price | -10% $182 | -5% $115 | +0% $47 | +5% $-21 | +10% $-88 |
|---|---|---|---|---|---|
| Rent | -10% $-134 | -5% $-44 | +0% $47 | +5% $138 | +10% $228 |
| Rate | -1.0pp $167 | -0.5pp $108 | base $47 | +0.5pp $-15 | +1.0pp $-78 |
UW: 25.0% down · 7.5% · 30yr · 1.5% tax · 5.0% vac · 8.0% maint · 8.0% mgmt
Financing live
Cash to close
- Down payment
- $59,750
- Closing costs
- $7,170
- Reserves months
- —
- Total cash needed
- —
Loan-product check · same deal, 3 products live
Conventional
25% down · 7.5% · 30yr
- Down + closing
- —
- Monthly P&I
- —
- Monthly cashflow
- —
- DSCR
- —
- Eligible?
- —
Personal DTI + credit; lowest rate.
DSCR
20% down · 8.5% · 30yr
- Down + closing
- —
- Monthly P&I
- —
- Monthly cashflow
- —
- DSCR
- —
- Eligible?
- —
No personal income docs; deal must DSCR.
Hard money
10% down · 12.0% · 12mo
- Down + closing
- —
- Monthly P&I
- —
- Monthly cashflow
- —
- DSCR
- —
- Eligible?
- —
Short-term bridge; refi at stabilization.
Rent comps 1 comps
| Address | Beds | Baths | Sqft | Rent | $/sqft | DOM | Units | Dist |
|---|---|---|---|---|---|---|---|---|
| 170 Heartwood Ln Bloomfield, NY | 2.0 | 2.0 | 1350 | $2,295 | $1.70 | 4d | 1 | 0.96mi |
Listing history 3 events
-
2026-04-27status Pending
-
2026-04-12$239,000 Active
-
1993-10-20soldstatus $40,000
ⓘ Source: listings_history table (triggers on properties + properties_extension) + one-shot
backfill from property_details.listing_events for pre-trigger history.
Tax reassessment forecast NY · Partial reset (capped growth)
- Current annual tax
- $4,956 · $413/mo
- Projected year-2 tax
- $4,956 · $413/mo
- Expected delta
- $0/yr ($0/mo · 0.0%)
ⓘ Screening estimate from a state-policy table — verify with the county assessor before closing.
Climate risk First Street
- Flood 1/10 Low 0% chance over 30 yrs
- Wildfire 2/10 Low
- Heat 2/10 Low 7 d/yr ≥93°F today · 16 d/yr by 30 yrs out
- Wind 1/10 Low
- Air quality 2/10 Low 0 unhealthy d/yr today · 1 by 30 yrs out
Nearby sold comps map
Loading sold comps map…
Walkable amenities ~0.75 mi
Loading nearby amenities…
Taxation est. · year 1
- Rental income
- $27,540
- − Mortgage interest
- −$13,388
- − Property taxes
- −$4,956
- − Insurance
- −$1,195
- − Repairs & maintenance
- −$2,203
- − Management
- −$2,203
- − Depreciation
- −$6,953
- Taxable loss
- −$3,358
- Est. tax savings @ 24.0%
- +$806
- After-tax cash flow
- $1,371/yr
For passive investors: Depreciation is non-cash, so a rental often shows a tax loss while cash-flowing — sheltering income. Rental losses are passive: they offset passive income freely, and up to $25,000/yr can offset ordinary (W-2) income if you actively participate and your MAGI is under $100k (phasing out to $0 by $150k); unused losses carry forward. On sale, claimed depreciation is recaptured at up to 25%, and gains may owe capital-gains tax (a 1031 exchange can defer both). Figures are a year-1 estimate at your 24.0% rate — not tax advice; consult a CPA.
Schools (NCES district)
- District
- East Bloomfield Central School District
- NCES district ID
- 3604920
- Math proficiency
- 64% ▼ -4.00%
- Reading proficiency
- 61% ▲ 7.00%
- Median HH income
- $58,217
- Composite
- 53.95/100
- National rank
- #1399
- State rank
- #196 of 590 in NY
Livability — Bloomfield
- Score
- 69/100
- State rank
- #484
- US rank
- #8532
Category grades
Schools grade is shown separately in the Schools card above.
Census & demographics
- Census place
- Bloomfield, NY
- Population (ZIP)
- 5,789
Population outlook (Ontario County) Hauer SSP2
- Today (2025)
- 111,230 people
- By 2030
- 111,401 · +0.2%
- By 2040
- 109,535 · -1.5%
- By 2050
- 104,895 · -5.7%
- By 2075
- 92,999 · -16.4%
- By 2100
- 73,723 · -33.7%
Race, ethnicity, and origin ACS 2023
- Neighborhood character
- Predominantly White (97%)
- Race & ethnicity
- White 97% Two or more races 2%
- Common ancestry
- Lithuanian 6% Iranian 4% Romanian 4%
- Foreign-born
- 2% · Canada
- Languages at home
- 98% English-only · Spanish 1% German/W. Germanic 1%
Political lean MEDSL · Ontario
- 2024 margin
- Toss-up / Even · D 49.4% · R 50.6%
- 2008→2024 swing
- -1.0pp toward R · 2008: -0.1pp · 2024: -1.2pp
- All cycles
- 2024: R+1.2 2020: R+0.0 2016: R+8.6 2012: R+1.6 2008: R+0.1
Not yet ingested
- Civics
- —
Market trends
- HPI YoY
- ▼ -55.61%
- Current HPI
- 305.0485
- Rent YoY
- —
- Metro
- —
- State GDP YoY
- ▲ 2.60%
- F500 in state
- 92
Industry mix (Fortune 500 HQ in NY)
| Industry | F500 HQs | Revenue |
|---|---|---|
| Financial Services | 10 | $950B |
|
||
| Consumer Goods | 9 | $162B |
|
||
| Insurance | 4 | $225B |
|
||
| Telecommunications | 2 | $144B |
|
||
| Pharmaceuticals | 2 | $112B |
|
||
| Media / Entertainment | 2 | $69B |
|
||
Price history
+497.5% since first listed3 events — show timeline
- 2026-04-27 Pending — UNYREIS
- 2026-04-12 Listed $239,000 UNYREIS
- 1993-10-20 Sold (Public Records) $40,000 Public Records
Property tax history
+6.7%/yrLatest (2025): $4,956 · +0.6% YoY. Source: county tax records.
Cash-flow waterfall
monthlySold comps — $/sqft
last 12 mo · ≤1 miLoading sold comps…