 🔨 Auction
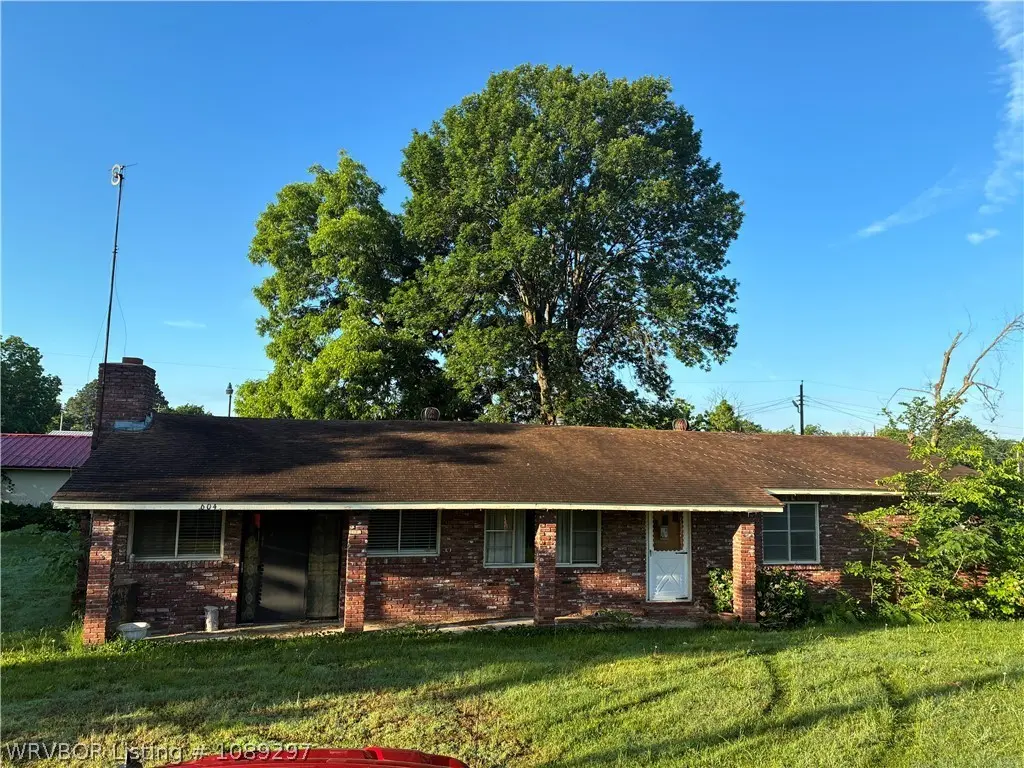
604 Del Norte Ave · Wister, OK
Flood risk 1/10 · Minimal
- FEMA flood zone
- X (unshaded)
- Chance of flooding over 30 yrs
- 0.0%
- Est. flood insurance / yr
- $507 – $1,088
Fire risk 6/10 · Moderate
- Est. fire insurance / yr
- $2,463 – $4,575
Heat risk 7/10 · Major
- Hot days now (above 114°F)
- 7 days/yr
- Hot days in 30 yrs
- 21 days/yr
Wind risk 3/10 · Minor
- Chance of severe wind over 30 yrs
- 5.0%
Air-quality risk 1/10 · Minimal
- Unhealthy air days now
- 0 days/yr
- Unhealthy air days in 30 yrs
- 0 days/yr
Risk factors via First Street. Map © Google.
Why this score? — see what drove the F grade
The composite is a weighted blend of 9 inputs, each scored 0–100. Each bar is that input's sub-score; the figure is the points it added to the 100-point composite (weight × sub-score).
- Appreciation +8.7/10.0
- ARV discount +7.5/15.0
- Cash flow +3.1/30.0
- Livability +3.1/5.0
- Rent growth +2.5/5.0
- Condition / age +2.5/5.0
- Schools +1.1/10.0
- 1% rule +0.0/10.0
- DSCR +0.0/10.0
$1
🖨 Deal sheet 📄 Offer letter ✓ Due diligence
Listing remarks
Auction 06/19/2026 at 11:00 AM This property offers excellent potential for an investor or rental property opportunity. Situated on a large lot, the property includes a 1,755± sq. ft. 3-bedroom, 2-bathroom home along with multiple outbuildings for storage, workshop space, or business use. Improvements include a block outbuilding and a quality red iron shop, providing plenty of room for equipment, inventory, or additional storage needs. With ample space and versatile improvements, this property offers endless possibilities for the next owner.
Key facts
- Workshop space
- Red iron shop
- Large lot
Tags
Property features AI
Exterior
- Parking: Detached carport; 2 covered parking spaces; Concrete parking surface
- Security: Smoke detectors
- Utilities: Public water; Public sewer; Electricity available; Natural gas available
- Home design: Single-family house; One story
- Construction: Brick construction; Asphalt shingle roof
- Exterior features: Patio; Porch; Corner lot; Cleared lot; Outbuilding; Paved public road access
Interior
- Kitchen: Oven; Gas water heater
- Flooring: Carpet; Laminate; Wood
- Bathrooms: 2 full bathrooms
- Heating & cooling: Natural gas heating; Window cooling units; Ceiling fans
- Interior features: Ceiling fans; Storage; Wood-burning fireplace
- Laundry & utility: Washer hookup; Electric dryer hookup
Neighborhood map
What this means for you Summary
Snapshot
- This is a 3-bed/2.0-bath single-family listed at $1.
Deal economics
- At list price, monthly cash flow is $-823 ($-10k/yr) — negative.
- The deal already cash-flows at list — no discount required.
- Meets the 1% rule at list price ($1k rent vs $1).
Location & tenants
- Location reads 61/100 on livability (#320 in OK) — a middle-class / working-renter tenant base. Strengths: cost of living A+, housing A+, crime B+; Watch: amenities F, commute F, employment F.
- Wister (rural): math 12% / reading 15% proficiency, ranked #240 of 270 in OK (top 89%) — low school quality limits family demand, transient renter base, plan for 1-2y turnover; 66% free/reduced lunch — lower-income household profile, screen leases tightly.
- Zoned schools: Wister Es (math 12% / reading 12%, grade F, #667 of 845 statewide, top 82%, 335 students, 0% FRL); Wister Hs (math 5% / reading 24%, grade F, #332 of 447 statewide, top 78%, 167 students, 0% FRL) — zoned schools average 0% FRL vs 66% district-wide (66 pts lower); this property's tenant base skews higher-income than the district average.
- Market conditions: 53 active listings in the ZIP; 73 units permitted in Le Flore County in 2024 (0 in 5+ unit buildings).
Forward outlook
- In year one you build about $21k of equity ($2k loan paydown + $19k appreciation (7.5% local appreciation)).
- Le Flore County population projected at -13% by 2050 — secular population decline; favor cash flow + early exit over multi-decade hold.
- By year 2, paydown + projected appreciation supports a ~$33k cash-out refi (75% LTV) — recoverable capital for the next deal without selling this one.
Negotiation context
- It's been on market 24 days — a 2% lower offer ($0) is reasonable based on typical stale-listing flexibility.
- 3 sale attempts since 3y ago with the ask held roughly flat each time — persistent listings suggest the price (not the market) is what's stuck; bring a comps-based counter.
Risks & watch-outs
- Watch-outs: property tax is 384345.0% of price.
- Climate carrying-cost: major wildfire risk; extreme-heat days projected 7→21/yr by 2055 (HVAC capex compounding) — expect insurance premiums to compound above CPI over the hold.
Questions for the listing agent
- What do current leases actually rent for vs. the listed asking? Can we see a recent rent roll and the last 12 months of T-12 income?
- Built in 1965 — when were the roof, HVAC, electrical panel, plumbing, and water heater last replaced?
- Property tax is high relative to price — has the assessment been appealed recently, and will the sale trigger a re-assessment?
- Is there a deadline driving the sale (1031 exchange, divorce, estate, relocation)? That informs how much negotiation room exists.
- Schools are F-rated, which usually means shorter tenancies and higher turnover. Who's the typical renter profile here, and what's been the actual vacancy rate?
- The area grade is low — what's the realistic commute time and amenity access for the typical tenant pool here? Any planned neighborhood developments (good or bad) we should know about?
- What's the average days-on-market for RENTAL listings here right now (not sales)? A rising rental-DOM trend means longer vacancies and softer asking-rent achievability than the comps imply.
- What's the recent tenant-quality profile in this submarket — average credit score on applications, eviction rate, late-payment / NSF rate, and stable-employment percentage? A property-management company in the area should have these aggregated.
- How much new for-sale + rental construction is in the pipeline within 1–3 miles? Heavy new supply typically softens prices + rents 12–24 months out; constrained supply supports both.
Investment metrics
- 1% rule
- 0.47% ✗
- Cap rate
- 2.44%
- Cash-on-cash
- -13.76%
- DSCR
- 0.39
- GRM
- 17.8
CMA / ARV
- ARV (on-the-fly)
- $256,230
- Comps found
- 10
Show comp detail 10 sales within ~0.75 mi
| Address | Dist | Beds/Ba | Sqft | Sold | Price | $/sf | Match |
|---|---|---|---|---|---|---|---|
| 203 Rock Creek Dr | 0.36mi | 3/2.0 | 1,759 (+0%) | 7mo | $315,000 | $179 | 77 |
| 113 Rock Creek Dr | 0.23mi | 4/2.0 (+1) | 1,680 (-4%) | 1mo | $306,500 | $182 | 76 |
| 703 Rosettie St | 0.17mi | 3/2.0 | 1,582 (-10%) | 4mo | $152,500 | $96 | 72 |
| 601 Wiggington | 0.09mi | 3/1.5 | 1,534 (-13%) | 3mo | $140,000 | $91 | 70 |
| 604 Bayless | 0.27mi | 2/2.0 (-1) | 1,849 (+5%) | 24mo | $208,000 | $112 | 54 |
| 506 Highland Ave | 0.31mi | 3/2.0 | 1,598 (-9%) | 21mo | $150,000 | $94 | 53 |
| 211 Blackstone Dr | 0.71mi | 4/2.0 (+1) | 1,815 (+3%) | 4mo | $299,000 | $165 | 53 |
| 103 Blackstone Cir | 0.52mi | 3/2.0 | 1,505 (-14%) | 2mo | $220,000 | $146 | 50 |
| 104 Pierce Loop | 0.48mi | 3/2.0 | 1,988 (+13%) | 11mo | $235,000 | $118 | 46 |
| 200 Blackstone Dr | 0.64mi | 4/2.0 (+1) | 1,829 (+4%) | 22mo | $285,000 | $156 | 40 |
Match score weights: distance 35% · size 25% · config 20% · recency 20%. Top-matched comps best support the ARV.
Projected returns pro-forma
7.45% appreciation · 3.0% rent growth · sell at horizon
- IRR
- 8.4%
- Equity multiple
- 1.62×
- Total profit
- $44,251
- Equity at exit
- $185,175
- IRR
- 9.9%
- Equity multiple
- 3.33×
- Total profit
- $167,348
- Equity at exit
- $358,870
Cash invested: $71,744 (down + closing). Projections, not guarantees.
Landlord ↔ Tenant lean methodology
- Overall (STATE)
- 83 Strongly Landlord-Friendly
- State Oklahoma
- 83 Strongly Landlord-Friendly · R+20
- County
- — inherits STATE
- City
- — inherits STATE
ZIP-level market 74966
- Home prices YoY
- 2.5%
- Active inventory
- 53
Monthly cashflow live
- Estimated rent
- $1,200 medium interval (Pro) →
- Mortgage (P&I)
- −$1,344
- Tax est. 1.5%
- −$320 /mo · $3,843/yr
- Insurance
- −$107
- HOA
- −$0
- Vacancy / Maint / Mgmt
- −$252
- Net cashflow
- $-823
Break-even live
UW: 25.0% down · 7.5% · 30yr · 1.5% tax · 5.0% vac · 8.0% maint · 8.0% mgmt
Financing live
Cash to close
- Down payment
- $64,058
- Closing costs
- $7,687
- Reserves months
- —
- Total cash needed
- —
Loan-product check · same deal, 3 products live
Conventional
25% down · 7.5% · 30yr
- Down + closing
- —
- Monthly P&I
- —
- Monthly cashflow
- —
- DSCR
- —
- Eligible?
- —
Personal DTI + credit; lowest rate.
DSCR
20% down · 8.5% · 30yr
- Down + closing
- —
- Monthly P&I
- —
- Monthly cashflow
- —
- DSCR
- —
- Eligible?
- —
No personal income docs; deal must DSCR.
Hard money
10% down · 12.0% · 12mo
- Down + closing
- —
- Monthly P&I
- —
- Monthly cashflow
- —
- DSCR
- —
- Eligible?
- —
Short-term bridge; refi at stabilization.
Listing history 21 events
-
2026-06-18days on market $1 Active 24 DOM
-
2026-06-17days on market $1 Active 23 DOM
-
2026-06-16days on market $1 Active 22 DOM
-
2026-06-15days on market $1 Active 21 DOM
-
2026-06-13days on market $1 Active 19 DOM
-
2026-06-12days on market $1 Active 18 DOM
-
2026-06-09days on market $1 Active 15 DOM
-
2026-06-08days on market $1 Active 14 DOM
-
2026-06-08days on market $1 Active 13 DOM
-
2026-06-07days on market $1 Active 12 DOM
-
2026-06-04days on market $1 Active 9 DOM
-
2026-06-02days on market $1 Active 8 DOM
-
2026-06-01days on market $1 Active 7 DOM
-
2026-05-31days on market $1 Active 6 DOM
-
2026-05-26$1 Active
-
2023-10-24status Active
-
2023-09-23status Pending
-
2023-08-16price $120,000
-
2023-05-11price $170,000
-
2023-04-10$175,500 Active
-
1992-11-13soldstatus $25,000
ⓘ Source: listings_history table (triggers on properties + properties_extension) + one-shot
backfill from property_details.listing_events for pre-trigger history.
Climate risk First Street
- Flood 1/10 Low FEMA zone X (unshaded) · 0% chance over 30 yrs
- Wildfire 6/10 Major
- Heat 7/10 Severe 7 d/yr ≥114°F today · 21 d/yr by 30 yrs out
- Wind 3/10 Moderate 5% chance of damaging wind over 30 yrs
- Air quality 1/10 Low 0 unhealthy d/yr today · 0 by 30 yrs out
Nearby sold comps map
Loading sold comps map…
Walkable amenities ~0.75 mi
Loading nearby amenities…
Taxation est. · year 1
- Rental income
- $14,401
- − Mortgage interest
- −$14,353
- − Property taxes
- −$3,843
- − Insurance
- −$1,281
- − Repairs & maintenance
- −$1,152
- − Management
- −$1,152
- − Depreciation
- −$7,454
- Taxable loss
- −$14,835
- Est. tax savings @ 24.0%
- +$3,560
- After-tax cash flow
- $-6,312/yr
For passive investors: Depreciation is non-cash, so a rental often shows a tax loss while cash-flowing — sheltering income. Rental losses are passive: they offset passive income freely, and up to $25,000/yr can offset ordinary (W-2) income if you actively participate and your MAGI is under $100k (phasing out to $0 by $150k); unused losses carry forward. On sale, claimed depreciation is recaptured at up to 25%, and gains may owe capital-gains tax (a 1031 exchange can defer both). Figures are a year-1 estimate at your 24.0% rate — not tax advice; consult a CPA.
Schools (NCES district)
- District
- Wister
- NCES district ID
- 4032970
- Math proficiency
- 12% ▼ -3.00%
- Reading proficiency
- 15% ▼ -5.00%
- Median HH income
- $35,564
- Composite
- 11.14/100
- National rank
- #9729
- State rank
- #240 of 270 in OK
Livability — Wister
- Score
- 61/100
- State rank
- #320
- US rank
- #18277
Category grades
Schools grade is shown separately in the Schools card above.
Census & demographics
- Census place
- Wister, OK
- Population (ZIP)
- 3,540
Population outlook (Le Flore County) Hauer SSP2
- Today (2025)
- 48,504 people
- By 2030
- 47,474 · -2.1%
- By 2040
- 44,914 · -7.4%
- By 2050
- 42,239 · -12.9%
- By 2075
- 35,071 · -27.7%
- By 2100
- 25,949 · -46.5%
Race, ethnicity, and origin ACS 2023
- Neighborhood character
- Predominantly White (72%)
- Race & ethnicity
- White 72% Native American 13% Two or more races 12% Hispanic / Latino 3%
- Common ancestry
- Serbian 3% Slovak 2% Italian 1%
- Foreign-born
- 1% · Canada
- Languages at home
- 98% English-only · Spanish 1%
Political lean MEDSL · Le Flore
- 2024 margin
- Solid R (+64.8) · D 17.0% · R 81.8% · Other 1.3%
- 2008→2024 swing
- -26.1pp toward R · 2008: -38.6pp · 2024: -64.8pp
- All cycles
- 2024: R+64.8 2020: R+63.4 2016: R+58.7 2012: R+41.1 2008: R+38.6
Not yet ingested
- Civics
- —
Market trends
- HPI YoY
- ▲ 7.45%
- Current HPI
- 301.2538
- Rent YoY
- —
- Metro
- —
- State GDP YoY
- ▲ 1.55%
- F500 in state
- 6
Industry mix (Fortune 500 HQ in OK)
| Industry | F500 HQs | Revenue |
|---|---|---|
| Energy | 3 | $48B |
|
||
Price history
+380.0% since first listed7 events — show timeline
- 2026-05-26 Listed $1 WRVBOR
- 2023-10-24 Relisted — WRVBOR
- 2023-09-23 Pending — WRVBOR
- 2023-08-16 Price Changed $120,000 WRVBOR
- 2023-05-11 Price Changed $170,000 WRVBOR
- 2023-04-10 Listed $175,500 WRVBOR
- 1992-11-13 Sold (Public Records) $25,000 Public Records
Property tax history
+2.4%/yrLatest (2025): $724 · +4.9% YoY. Source: county tax records.
Cash-flow waterfall
monthlySold comps — $/sqft
last 12 mo · ≤1 miLoading sold comps…