3315 Stoneway Ct · Champaign, IL
Flood risk 1/10 · Minimal
- FEMA flood zone
- X (unshaded)
- Chance of flooding over 30 yrs
- 0.0%
- Est. flood insurance / yr
- $507 – $1,088
Fire risk 1/10 · Minimal
- Est. fire insurance / yr
- $804 – $1,492
Heat risk 3/10 · Minor
- Hot days now (above 104°F)
- 7 days/yr
- Hot days in 30 yrs
- 19 days/yr
Wind risk 2/10 · Minimal
- Chance of severe wind over 30 yrs
- 1.0%
Air-quality risk 2/10 · Minimal
- Unhealthy air days now
- 0 days/yr
- Unhealthy air days in 30 yrs
- 1 days/yr
Risk factors via First Street. Map © Google.
Why this score? — see what drove the D+ grade
The composite is a weighted blend of 9 inputs, each scored 0–100. Each bar is that input's sub-score; the figure is the points it added to the 100-point composite (weight × sub-score).
- Cash flow +19.6/30.0
- ARV discount +7.1/15.0
- DSCR +6.2/10.0
- Livability +4.2/5.0
- 1% rule +4.0/10.0
- Rent growth +2.5/5.0
- Condition / age +2.5/5.0
- Schools +2.2/10.0
- Appreciation +0.0/10.0
$237,000
🖨 Deal sheet 📄 Offer letter ✓ Due diligence
Listing remarks MLS
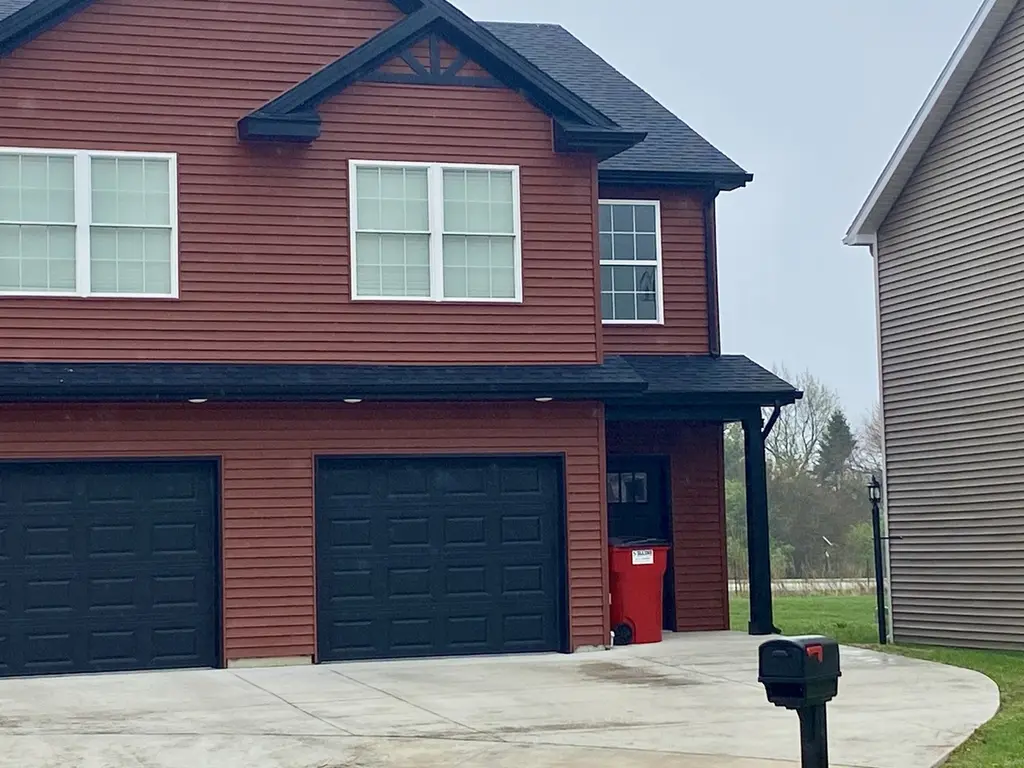
Experience modern living in this stunning 2024-built, two-story townhouse. In Boulder ridge subdivision, this home features three spacious bedrooms and 2.5 bathrooms, including a primary suite designed for comfort and convenience. The interior is highlighted by sleek finished concrete floors on first floor with LVP hardwood floors upstairs. Elegant quartz countertops throughout kitchen and bathrooms with top grade cabinetry. Step outside to enjoy your backyard space, complete with a concrete patio perfect for outdoor relaxation. This is an end unit with a side yard for more space. There is also a 1-car garage providing secure parking and additional storage!
Key facts
- Quartz countertops
- Top grade cabinetry
- Concrete patio
Tags
Neighborhood map
What this means for you Summary
Snapshot
- This is a 3-bed/2.5-bath other listed at $237k.
Deal economics
- At list price, monthly cash flow is $271 ($3k/yr) — positive.
- The deal already cash-flows at list — no discount required.
- To meet the 1% rule (rent ≥ 1% of price), the offer needs to be $214k (9.8% below list).
- Recommended offer: $214k (9.8% below list) — sets the bar for 1% rule.
- Cap rate 7.7% vs local median 3.8% in Champaign — top-decile yield for the area; either an underpriced asset or a hidden risk that comps aren't pricing in. Stress-test before assuming the spread holds.
Location & tenants
- Location reads 83/100 on livability (#44 in IL, #902 nationally) — a professional / high-income tenant draw. Strengths: commute A+, cost of living A+, housing A+; Watch: crime F.
- Champaign CUSD 4 (urban): math 24% / reading 26% proficiency, ranked #333 of 620 in IL (top 54%) — low school quality limits family demand, transient renter base, plan for 1-2y turnover.
- Market conditions: 126 active listings in the ZIP; 10 comparable units currently listed for rent nearby; rentals leasing fast (median 13d on market — plan ~1-2 weeks tenant-placement turnaround); solid renter incomes; 573 units permitted in Champaign County in 2024 (359 in 5+ unit buildings).
Forward outlook
- Local home prices are declining (-3.0%/yr); year-one equity from $2k of loan paydown is wiped out by about $7k of value loss. Plan a longer hold.
- Champaign County population projected at +15% by 2050 — modest demand growth; plan on rents tracking national, not racing it.
Negotiation context
- It's been on market 59 days — a 3% lower offer ($230k) is reasonable based on typical stale-listing flexibility.
- 3 sale attempts with the ask held roughly flat each time — persistent listings suggest the price (not the market) is what's stuck; bring a comps-based counter.
- Current owner paid $120k; list at $237k implies a 98% gain — meaningful room to come down on a strong offer.
Questions for the listing agent
- It's been on market 59 days. Have you received any prior offers? Is the seller open to a 10% concession, seller financing, or rate buy-down credit?
- What does the HOA fee cover, when was the last increase, and are there any pending special assessments or reserve-fund shortfalls?
- Is there a deadline driving the sale (1031 exchange, divorce, estate, relocation)? That informs how much negotiation room exists.
- Crime grade is F in this area — have there been break-ins, vandalism, or insurance claims at this property in the last 3 years? What carrier currently insures it and at what premium?
- The area grade is low — what's the realistic commute time and amenity access for the typical tenant pool here? Any planned neighborhood developments (good or bad) we should know about?
- What's the average days-on-market for RENTAL listings here right now (not sales)? A rising rental-DOM trend means longer vacancies and softer asking-rent achievability than the comps imply.
- What's the recent tenant-quality profile in this submarket — average credit score on applications, eviction rate, late-payment / NSF rate, and stable-employment percentage? A property-management company in the area should have these aggregated.
- How much new for-sale + rental construction is in the pipeline within 1–3 miles? Heavy new supply typically softens prices + rents 12–24 months out; constrained supply supports both.
Investment metrics
- 1% rule
- 0.90% ✗
- Cap rate
- 7.67%
- Cash-on-cash
- 4.91%
- DSCR
- 1.22
- GRM
- 9.2
CMA / ARV
- ARV (median comp)
- $234,926
- List price
- $237,000
- Delta
- 0.88%
- Verdict
- FAIR
- Comps
- 20 within 1.0 mi
Projected returns pro-forma
-3.0% appreciation · 3.0% rent growth · sell at horizon
- IRR
- -8.7%
- Equity multiple
- 0.68×
- Total profit
- $-21,230
- Equity at exit
- $35,337
- IRR
- 0.7%
- Equity multiple
- 1.05×
- Total profit
- $3,343
- Equity at exit
- $20,491
Cash invested: $66,360 (down + closing). Projections, not guarantees.
Landlord ↔ Tenant lean methodology
- Overall (STATE)
- 43 Moderately Tenant-Leaning
- State Illinois
- 43 Moderately Tenant-Leaning · D+7
- County
- — inherits STATE
- City
- — inherits STATE
ZIP-level market 61822
- Home prices YoY
- -15.6%
- Active inventory
- 126
- Price-to-rent
- 9.2×
Monthly cashflow live
- Estimated rent
- $2,139 high interval (Pro) →
- Mortgage (P&I)
- −$1,243
- Tax from tax record
- −$67 /mo · $800/yr
- Insurance
- −$99
- HOA
- −$10
- Vacancy / Maint / Mgmt
- −$449
- Net cashflow
- $271
Break-even live
UW: 25.0% down · 7.5% · 30yr · 1.5% tax · 5.0% vac · 8.0% maint · 8.0% mgmt
Financing live
Cash to close
- Down payment
- $59,250
- Closing costs
- $7,110
- Reserves months
- —
- Total cash needed
- —
Loan-product check · same deal, 3 products live
Conventional
25% down · 7.5% · 30yr
- Down + closing
- —
- Monthly P&I
- —
- Monthly cashflow
- —
- DSCR
- —
- Eligible?
- —
Personal DTI + credit; lowest rate.
DSCR
20% down · 8.5% · 30yr
- Down + closing
- —
- Monthly P&I
- —
- Monthly cashflow
- —
- DSCR
- —
- Eligible?
- —
No personal income docs; deal must DSCR.
Hard money
10% down · 12.0% · 12mo
- Down + closing
- —
- Monthly P&I
- —
- Monthly cashflow
- —
- DSCR
- —
- Eligible?
- —
Short-term bridge; refi at stabilization.
Rent comps 10 comps
| Address | Beds | Baths | Sqft | Rent | $/sqft | DOM | Units | Dist |
|---|---|---|---|---|---|---|---|---|
| 3315 Boulder Ridge Dr Champaign, IL | 3.0 | 2.5 | 1500 | $2,200 | $1.47 | 13d | 1 | 0.06mi |
| 1504 Stonebluff Ct Unit 1504 Champaign, IL | 3.0 | 2.0 | 1583 | $2,500 | $1.58 | 43d | 1 | 0.12mi |
| 1507 Stonebluff Ct Unit 1507 Champaign, IL | 3.0 | 2.5 | 1400 | $2,100 | $1.50 | 13d | 1 | 0.15mi |
| 1509 Stonebluff Ct Unit 1509 Champaign, IL | 3.0 | 2.5 | 1400 | $2,100 | $1.50 | 13d | 1 | 0.15mi |
| 1113 Laura Dr Champaign, IL | 2.0 | 1.0 | 900 | $1,295 | $1.44 | 20d | 1 | 0.49mi |
| 515 Clearwater Dr Champaign, IL | 3.0 | 2.5 | 1536 | $2,150 | $1.40 | 13d | 1 | 0.99mi |
| 2002 W Bradley Ave Champaign, IL | 1.0–2.0 | 1.0–2.0 | 690 | $1,495 | $2.17 | 13d | 3 | 1.10mi |
| 2000 N Mattis Ave Champaign, IL | 1.0–3.0 | 1.0 | 900 | $1,040 | $1.16 | 13d | 1 | 1.27mi |
| 410 Ginger Bend Dr Champaign, IL | 1.0–2.0 | 1.0–2.0 | 913 | $1,580 | $1.73 | 13d | 18 | 1.48mi |
| 1909 Joanne Ln Unit A Champaign, IL | 3.0 | 1.0 | 1000 | $1,350 | $1.35 | 13d | 1 | 1.49mi |
HOA detail
- Monthly dues
- $10 · $120/yr
Listing history 24 events
-
2026-06-18days on market $237,000 Active 59 DOM
-
2026-06-17days on market $237,000 Active 58 DOM
-
2026-06-16days on market $237,000 Active 57 DOM
-
2026-06-15days on market $237,000 Active 56 DOM
-
2026-06-14days on market $237,000 Active 54 DOM
-
2026-06-13days on market $237,000 Active 53 DOM
-
2026-06-10days on market $237,000 Active 51 DOM
-
2026-06-09days on market $237,000 Active 50 DOM
-
2026-06-08days on market $237,000 Active 49 DOM
-
2026-06-07days on market $237,000 Active 48 DOM
-
2026-06-05days on market $237,000 Active 45 DOM
-
2026-06-03days on market $237,000 Active 44 DOM
-
2026-06-02days on market $237,000 Active 43 DOM
-
2026-06-01days on market $237,000 Active 42 DOM
-
2026-05-31days on market $237,000 Active 41 DOM
-
2026-05-30days on market $237,000 Active 40 DOM
-
2026-05-05status Active 665-char remark
Show marketing remark (665 chars)
Experience modern living in this stunning 2024-built, two-story townhouse. In Boulder ridge subdivision, this home features three spacious bedrooms and 2.5 bathrooms, including a primary suite designed for comfort and convenience. The interior is highlighted by sleek finished concrete floors on first floor with LVP hardwood floors upstairs. Elegant quartz countertops throughout kitchen and bathrooms with top grade cabinetry. Step outside to enjoy your backyard space, complete with a concrete patio perfect for outdoor relaxation. This is an end unit with a side yard for more space. There is also a 1-car garage providing secure parking and additional storage!
-
2026-04-27historical Contingent - No Showings 665-char remark
Show marketing remark (665 chars)
Experience modern living in this stunning 2024-built, two-story townhouse. In Boulder ridge subdivision, this home features three spacious bedrooms and 2.5 bathrooms, including a primary suite designed for comfort and convenience. The interior is highlighted by sleek finished concrete floors on first floor with LVP hardwood floors upstairs. Elegant quartz countertops throughout kitchen and bathrooms with top grade cabinetry. Step outside to enjoy your backyard space, complete with a concrete patio perfect for outdoor relaxation. This is an end unit with a side yard for more space. There is also a 1-car garage providing secure parking and additional storage!
-
2026-04-20$237,000 Active 665-char remark
Show marketing remark (665 chars)
Experience modern living in this stunning 2024-built, two-story townhouse. In Boulder ridge subdivision, this home features three spacious bedrooms and 2.5 bathrooms, including a primary suite designed for comfort and convenience. The interior is highlighted by sleek finished concrete floors on first floor with LVP hardwood floors upstairs. Elegant quartz countertops throughout kitchen and bathrooms with top grade cabinetry. Step outside to enjoy your backyard space, complete with a concrete patio perfect for outdoor relaxation. This is an end unit with a side yard for more space. There is also a 1-car garage providing secure parking and additional storage!
-
2026-04-04historical $2,075
-
2026-02-26$2,075
-
2019-11-06soldstatus $120,000
-
2013-11-15soldstatus $58,000
-
2007-01-16soldstatus $294,000
ⓘ Source: listings_history table (triggers on properties + properties_extension) + one-shot
backfill from property_details.listing_events for pre-trigger history.
Tax reassessment forecast IL · Partial reset (capped growth)
- Current annual tax
- $800 · $67/mo
- Projected year-2 tax
- $3,090 · $257/mo
- Expected delta
- +$2,290/yr (+$191/mo · 286.4%)
ⓘ Screening estimate from a state-policy table — verify with the county assessor before closing.
Climate risk First Street
- Flood 1/10 Low FEMA zone X (unshaded) · 0% chance over 30 yrs
- Wildfire 1/10 Low
- Heat 3/10 Moderate 7 d/yr ≥104°F today · 19 d/yr by 30 yrs out
- Wind 2/10 Low 100% chance of damaging wind over 30 yrs
- Air quality 2/10 Low 0 unhealthy d/yr today · 1 by 30 yrs out
Nearby sold comps map
Loading sold comps map…
Walkable amenities ~0.75 mi
Loading nearby amenities…
Taxation est. · year 1
- Rental income
- $25,663
- − Mortgage interest
- −$13,276
- − Property taxes
- −$800
- − Insurance
- −$1,185
- − Repairs & maintenance
- −$2,053
- − Management
- −$2,053
- − HOA
- −$120
- − Depreciation
- −$6,895
- Taxable loss
- −$718
- Est. tax savings @ 24.0%
- +$172
- After-tax cash flow
- $3,427/yr
For passive investors: Depreciation is non-cash, so a rental often shows a tax loss while cash-flowing — sheltering income. Rental losses are passive: they offset passive income freely, and up to $25,000/yr can offset ordinary (W-2) income if you actively participate and your MAGI is under $100k (phasing out to $0 by $150k); unused losses carry forward. On sale, claimed depreciation is recaptured at up to 25%, and gains may owe capital-gains tax (a 1031 exchange can defer both). Figures are a year-1 estimate at your 24.0% rate — not tax advice; consult a CPA.
Schools (NCES district)
- District
- Champaign CUSD 4
- NCES district ID
- 1709420
- Math proficiency
- 24% ▼ -7.00%
- Reading proficiency
- 26% ▼ -7.00%
- Median HH income
- $45,797
- Composite
- 21.66/100
- National rank
- #8281
- State rank
- #333 of 620 in IL
Livability — Champaign
- Score
- 83/100
- State rank
- #44
- US rank
- #902
Category grades
Schools grade is shown separately in the Schools card above.
Census & demographics
- Census place
- Champaign, IL
- County
- Champaign County · 182,148 people
- City population
- 96,852
- Metro
- Champaign-Urbana, IL
- Population (ZIP)
- 27,642
- Household income
- $99,006
- Rent vs Own
- Severe rent burden
- 733.0
Population outlook (Champaign County) Hauer SSP2
- Today (2025)
- 223,848 people
- By 2030
- 231,416 · +3.4%
- By 2040
- 244,321 · +9.1%
- By 2050
- 256,432 · +14.6%
- By 2075
- 285,823 · +27.7%
- By 2100
- 296,406 · +32.4%
Race, ethnicity, and origin ACS 2023
- Neighborhood character
- Diverse neighborhood (Simpson 0.62)
- Race & ethnicity
- White 57% Asian 17% Black 14% Two or more races 7% Hispanic / Latino 6%
- Hispanic origin (detail)
- Mexican 2%
- Common ancestry
- Romanian 3% Lithuanian 2% Italian 2%
- Foreign-born
- 18% · China, Canada, South Korea
- Languages at home
- 76% English-only · Chinese 6% Spanish 4% Other Asian/Pacific 3%
Political lean MEDSL · Champaign
- 2024 margin
- Strong D (+24.1) · D 61.3% · R 37.2% · Other 1.5%
- 2008→2024 swing
- +6.6pp toward D · 2008: 17.5pp · 2024: 24.1pp
- All cycles
- 2024: D+24.1 2020: D+22.8 2016: D+18.4 2012: D+6.8 2008: D+17.5
Not yet ingested
- Civics
- —
Market trends
- HPI YoY
- ▼ -37.60%
- Current HPI
- 203.8781
- Rent YoY
- —
- Metro
- Champaign-Urbana, IL
- State GDP YoY
- ▲ 1.59%
- F500 in state
- 60
Industry mix (Fortune 500 HQ in IL)
| Industry | F500 HQs | Revenue |
|---|---|---|
| Insurance | 4 | $201B |
|
||
| Consumer Goods | 4 | $87B |
|
||
| Industrial Machinery | 3 | $64B |
|
||
| Healthcare | 2 | $55B |
|
||
| Retail / Pharmacy | 1 | $148B |
|
||
| Agriculture / Food | 1 | $86B |
|
||
Price history
-19.4% since first listed8 events — show timeline
- 2026-05-05 Relisted — MRED as Distributed by MLS Grid
- 2026-04-27 Contingent — MRED as Distributed by MLS Grid
- 2026-04-20 Listed $237,000 MRED as Distributed by MLS Grid
- 2026-04-04 Rental Removed $2,075 APPFOLIO
- 2026-02-26 Listed for Rent $2,075 APPFOLIO
- 2019-11-06 Sold (Public Records) $120,000 Public Records
- 2013-11-15 Sold (Public Records) $58,000 Public Records
- 2007-01-16 Sold (Public Records) $294,000 Public Records
Property tax history
+5.5%/yrLatest (2024): $800 · +1051.6% YoY. Source: county tax records.
Cash-flow waterfall
monthlySold comps — $/sqft
last 12 mo · ≤1 miLoading sold comps…