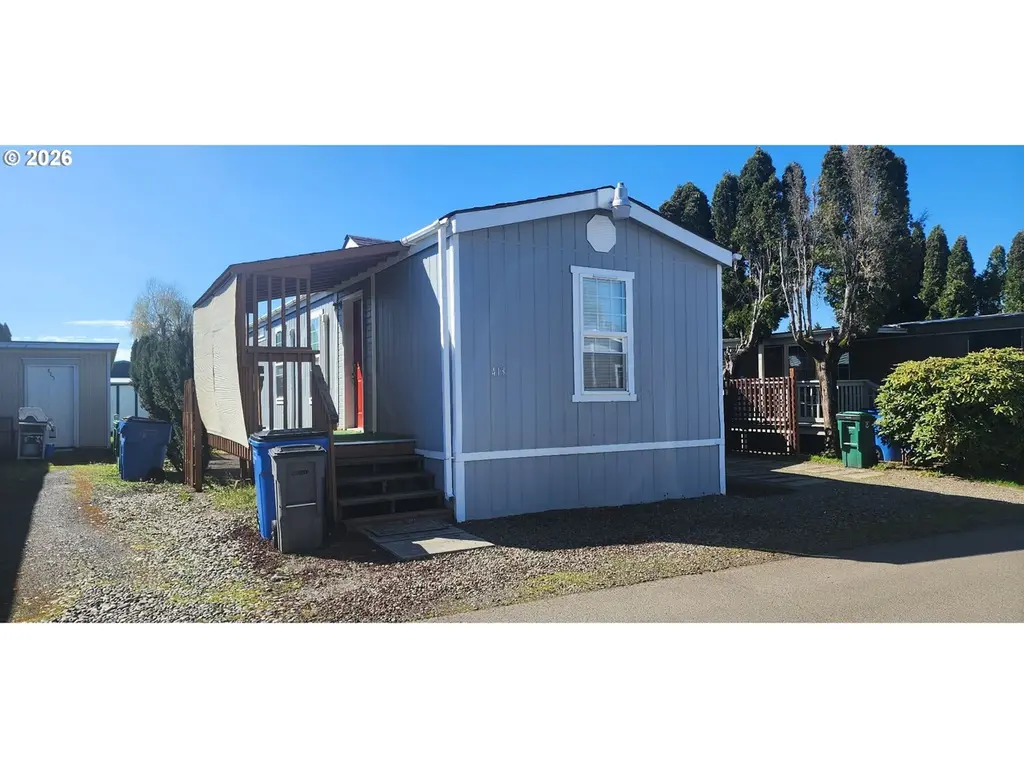
13401 NE 28th St #413 · Vancouver, WA
Flood risk No data
- FEMA flood zone
- —
- Chance of flooding over 30 yrs
- —
- Est. flood insurance / yr
- —
Fire risk No data
- Est. fire insurance / yr
- —
Heat risk No data
- Hot days now (above threshold)
- —
- Hot days in 30 yrs
- —
Wind risk No data
- Chance of severe wind over 30 yrs
- —
Air-quality risk No data
- Unhealthy air days now
- —
- Unhealthy air days in 30 yrs
- —
Risk factors via First Street. Map © Google.
Why this score? — see what drove the B grade
The composite is a weighted blend of 9 inputs, each scored 0–100. Each bar is that input's sub-score; the figure is the points it added to the 100-point composite (weight × sub-score).
- Cash flow +30.0/30.0
- 1% rule +10.0/10.0
- DSCR +10.0/10.0
- ARV discount +7.6/15.0
- Schools +4.3/10.0
- Livability +4.1/5.0
- Rent growth +2.7/5.0
- Condition / age +2.5/5.0
- Appreciation +0.0/10.0
$70,000
🖨 Deal sheet 📄 Offer letter ✓ Due diligence
Listing remarks MLS
This is a must see! Fully updated interior including new laminate flooring, tile floor in the bathroom and granite countertops. New roof 2018 and newer hot water tank. Exterior has a coverd carport. new shed, covered wood deck at the front door. There are 4 ductless heat pumps. Close to bus line.
Key facts
- Covered carport
- Covered wood deck
- Updated interior
Tags
Neighborhood map
What this means for you Summary
Snapshot
- This is a 2-bed/1.0-bath manufactured listed at $70k.
Deal economics
- At list price, monthly cash flow is $926 ($11k/yr) — positive.
- The deal already cash-flows at list — no discount required.
- Meets the 1% rule at list price ($2k rent vs $70k).
- Recommended offer: $68k (3.0% below list) — sets the bar for market timing.
- Cap rate 22.2% vs local median 2.7% in Vancouver — top-decile yield for the area; either an underpriced asset or a hidden risk that comps aren't pricing in. Stress-test before assuming the spread holds.
Location & tenants
- Location reads 82/100 on livability (#62 in WA, #1,133 nationally) — a professional / high-income tenant draw. Strengths: amenities A+, commute A+, housing A+; Watch: crime F, cost of living D-.
- Evergreen School District (Clark) (urban): math 41% / reading 51% proficiency, ranked #164 of 291 in WA (top 56%) — families likely to look elsewhere, expect single-tenant / working-renter base with shorter leases.
- Market conditions: Rents flat; 461 active listings in the ZIP; 18 comparable units currently listed for rent nearby; rentals leasing fast (median 3d on market — plan ~1-2 weeks tenant-placement turnaround); solid renter incomes; 3,547 units permitted in Clark County in 2024 (1,361 in 5+ unit buildings).
Forward outlook
- Local home prices are declining (-3.0%/yr); year-one equity from $484 of loan paydown is wiped out by about $2k of value loss. Plan a longer hold.
- Clark County population projected at +29% by 2050 — long-run rental-demand tailwind backs the buy-and-hold thesis.
- At projected returns (-3.0% appreciation + 0.6% rent growth), your $20k cash investment doubles in ~3 years — after that, you're playing with house money.
Negotiation context
- It's been on market 38 days — a 3% lower offer ($68k) is reasonable based on typical stale-listing flexibility.
- 2 sale attempts since 5y ago; this cycle's ask has dropped $10k (12%) from the opening price — seller is motivated, your offer sets the floor, not the list.
Questions for the listing agent
- It's been on market 38 days. Have you received any prior offers? Is the seller open to a 3% concession, seller financing, or rate buy-down credit?
- Is there a deadline driving the sale (1031 exchange, divorce, estate, relocation)? That informs how much negotiation room exists.
- Crime grade is F in this area — have there been break-ins, vandalism, or insurance claims at this property in the last 3 years? What carrier currently insures it and at what premium?
- What's the average days-on-market for RENTAL listings here right now (not sales)? A rising rental-DOM trend means longer vacancies and softer asking-rent achievability than the comps imply.
- What's the recent tenant-quality profile in this submarket — average credit score on applications, eviction rate, late-payment / NSF rate, and stable-employment percentage? A property-management company in the area should have these aggregated.
- How much new for-sale + rental construction is in the pipeline within 1–3 miles? Heavy new supply typically softens prices + rents 12–24 months out; constrained supply supports both.
Investment metrics
- 1% rule
- 2.44% ✓
- Cap rate
- 22.16%
- Cash-on-cash
- 56.67%
- DSCR
- 3.52
- GRM
- 3.4
CMA / ARV
- ARV (median comp)
- $70,143
- List price
- $70,000
- Delta
- -0.20%
- Verdict
- FAIR
- Comps
- 2 within 1.0 mi
Show comp detail 2 sales within ~0.75 mi
| Address | Dist | Beds/Ba | Sqft | Sold | Price | $/sf | Match |
|---|---|---|---|---|---|---|---|
| 13401 NE 28th St Unit 309-A | 0.00mi | 2/1.0 | 690 (+3%) | 20mo | $110,800 | $161 | 78 |
| 13401 NE 28th St #210 | 0.00mi | 2/1.0 | 720 (+7%) | 12mo | $70,000 | $97 | 78 |
Match score weights: distance 35% · size 25% · config 20% · recency 20%. Top-matched comps best support the ARV.
Projected returns pro-forma
-3.0% appreciation · 0.63% rent growth · sell at horizon
- IRR
- 52.5%
- Equity multiple
- 3.23×
- Total profit
- $43,612
- Equity at exit
- $10,437
- IRR
- 56.8%
- Equity multiple
- 6.01×
- Total profit
- $98,254
- Equity at exit
- $6,052
Cash invested: $19,600 (down + closing). Projections, not guarantees.
Landlord ↔ Tenant lean methodology
- Overall (STATE)
- 28 Tenant-Leaning
- State Washington
- 28 Tenant-Leaning · D+8
- County
- — inherits STATE
- City
- — inherits STATE
ZIP-level market 98682
- Rents YoY
- 0.6%
- Active inventory
- 461
- Price-to-rent
- 3.4×
Monthly cashflow live
- Estimated rent
- $1,710 high interval (Pro) →
- Mortgage (P&I)
- −$367
- Tax from tax record
- −$29 /mo · $349/yr
- Insurance
- −$29
- HOA
- −$0
- Vacancy / Maint / Mgmt
- −$359
- Net cashflow
- $926
Break-even live
UW: 25.0% down · 7.5% · 30yr · 1.5% tax · 5.0% vac · 8.0% maint · 8.0% mgmt
Financing live
Cash to close
- Down payment
- $17,500
- Closing costs
- $2,100
- Reserves months
- —
- Total cash needed
- —
Loan-product check · same deal, 3 products live
Conventional
25% down · 7.5% · 30yr
- Down + closing
- —
- Monthly P&I
- —
- Monthly cashflow
- —
- DSCR
- —
- Eligible?
- —
Personal DTI + credit; lowest rate.
DSCR
20% down · 8.5% · 30yr
- Down + closing
- —
- Monthly P&I
- —
- Monthly cashflow
- —
- DSCR
- —
- Eligible?
- —
No personal income docs; deal must DSCR.
Hard money
10% down · 12.0% · 12mo
- Down + closing
- —
- Monthly P&I
- —
- Monthly cashflow
- —
- DSCR
- —
- Eligible?
- —
Short-term bridge; refi at stabilization.
Rent comps 18 comps
| Address | Beds | Baths | Sqft | Rent | $/sqft | DOM | Units | Dist |
|---|---|---|---|---|---|---|---|---|
| 13609 NE 28th St Vancouver, WA | 2.0 | 1.0 | 750 | $1,400 | $1.87 | 43d | 1 | 0.20mi |
| 12901 NE 28th St Vancouver, WA | 1.0–2.0 | 1.0 | 824 | $1,934 | $2.35 | 1d | 10 | 0.21mi |
| 12101 NE 28th St Vancouver, WA | 1.0–2.0 | 1.0–2.0 | 806 | $2,086 | $2.59 | 2d | 13 | 0.59mi |
| 1330 NE 136th Ave Vancouver, WA | 1.0–3.0 | 1.0–2.0 | 1016 | $2,015 | $1.98 | 2d | 15 | 0.59mi |
| 2201 NE 112th Ave Vancouver, WA | 1.0 | 1.0 | 713 | $1,575 | $2.21 | 12d | 1 | 1.02mi |
| 2201 NE 112th Ave Vancouver, WA | 1.0 | 1.0 | 713 | $1,565 | $2.19 | 43d | 1 | 1.02mi |
| 2201 NE 112th Ave Vancouver, WA | 1.0–3.0 | 1.0–2.0 | 935 | $1,846 | $1.97 | 4d | 1 | 1.02mi |
| 1900 NE 113th Ct Vancouver, WA | 1.0–2.0 | 1.0–2.0 | 887 | $1,777 | $2.00 | 1d | 6 | 1.04mi |
| 2400 NE 112th Ave Vancouver, WA | 1.0–2.0 | 1.0 | 435 | $1,395 | $3.20 | 14d | 6 | 1.08mi |
| 1618 NE 112th Ave Vancouver, WA | 1.0 | 1.0 | 588 | $1,504 | $2.56 | 2d | 3 | 1.20mi |
| 4905 NE 122nd Ave Vancouver, WA | 1.0 | 1.0 | 684 | $1,500 | $2.19 | 7d | 1 | 1.25mi |
| 333 NE 136th Ave Vancouver, WA | 1.0 | 1.0 | 684 | $1,650 | $2.41 | 2d | 2 | 1.28mi |
| 3708 NE 109th Ave Vancouver, WA | 1.0–3.0 | 1.0–2.0 | 899 | $1,779 | $1.98 | 2d | 30 | 1.37mi |
| 11716 NE 49th St Vancouver, WA | 1.0–3.0 | 1.0–2.5 | 1090 | $1,788 | $1.64 | 7d | 15 | 1.43mi |
| 4000 NE 109th Ave Vancouver, WA | 1.0–2.0 | 1.0–2.5 | 780 | $1,950 | $2.50 | 2d | 2 | 1.43mi |
| 10415 NE Oakbrook Cir Vancouver, WA | 1.0–2.0 | 1.0–1.5 | 764 | $1,583 | $2.07 | 2d | 6 | 1.44mi |
| 11301 NE 7th St Vancouver, WA | 3.0 | 1.0–2.0 | 840 | $1,867 | $2.22 | 1d | 43 | 1.47mi |
| 11412 NE 49th St Vancouver, WA | 1.0–2.0 | 1.0–2.0 | 810 | $1,730 | $2.14 | 1d | 6 | 1.49mi |
Listing history 6 events
-
2026-05-12status Pending 298-char remark
Show marketing remark (298 chars)
This is a must see! Fully updated interior including new laminate flooring, tile floor in the bathroom and granite countertops. New roof 2018 and newer hot water tank. Exterior has a coverd carport. new shed, covered wood deck at the front door. There are 4 ductless heat pumps. Close to bus line.
-
2026-04-16price $70,000 298-char remark
Show marketing remark (298 chars)
This is a must see! Fully updated interior including new laminate flooring, tile floor in the bathroom and granite countertops. New roof 2018 and newer hot water tank. Exterior has a coverd carport. new shed, covered wood deck at the front door. There are 4 ductless heat pumps. Close to bus line.
-
2026-04-04$80,000 Active 298-char remark
Show marketing remark (298 chars)
This is a must see! Fully updated interior including new laminate flooring, tile floor in the bathroom and granite countertops. New roof 2018 and newer hot water tank. Exterior has a coverd carport. new shed, covered wood deck at the front door. There are 4 ductless heat pumps. Close to bus line.
-
2021-07-07soldstatus $67,000 Sold 422-char remark
Show marketing remark (422 chars)
A must see home! Brand new kitchen cabinets, granite countertops, new paint inside and out, roof was replaced in 2018, beatiful new laminated flooring throughout the house, fully renovated bathroom with tile floor, vaulted ceilings, new hot water tank. Proximity to line bus 30 & 80, hwy I-205, shopping areas. Enough space to park 3 cars. Space rent covers sewer, garbage & water. This Home Is Ready To Be Yours!
-
2021-06-15status Pending 422-char remark
Show marketing remark (422 chars)
A must see home! Brand new kitchen cabinets, granite countertops, new paint inside and out, roof was replaced in 2018, beatiful new laminated flooring throughout the house, fully renovated bathroom with tile floor, vaulted ceilings, new hot water tank. Proximity to line bus 30 & 80, hwy I-205, shopping areas. Enough space to park 3 cars. Space rent covers sewer, garbage & water. This Home Is Ready To Be Yours!
-
2021-06-02$67,000 Active 422-char remark
Show marketing remark (422 chars)
A must see home! Brand new kitchen cabinets, granite countertops, new paint inside and out, roof was replaced in 2018, beatiful new laminated flooring throughout the house, fully renovated bathroom with tile floor, vaulted ceilings, new hot water tank. Proximity to line bus 30 & 80, hwy I-205, shopping areas. Enough space to park 3 cars. Space rent covers sewer, garbage & water. This Home Is Ready To Be Yours!
ⓘ Source: listings_history table (triggers on properties + properties_extension) + one-shot
backfill from property_details.listing_events for pre-trigger history.
Tax reassessment forecast WA · Resets to sale price
- Current annual tax
- $349 · $29/mo
- Projected year-2 tax
- $686 · $57/mo
- Expected delta
- +$337/yr (+$28/mo · 96.7%)
ⓘ Screening estimate from a state-policy table — verify with the county assessor before closing.
Nearby sold comps map
Loading sold comps map…
Walkable amenities ~0.75 mi
Loading nearby amenities…
Taxation est. · year 1
- Rental income
- $20,519
- − Mortgage interest
- −$3,921
- − Property taxes
- −$349
- − Insurance
- −$350
- − Repairs & maintenance
- −$1,642
- − Management
- −$1,642
- − Depreciation
- −$2,036
- Taxable income
- $10,580
- Est. tax owed @ 24.0%
- −$2,539
- After-tax cash flow
- $8,567/yr
For passive investors: Depreciation is non-cash, so a rental often shows a tax loss while cash-flowing — sheltering income. Rental losses are passive: they offset passive income freely, and up to $25,000/yr can offset ordinary (W-2) income if you actively participate and your MAGI is under $100k (phasing out to $0 by $150k); unused losses carry forward. On sale, claimed depreciation is recaptured at up to 25%, and gains may owe capital-gains tax (a 1031 exchange can defer both). Figures are a year-1 estimate at your 24.0% rate — not tax advice; consult a CPA.
Schools (NCES district)
- District
- Evergreen School District (Clark)
- NCES district ID
- 5302700
- Math proficiency
- 41% ▼ -3.00%
- Reading proficiency
- 51% ▼ -3.00%
- Median HH income
- $59,418
- Composite
- 42.53/100
- National rank
- #6859
- State rank
- #164 of 291 in WA
Livability — Vancouver
- Score
- 82/100
- State rank
- #62
- US rank
- #1133
Category grades
Schools grade is shown separately in the Schools card above.
Census & demographics
- Census place
- Vancouver, WA
- County
- Clark County · 513,189 people
- City population
- 360,195
- Metro
- Portland-Vancouver-Hillsboro, OR-WA
- Population (ZIP)
- 68,305
- Household income
- $99,918
- Rent vs Own
- Severe rent burden
- 1618.0
Population outlook (Clark County) Hauer SSP2
- Today (2025)
- 529,610 people
- By 2030
- 563,242 · +6.4%
- By 2040
- 625,905 · +18.2%
- By 2050
- 681,558 · +28.7%
- By 2075
- 805,967 · +52.2%
- By 2100
- 877,450 · +65.7%
Race, ethnicity, and origin ACS 2023
- Neighborhood character
- Predominantly White (69%)
- Race & ethnicity
- White 69% Hispanic / Latino 15% Two or more races 13% Asian 6% Black 2% Pacific Islander 1%
- Hispanic origin (detail)
- Mexican 12%
- Common ancestry
- Portuguese 3% Subsaharan African 3% Scotch-Irish 2%
- Foreign-born
- 13% · Canada, Vietnam, South Korea
- Languages at home
- 79% English-only · Spanish 8% Russian/Polish/Slavic 6% Other Asian/Pacific 2%
Political lean MEDSL · Clark
- 2024 margin
- Lean D (+7.0) · D 52.1% · R 45.1% · Other 2.8%
- 2008→2024 swing
- +0.9pp no change · 2008: 6.1pp · 2024: 7.0pp
- All cycles
- 2024: D+7.0 2020: D+5.1 2016: D+0.1 2012: D+0.1 2008: D+6.1
Not yet ingested
- Civics
- —
Market trends
- HPI YoY
- ▼ -303.95%
- Current HPI
- 307.0529
- Rent YoY
- ▲ 0.63%
- Metro
- Portland-Vancouver-Hillsboro, OR-WA
- State GDP YoY
- ▲ 4.65%
- F500 in state
- 22
Industry mix (Fortune 500 HQ in WA)
| Industry | F500 HQs | Revenue |
|---|---|---|
| Retail | 2 | $269B |
|
||
| Technology / Retail | 1 | $638B |
|
||
| Technology | 1 | $245B |
|
||
| Telecommunications | 1 | $38B |
|
||
| Food / Beverage | 1 | $36B |
|
||
| Automotive / Trucks | 1 | $34B |
|
||
Price history
+4.5% since first listed6 events — show timeline
- 2026-05-12 Pending — RMLS
- 2026-04-16 Price Changed $70,000 RMLS
- 2026-04-04 Listed $80,000 RMLS
- 2021-07-07 Sold (MLS) $67,000 RMLS
- 2021-06-15 Pending — RMLS
- 2021-06-02 Listed $67,000 RMLS
Property tax history
+4.4%/yrLatest (2026): $349 · +200.1% YoY. Source: county tax records.
Cash-flow waterfall
monthlySold comps — $/sqft
last 12 mo · ≤1 miLoading sold comps…