 Duplex
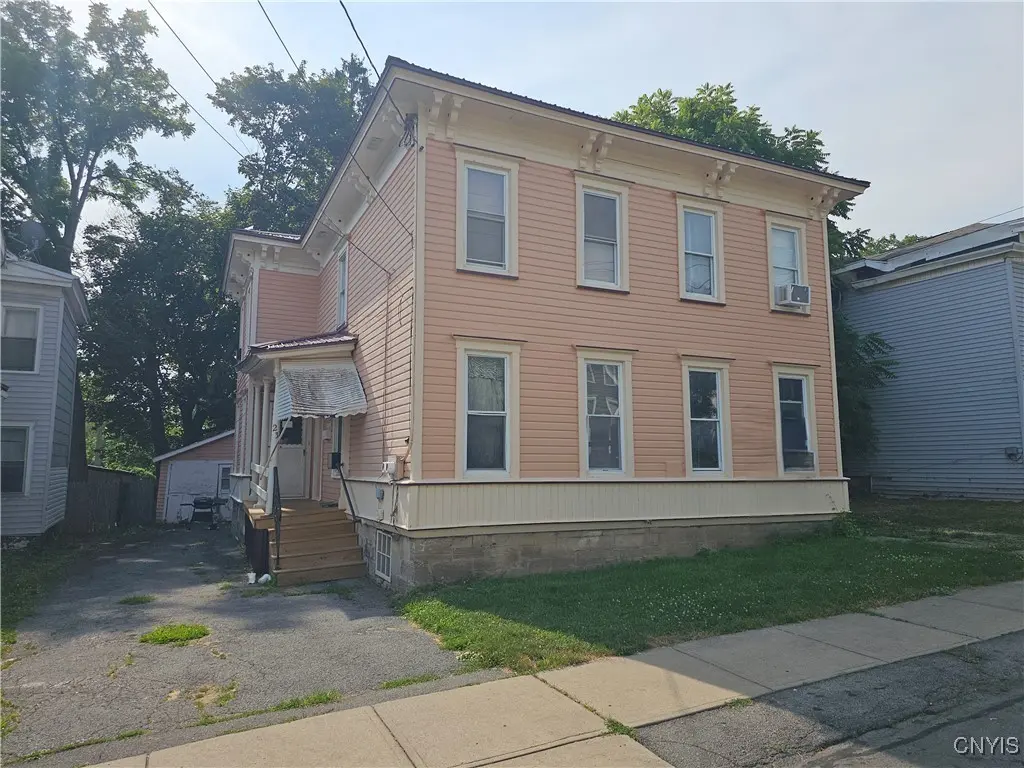
21-23 Derby Ave · Auburn, NY
Flood risk 1/10 · Minimal
- FEMA flood zone
- X (unshaded)
- Chance of flooding over 30 yrs
- 0.0%
- Est. flood insurance / yr
- $473 – $860
Fire risk 1/10 · Minimal
- Est. fire insurance / yr
- $691 – $1,283
Heat risk 2/10 · Minimal
- Hot days now (above 96°F)
- 7 days/yr
- Hot days in 30 yrs
- 15 days/yr
Wind risk 1/10 · Minimal
- Chance of severe wind over 30 yrs
- 1.0%
Air-quality risk 2/10 · Minimal
- Unhealthy air days now
- 0 days/yr
- Unhealthy air days in 30 yrs
- 1 days/yr
Risk factors via First Street. Map © Google.
Why this score? — see what drove the B grade
The composite is a weighted blend of 9 inputs, each scored 0–100. Each bar is that input's sub-score; the figure is the points it added to the 100-point composite (weight × sub-score).
- Cash flow +30.0/30.0
- ARV discount +11.4/15.0
- 1% rule +10.0/10.0
- DSCR +10.0/10.0
- Livability +3.7/5.0
- Schools +3.0/10.0
- Rent growth +2.5/5.0
- Condition / age +2.5/5.0
- Appreciation +0.0/10.0
$137,400
🖨 Deal sheet 📄 Offer letter ✓ Due diligence
Multi-family units
County records classify this as Multi-Family (2-4 Unit). Listing-text estimate: 2 units. confirmed
Listing remarks MLS
Located on a quiet private street, this solidly built two-family side-by-side home offers a fantastic opportunity for owner-occupants or investors alike. Each spacious unit features 3 bedrooms and 1 full bathroom as well as providing comfortable living with thoughtful updates and enduring quality. Recent improvements include updated hall and bathroom flooring, a refreshed front porch, a new suspended ceiling, and fresh paint both inside and out. The home's well-crafted construction and durable metal roof are standout features that ensure long-term value. Whether you're looking to live in one unit and rent the other, or expand your investment portfolio, this property offers flexibility, functionality, and peace of mind in a quiet, desirable setting. New certificate of occupancy issued Nune 2025
Key facts
- Private street
- Fresh paint inside
- 5,227 sq ft lot
Tags
Neighborhood map
What this means for you Summary
Snapshot
- This is a 2 × 3-bed/1.0-bath units multifamily listed at $137k.
Deal economics
- At list price, monthly cash flow is $2k ($23k/yr) — positive. Per door: $966/mo.
- The deal already cash-flows at list — no discount required.
- Meets the 1% rule at list price ($4k rent vs $137k).
- Recommended offer: $121k (12.0% below list) — sets the bar for market timing.
- Cap rate 23.2% vs local median 7.6% in Auburn — top-decile yield for the area; either an underpriced asset or a hidden risk that comps aren't pricing in. Stress-test before assuming the spread holds.
Location & tenants
- Location reads 74/100 on livability (#298 in NY, #4,814 nationally) — a middle-class / working-renter tenant base. Strengths: cost of living A+, housing A+, health & safety A+; Watch: schools D, amenities D-, commute F.
- Auburn City School District (town): math 31% / reading 39% proficiency, ranked #558 of 590 in NY (top 95%) — families likely to look elsewhere, expect single-tenant / working-renter base with shorter leases.
- Market conditions: 221 active listings in the ZIP; 161 units permitted in Cayuga County in 2024 (65 in 5+ unit buildings).
- At $3,621/mo this rent would consume 72% of the median local household income ($61k/yr) (locally 1449% of renters already pay >50% of income on rent) — very limited rent-growth headroom before tenants either downsize or default.
Forward outlook
- Local home prices are declining (-3.0%/yr); year-one equity from $950 of loan paydown is wiped out by about $4k of value loss. Plan a longer hold.
- Cayuga County population projected at -18% by 2050 — secular population decline; favor cash flow + early exit over multi-decade hold.
- At projected returns (-3.0% appreciation + 3.0% rent growth), your $38k cash investment doubles in ~2 years — after that, you're playing with house money.
Negotiation context
- It's been on market 324 days — a 12% lower offer ($121k) is reasonable based on typical stale-listing flexibility.
- 3 sale attempts since 3y ago with the ask held roughly flat each time — persistent listings suggest the price (not the market) is what's stuck; bring a comps-based counter.
Risks & watch-outs
- Watch-outs: built in 1890 — expect roof / HVAC / electrical / plumbing capex.
Questions for the listing agent
- It's been on market 324 days. Have you received any prior offers? Is the seller open to a 12% concession, seller financing, or rate buy-down credit?
- Can we see the unit-by-unit rent roll, current vacancy, and any below-market leases? What's the average tenancy length?
- What capital expenditures (roof, boiler, parking lot, exteriors) have been made in the last 5 years, and what's planned in the next 2?
- Built in 1890 — when were the roof, HVAC, electrical panel, plumbing, and water heater last replaced?
- Why hasn't it sold? Are there any deal-killer items the seller is aware of (foundation, flood, title, zoning, code violations)?
- Is there a deadline driving the sale (1031 exchange, divorce, estate, relocation)? That informs how much negotiation room exists.
- Schools are D-rated, which usually means shorter tenancies and higher turnover. Who's the typical renter profile here, and what's been the actual vacancy rate?
- What's the average days-on-market for RENTAL listings here right now (not sales)? A rising rental-DOM trend means longer vacancies and softer asking-rent achievability than the comps imply.
- What's the recent tenant-quality profile in this submarket — average credit score on applications, eviction rate, late-payment / NSF rate, and stable-employment percentage? A property-management company in the area should have these aggregated.
- How much new apartment / multifamily construction is in the pipeline within 1–3 miles? Heavy new supply (>2% of stock underway) typically softens rents 12–24 months out; light construction supports rent growth.
Investment metrics
- 1% rule
- 2.64% ✓
- Cap rate
- 23.17%
- Cash-on-cash
- 60.27%
- DSCR
- 3.68
- GRM
- 3.2
CMA / ARV
- ARV (median comp)
- $150,349
- List price
- $137,400
- Delta
- -8.61%
- Verdict
- FAIR
- Comps
- 20 within 1.0 mi
Show comp detail 12 sales within ~0.75 mi
| Address | Dist | Beds/Ba | Sqft | Sold | Price | $/sf | Match |
|---|---|---|---|---|---|---|---|
| 9-11 Aurelius Ave | 0.24mi | 6/2.0 | 2,336 (-5%) | 1mo | $60,000 | $26 | 80 |
| 47 West St | 0.10mi | 5/2.0 (-1) | 2,304 (-6%) | 2mo | $80,000 | $35 | 78 |
| 7 Barber St | 0.21mi | 6/2.0 | 2,560 (+4%) | 7mo | $24,010 | $9 | 77 |
| 110 Cottage St | 0.48mi | 6/2.0 | 2,374 (-3%) | 8mo | $90,000 | $38 | 65 |
| 110 Wall St | 0.11mi | 5/2.5 (-1) | 2,586 (+6%) | 20mo | $100,000 | $39 | 62 |
| 31 Washington St | 0.41mi | 5/3.0 (-1) | 2,518 (+3%) | 10mo | $132,500 | $53 | 60 |
| 81 Orchard St | 0.32mi | 6/2.0 | 2,102 (-14%) | 2mo | $110,000 | $52 | 59 |
| 100-102 N Division St | 0.42mi | 6/2.0 | 2,648 (+8%) | 14mo | $156,000 | $59 | 56 |
| 101 Cottage St #99 | 0.51mi | 6/2.0 | 2,602 (+6%) | 17mo | $149,900 | $58 | 52 |
| 15 Garrow St | 0.72mi | 5/2.0 (-1) | 2,497 (+2%) | 12mo | $148,000 | $59 | 48 |
| 11 Barber St | 0.21mi | 5/2.0 (-1) | 2,147 (-12%) | 21mo | $98,300 | $46 | 47 |
| 144 Cottage St | 0.35mi | 5/3.5 (-1) | 2,604 (+6%) | 19mo | $142,500 | $55 | 47 |
Match score weights: distance 35% · size 25% · config 20% · recency 20%. Top-matched comps best support the ARV.
Projected returns pro-forma
-3.0% appreciation · 3.0% rent growth · sell at horizon
- IRR
- 59.0%
- Equity multiple
- 3.62×
- Total profit
- $100,850
- Equity at exit
- $20,487
- IRR
- 63.8%
- Equity multiple
- 7.41×
- Total profit
- $246,464
- Equity at exit
- $11,880
Cash invested: $38,472 (down + closing). Projections, not guarantees.
Landlord ↔ Tenant lean methodology
- Overall (STATE)
- 15 Strongly Tenant-Friendly
- State New York
- 15 Strongly Tenant-Friendly · D+10
- County
- — inherits STATE
- City
- — inherits STATE
ZIP-level market 13021
- Home prices YoY
- -22.4%
- Active inventory
- 221
- Price-to-rent
- 6.3×
Monthly cashflow live
- Estimated rent
- $3,621 medium interval (Pro) →
- Mortgage (P&I)
- −$721
- Tax from tax record
- −$150 /mo · $1,805/yr
- Insurance
- −$57
- HOA
- −$0
- Vacancy / Maint / Mgmt
- −$760
- Net cashflow
- $1,932
Break-even live
2-unit breakdown (identical units grouped — click to expand)
| Units | Beds | Baths | Est. rent |
|---|---|---|---|
| 2× units | 3 | 1 | $3,620 |
| #1 | 3 | 1 | $1,810 |
| #2 | 3 | 1 | $1,810 |
| Total (2 units) | $3,621 | ||
UW: 25.0% down · 7.5% · 30yr · 1.5% tax · 5.0% vac · 8.0% maint · 8.0% mgmt
Financing live
Cash to close
- Down payment
- $34,350
- Closing costs
- $4,122
- Reserves months
- —
- Total cash needed
- —
Loan-product check · same deal, 3 products live
Conventional
25% down · 7.5% · 30yr
- Down + closing
- —
- Monthly P&I
- —
- Monthly cashflow
- —
- DSCR
- —
- Eligible?
- —
Personal DTI + credit; lowest rate.
DSCR
20% down · 8.5% · 30yr
- Down + closing
- —
- Monthly P&I
- —
- Monthly cashflow
- —
- DSCR
- —
- Eligible?
- —
No personal income docs; deal must DSCR.
Hard money
10% down · 12.0% · 12mo
- Down + closing
- —
- Monthly P&I
- —
- Monthly cashflow
- —
- DSCR
- —
- Eligible?
- —
Short-term bridge; refi at stabilization.
Listing history 26 events
-
2026-06-19days on market $137,400 Active 324 DOM
-
2026-06-18days on market $137,400 Active 323 DOM
-
2026-06-17days on market $137,400 Active 322 DOM
-
2026-06-16days on market $137,400 Active 321 DOM
-
2026-06-15days on market $137,400 Active 320 DOM
-
2026-06-14days on market $137,400 Active 318 DOM
-
2026-06-12days on market $137,400 Active 317 DOM
-
2026-06-09days on market $137,400 Active 314 DOM
-
2026-06-08days on market $137,400 Active 313 DOM
-
2026-06-07days on market $137,400 Active 312 DOM
-
2026-06-05days on market $137,400 Active 309 DOM
-
2026-06-03days on market $137,400 Active 308 DOM
-
2026-06-02days on market $137,400 Active 307 DOM
-
2026-06-01days on market $137,400 Active 306 DOM
-
2026-05-31days on market $137,400 Active 305 DOM
-
2026-05-30days on market $137,400 Active 304 DOM
-
2025-10-29price $137,400 804-char remark
Show marketing remark (804 chars)
Located on a quiet private street, this solidly built two-family side-by-side home offers a fantastic opportunity for owner-occupants or investors alike. Each spacious unit features 3 bedrooms and 1 full bathroom as well as providing comfortable living with thoughtful updates and enduring quality. Recent improvements include updated hall and bathroom flooring, a refreshed front porch, a new suspended ceiling, and fresh paint both inside and out. The home's well-crafted construction and durable metal roof are standout features that ensure long-term value. Whether you're looking to live in one unit and rent the other, or expand your investment portfolio, this property offers flexibility, functionality, and peace of mind in a quiet, desirable setting. New certificate of occupancy issued Nune 2025
-
2025-07-30$139,900 Active 804-char remark
Show marketing remark (804 chars)
Located on a quiet private street, this solidly built two-family side-by-side home offers a fantastic opportunity for owner-occupants or investors alike. Each spacious unit features 3 bedrooms and 1 full bathroom as well as providing comfortable living with thoughtful updates and enduring quality. Recent improvements include updated hall and bathroom flooring, a refreshed front porch, a new suspended ceiling, and fresh paint both inside and out. The home's well-crafted construction and durable metal roof are standout features that ensure long-term value. Whether you're looking to live in one unit and rent the other, or expand your investment portfolio, this property offers flexibility, functionality, and peace of mind in a quiet, desirable setting. New certificate of occupancy issued Nune 2025
-
2024-01-26historical
-
2023-11-30price $97,000
-
2023-09-15status Active
-
2023-08-02status Under Contract- Do Not Show
-
2023-07-26$98,000 Active
-
2005-04-29soldstatus $125,100
-
2002-10-03soldstatus $57,725
-
2002-07-24soldstatus $57,725
ⓘ Source: listings_history table (triggers on properties + properties_extension) + one-shot
backfill from property_details.listing_events for pre-trigger history.
Tax reassessment forecast NY · Partial reset (capped growth)
- Current annual tax
- $1,805 · $150/mo
- Projected year-2 tax
- $2,064 · $172/mo
- Expected delta
- +$258/yr (+$22/mo · 14.3%)
ⓘ Screening estimate from a state-policy table — verify with the county assessor before closing.
Climate risk First Street
- Flood 1/10 Low FEMA zone X (unshaded) · 0% chance over 30 yrs
- Wildfire 1/10 Low
- Heat 2/10 Low 7 d/yr ≥96°F today · 15 d/yr by 30 yrs out
- Wind 1/10 Low 100% chance of damaging wind over 30 yrs
- Air quality 2/10 Low 0 unhealthy d/yr today · 1 by 30 yrs out
Nearby sold comps map
Loading sold comps map…
Walkable amenities ~0.75 mi
Loading nearby amenities…
Taxation est. · year 1
- Rental income
- $43,452
- − Mortgage interest
- −$7,697
- − Property taxes
- −$1,805
- − Insurance
- −$687
- − Repairs & maintenance
- −$3,476
- − Management
- −$3,476
- − Depreciation
- −$3,997
- Taxable income
- $22,314
- Est. tax owed @ 24.0%
- −$5,355
- After-tax cash flow
- $17,833/yr
For passive investors: Depreciation is non-cash, so a rental often shows a tax loss while cash-flowing — sheltering income. Rental losses are passive: they offset passive income freely, and up to $25,000/yr can offset ordinary (W-2) income if you actively participate and your MAGI is under $100k (phasing out to $0 by $150k); unused losses carry forward. On sale, claimed depreciation is recaptured at up to 25%, and gains may owe capital-gains tax (a 1031 exchange can defer both). Figures are a year-1 estimate at your 24.0% rate — not tax advice; consult a CPA.
Schools (NCES district)
- District
- Auburn City School District
- NCES district ID
- 3603480
- Math proficiency
- 31% ▼ -17.00%
- Reading proficiency
- 39% ▲ 2.00%
- Median HH income
- $43,567
- Composite
- 29.71/100
- National rank
- #6452
- State rank
- #558 of 590 in NY
Livability — Auburn
- Score
- 74/100
- State rank
- #298
- US rank
- #4814
Category grades
Schools grade is shown separately in the Schools card above.
Census & demographics
- Census place
- Auburn, NY
- County
- Cayuga County · 37,247 people
- City population
- 37,247
- Metro
- Auburn, NY
- Population (ZIP)
- 37,247
- Household income
- $60,712
- Rent vs Own
- Severe rent burden
- 1449.0
Population outlook (Cayuga County) Hauer SSP2
- Today (2025)
- 74,820 people
- By 2030
- 72,402 · -3.2%
- By 2040
- 66,917 · -10.6%
- By 2050
- 61,007 · -18.5%
- By 2075
- 48,047 · -35.8%
- By 2100
- 34,512 · -53.9%
Race, ethnicity, and origin ACS 2023
- Neighborhood character
- Predominantly White (87%)
- Race & ethnicity
- White 87% Two or more races 7% Black 3% Hispanic / Latino 3%
- Common ancestry
- Romanian 8% Subsaharan African 3% Lithuanian 2%
- Foreign-born
- 2% · Canada
- Languages at home
- 95% English-only · Spanish 2% Other Indo-European 1% German/W. Germanic 1%
Political lean MEDSL · Cayuga
- 2024 margin
- R (+13.0) · D 43.5% · R 56.5%
- 2008→2024 swing
- -21.5pp toward R · 2008: 8.5pp · 2024: -13.0pp
- All cycles
- 2024: R+13.0 2020: R+9.2 2016: R+13.2 2012: D+10.8 2008: D+8.5
Not yet ingested
- Civics
- —
Market trends
- HPI YoY
- ▼ -97.53%
- Current HPI
- 338.5537
- Rent YoY
- —
- Metro
- Auburn, NY
- State GDP YoY
- ▲ 2.60%
- F500 in state
- 92
Industry mix (Fortune 500 HQ in NY)
| Industry | F500 HQs | Revenue |
|---|---|---|
| Financial Services | 10 | $950B |
|
||
| Consumer Goods | 9 | $162B |
|
||
| Insurance | 4 | $225B |
|
||
| Telecommunications | 2 | $144B |
|
||
| Pharmaceuticals | 2 | $112B |
|
||
| Media / Entertainment | 2 | $69B |
|
||
Price history
+138.0% since first listed10 events — show timeline
- 2025-10-29 Price Changed $137,400 CNYIS
- 2025-07-30 Listed $139,900 CNYIS
- 2024-01-26 Listing Removed — CNYIS
- 2023-11-30 Price Changed $97,000 CNYIS
- 2023-09-15 Relisted — CNYIS
- 2023-08-02 Pending — CNYIS
- 2023-07-26 Listed $98,000 CNYIS
- 2005-04-29 Sold (Public Records) $125,100 Public Records
- 2002-10-03 Sold (Public Records) $57,725 Public Records
- 2002-07-24 Sold (Public Records) $57,725 Public Records
Property tax history
-2.3%/yrLatest (2025): $1,805 · +10.8% YoY. Source: county tax records.
Cash-flow waterfall
monthlySold comps — $/sqft
last 12 mo · ≤1 miLoading sold comps…