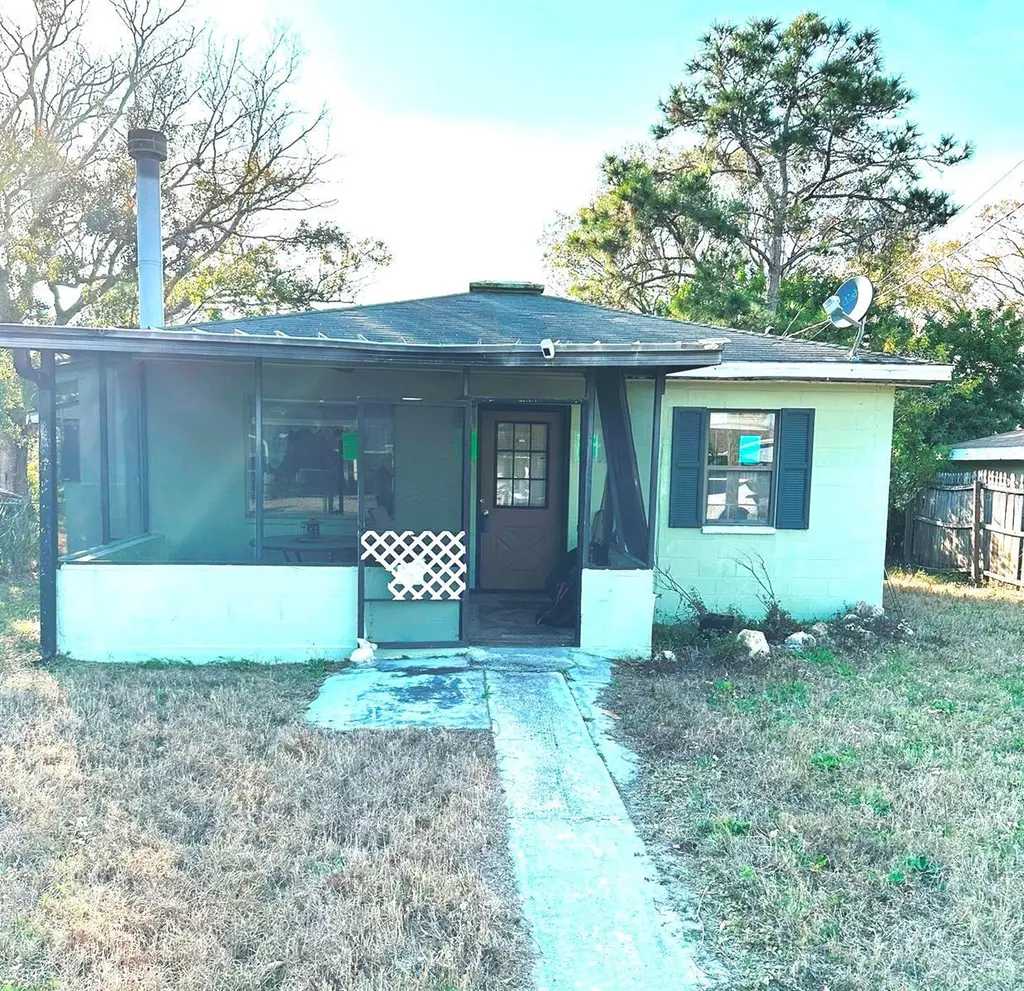
6703 S Faul St · Tampa, FL
Flood risk 10/10 · Severe
- FEMA flood zone
- AE
- Chance of flooding over 30 yrs
- 0.99%
- Est. flood insurance / yr
- $1,737 – $8,500
Fire risk 2/10 · Minimal
- Est. fire insurance / yr
- $947 – $1,759
Heat risk 10/10 · Severe
- Hot days now (above 107°F)
- 7 days/yr
- Hot days in 30 yrs
- 30 days/yr
Wind risk 10/10 · Severe
- Chance of severe wind over 30 yrs
- 99.0%
Air-quality risk 4/10 · Minor
- Unhealthy air days now
- 4 days/yr
- Unhealthy air days in 30 yrs
- 4 days/yr
Risk factors via First Street. Map © Google.
Why this score? — see what drove the B- grade
The composite is a weighted blend of 9 inputs, each scored 0–100. Each bar is that input's sub-score; the figure is the points it added to the 100-point composite (weight × sub-score).
- Cash flow +30.0/30.0
- DSCR +10.0/10.0
- 1% rule +8.5/10.0
- ARV discount +7.5/15.0
- Schools +4.2/10.0
- Livability +4.0/5.0
- Condition / age +2.5/5.0
- Rent growth +1.8/5.0
- Appreciation +0.0/10.0
$160,000
🖨 Deal sheet 📄 Offer letter ✓ Due diligence
Listing remarks MLS
Highest and Best offer by May 5, 2026 at 5 PM. PRIME SOUTH TAMPA LOCATION++++Build Your South Tampa Dream Home, +++CONCRETE BLOCK HOUSE On The property Was Damaged In The Hurricane++++PRICED based on Value In The Structure For Rehab Or The Lot For New Construction+++Screened In Patio Front Porch++Call Today And Get The Ball Rolling On Your New Construction Project! +++Investors!++++ Seize The Opportunity To Own A Piece Of South Tampa In A Rapidly Growing Residential Neighborhood With Many New Builds+++ One Of Tampa's Oldest Neighborhoods+++Easy Access To Major Highways, Shopping, Dining, Top-Rated Schools, And Macdill Air Force Base+++MAKE IT YOURS, CALL TODAY BEFORE IT’S GONE.
Key facts
- Concrete block house
- South tampa location
- Top rated schools
Tags
Neighborhood map
What this means for you Summary
Snapshot
- This is a 2-bed/1.0-bath single-family listed at $160k.
Deal economics
- At list price, monthly cash flow is $319 ($4k/yr) — positive.
- The deal already cash-flows at list — no discount required.
- Meets the 1% rule at list price ($2k rent vs $160k).
- Recommended offer: $146k (9.0% below list) — sets the bar for market timing.
Location & tenants
- Location reads 79/100 on livability (#142 in FL, #2,135 nationally) — a middle-class / working-renter tenant base. Strengths: commute A+, housing A+, health & safety A+; Watch: schools C-, crime D+.
- Hillsborough (suburban): math 47% / reading 50% proficiency, ranked #41 of 73 in FL (top 56%) — families likely to look elsewhere, expect single-tenant / working-renter base with shorter leases.
- Market conditions: Rents soft (-2.9%/yr); 189 active listings in the ZIP; 40 comparable units currently listed for rent nearby; rentals at typical pace (median 18d on market — plan ~3-4 weeks tenant-placement turnaround); solid renter incomes; 9,053 units permitted in Hillsborough County in 2024 (4,555 in 5+ unit buildings).
Forward outlook
- Local home prices are declining (-3.0%/yr); year-one equity from $1k of loan paydown is wiped out by about $5k of value loss. Plan a longer hold.
- Hillsborough County population projected at +37% by 2050 — long-run rental-demand tailwind backs the buy-and-hold thesis.
Negotiation context
- It's been on market 100 days — a 9% lower offer ($146k) is reasonable based on typical stale-listing flexibility.
- Current owner paid $25k; list at $160k implies a 540% gain — meaningful room to come down on a strong offer.
Risks & watch-outs
- Watch-outs: flood insurance adds $427/mo; built in 1952 — expect roof / HVAC / electrical / plumbing capex.
- Climate carrying-cost: in FEMA flood zone AE (mandatory federal flood insurance); severe wind risk, 99% chance of damaging wind over 30y; extreme-heat days projected 7→30/yr by 2055 (HVAC capex compounding) — expect insurance premiums to compound above CPI over the hold.
Questions for the listing agent
- It's been on market 100 days. Have you received any prior offers? Is the seller open to a 9% concession, seller financing, or rate buy-down credit?
- Built in 1952 — when were the roof, HVAC, electrical panel, plumbing, and water heater last replaced?
- What's the actual annual flood-insurance premium (NFIP or private), and is the property in a SFHA with mandatory coverage?
- Why hasn't it sold? Are there any deal-killer items the seller is aware of (foundation, flood, title, zoning, code violations)?
- Is there a deadline driving the sale (1031 exchange, divorce, estate, relocation)? That informs how much negotiation room exists.
- Crime grade is D in this area — have there been break-ins, vandalism, or insurance claims at this property in the last 3 years? What carrier currently insures it and at what premium?
- What's the average days-on-market for RENTAL listings here right now (not sales)? A rising rental-DOM trend means longer vacancies and softer asking-rent achievability than the comps imply.
- What's the recent tenant-quality profile in this submarket — average credit score on applications, eviction rate, late-payment / NSF rate, and stable-employment percentage? A property-management company in the area should have these aggregated.
- How much new for-sale + rental construction is in the pipeline within 1–3 miles? Heavy new supply typically softens prices + rents 12–24 months out; constrained supply supports both.
Investment metrics
- 1% rule
- 1.35% ✓
- Cap rate
- 11.89%
- Cash-on-cash
- 19.98%
- DSCR
- 1.89
- GRM
- 6.2
CMA / ARV
No comps found within radius.
Projected returns pro-forma
-3.0% appreciation · 0.0% rent growth · sell at horizon
- IRR
- -7.3%
- Equity multiple
- 0.74×
- Total profit
- $-11,709
- Equity at exit
- $23,857
- IRR
- -3.0%
- Equity multiple
- 0.83×
- Total profit
- $-7,601
- Equity at exit
- $13,834
Cash invested: $44,800 (down + closing). Projections, not guarantees.
Landlord ↔ Tenant lean methodology
- Overall (STATE)
- 87 Strongly Landlord-Friendly
- State Florida
- 87 Strongly Landlord-Friendly · R+3
- County
- — inherits STATE
- City
- — inherits STATE
ZIP-level market 33616
- Home prices YoY
- -27.3%
- Rents YoY
- -2.9%
- Active inventory
- 189
- Price-to-rent
- 6.2×
Monthly cashflow live
- Estimated rent
- $2,155 high interval (Pro) →
- Mortgage (P&I)
- −$839
- Tax from tax record
- −$51 /mo · $613/yr
- Insurance
- −$67
- Flood insurance flood zone
- −$427 /mo · $5,118/yr
- HOA
- −$0
- Vacancy / Maint / Mgmt
- −$453
- Net cashflow
- $319
Break-even live
UW: 25.0% down · 7.5% · 30yr · 1.5% tax · 5.0% vac · 8.0% maint · 8.0% mgmt
Financing live
Cash to close
- Down payment
- $40,000
- Closing costs
- $4,800
- Reserves months
- —
- Total cash needed
- —
Loan-product check · same deal, 3 products live
Conventional
25% down · 7.5% · 30yr
- Down + closing
- —
- Monthly P&I
- —
- Monthly cashflow
- —
- DSCR
- —
- Eligible?
- —
Personal DTI + credit; lowest rate.
DSCR
20% down · 8.5% · 30yr
- Down + closing
- —
- Monthly P&I
- —
- Monthly cashflow
- —
- DSCR
- —
- Eligible?
- —
No personal income docs; deal must DSCR.
Hard money
10% down · 12.0% · 12mo
- Down + closing
- —
- Monthly P&I
- —
- Monthly cashflow
- —
- DSCR
- —
- Eligible?
- —
Short-term bridge; refi at stabilization.
Rent comps 40 comps
| Address | Beds | Baths | Sqft | Rent | $/sqft | DOM | Units | Dist |
|---|---|---|---|---|---|---|---|---|
| 6701 S West Shore Blvd Unit 10 Tampa, FL | 1.0 | 1.0 | 550 | $1,345 | $2.45 | 24d | 1 | 0.17mi |
| 6601 S West Shore Blvd Tampa, FL | 1.0–3.0 | 1.0–2.5 | 1015 | $2,321 | $2.29 | 2d | 8 | 0.18mi |
| 6619 S West Shore Blvd Unit A Tampa, FL | 2.0 | 1.0 | 920 | $1,600 | $1.74 | 24d | 1 | 0.20mi |
| 6501 S West Shore Blvd Tampa, FL | 1.0–3.0 | 1.0–2.0 | 980 | $2,049 | $2.09 | 3d | 16 | 0.24mi |
| 4950 W Prescott St Tampa, FL | 1.0–3.0 | 1.0–2.0 | 1062 | $3,114 | $2.93 | 20d | 22 | 0.24mi |
| 4950 W Prescott St Unit 5205 Tampa, FL | 2.0 | 2.0 | 1122 | $2,864 | $2.55 | 20d | 1 | 0.27mi |
| 7002 S Kissimmee St Tampa, FL | 2.0 | 1.0 | 752 | $1,350 | $1.80 | 22d | 1 | 0.38mi |
| 7002 S Kissimmee St Unit B Tampa, FL | 2.0 | 1.0 | 752 | $1,450 | $1.93 | 24d | 1 | 0.38mi |
| 4502 W McCoy St Tampa, FL | 1.0–2.0 | 1.0–2.0 | 891 | $2,730 | $3.06 | 2d | 14 | 0.43mi |
| 7108 S Kissimmee St Unit 7108B Tampa, FL | 2.0 | 1.0 | 700 | $1,475 | $2.11 | 5d | 1 | 0.44mi |
| 7108 S Kissimmee St Unit 7106D Tampa, FL | 2.0 | 1.0 | 700 | $1,399 | $2.00 | 5d | 1 | 0.44mi |
| 6822 S Shamrock Rd Tampa, FL | 1.0 | 1.0 | 561 | $1,600 | $2.85 | 18d | 6 | 0.44mi |
| 6301 S West Shore Blvd Tampa, FL | 2.0 | 1.0–2.0 | 687 | $1,979 | $2.88 | 2d | 33 | 0.48mi |
| 6804 S Wall St Tampa, FL | 3.0 | 1.5 | 1012 | $1,800 | $1.78 | 24d | 1 | 0.53mi |
| 7106 S Sparkman St Tampa, FL | 3.0 | 2.0 | 1011 | $3,000 | $2.97 | 24d | 1 | 0.54mi |
| 6711 S Cortez St Tampa, FL | 3.0 | 2.0 | 1040 | $2,650 | $2.55 | 24d | 1 | 0.59mi |
| 7408 S Sherrill St Unit B Tampa, FL | 2.0 | 1.0 | 625 | $1,379 | $2.21 | 24d | 1 | 0.69mi |
| 6207 S West Shore Blvd Tampa, FL | 3.0 | 1.0–2.0 | 1076 | $3,930 | $3.65 | 2d | 36 | 0.70mi |
| 7205 S Manhattan Ave Tampa, FL | 2.0 | 1.0 | 844 | $1,800 | $2.13 | 3d | 1 | 0.83mi |
| 6237 S Manhattan Ave Tampa, FL | 2.0 | 1.0 | 900 | $1,749 | $1.94 | 5d | 11 | 0.84mi |
| 7701 Interbay Blvd Tampa, FL | 1.0–3.0 | 1.0–2.0 | 1435 | $2,934 | $2.04 | 2d | 21 | 0.85mi |
| 4716 W Wisconsin Ave Tampa, FL | 3.0 | 1.0 | 980 | $3,200 | $3.27 | 24d | 1 | 0.93mi |
| 4720 W Leila Ave Tampa, FL | 3.0 | 1.0 | 864 | $1,850 | $2.14 | 11d | 1 | 1.11mi |
| 4720 W Leila Ave Tampa, FL | 3.0 | 1.0 | 864 | $1,850 | $2.14 | 5d | 1 | 1.11mi |
| 4720 W Leila Ave Tampa, FL | 3.0 | 1.0 | 864 | $1,850 | $2.14 | 24d | 1 | 1.11mi |
| 4301 W Bay Ave Tampa, FL | 3.0 | 2.0 | 950 | $2,298 | $2.42 | 20d | 1 | 1.11mi |
| 7210 Interbay Blvd Tampa, FL | 3.0 | 1.0–2.5 | 1129 | $2,943 | $2.61 | 24d | 30 | 1.14mi |
| 5320 S West Shore Blvd Tampa, FL | 2.0 | 1.0–2.0 | 798 | $2,731 | $3.42 | 2d | 17 | 1.27mi |
| 5350 Bridge St Tampa, FL | 1.0–3.0 | 1.0–2.0 | 1092 | $2,999 | $2.75 | 2d | 12 | 1.27mi |
| 5608 S Manhattan Ave Unit A Tampa, FL | 2.0 | 1.0 | 800 | $500 | $0.62 | 18d | 1 | 1.28mi |
| 6422 S Adelia Ave Tampa, FL | 2.0 | 1.0 | 918 | $2,400 | $2.61 | 24d | 1 | 1.31mi |
| 5127 W Tyson Ave Tampa, FL | 3.0 | 1.0–2.5 | 1078 | $4,469 | $4.14 | 5d | 25 | 1.31mi |
| 6910 Interbay Blvd Tampa, FL | 1.0–2.0 | 1.0 | 750 | $1,681 | $2.24 | 22d | 10 | 1.32mi |
| 5432 W Tyson Ave Tampa, FL | 1.0–2.0 | 1.0–2.0 | 911 | $3,653 | $4.01 | 2d | 51 | 1.33mi |
| 6319 S Church Ave Tampa, FL | 3.0 | 2.0 | 1076 | $2,900 | $2.70 | 24d | 1 | 1.36mi |
| 5301 W Tyson Ave Tampa, FL | 1.0–3.0 | 1.0–2.0 | 1176 | $4,045 | $3.44 | 2d | 190 | 1.41mi |
| 5001 Bridge St Tampa, FL | 3.0 | 1.0–2.0 | 1005 | $2,954 | $2.94 | 2d | 10 | 1.42mi |
| 6415 S Roberts Ave Unit 105 Tampa, FL | 1.0 | 1.0 | 576 | $975 | $1.69 | 5d | 1 | 1.42mi |
| 6405 S Roberts Ave Unit B Tampa, FL | 2.0 | 1.0 | 918 | $1,550 | $1.69 | 24d | 1 | 1.44mi |
| 6317 S Roberts Ave Unit A Tampa, FL | 2.0 | 1.0 | 864 | $1,600 | $1.85 | 22d | 1 | 1.45mi |
Listing history 5 events
-
2026-04-29price $175,000 693-char remark
Show marketing remark (693 chars)
Highest and Best offer by May 5, 2026 at 5 PM. PRIME SOUTH TAMPA LOCATION++++Build Your South Tampa Dream Home, +++CONCRETE BLOCK HOUSE On The property Was Damaged In The Hurricane++++PRICED based on Value In The Structure For Rehab Or The Lot For New Construction+++Screened In Patio Front Porch++Call Today And Get The Ball Rolling On Your New Construction Project! +++Investors!++++ Seize The Opportunity To Own A Piece Of South Tampa In A Rapidly Growing Residential Neighborhood With Many New Builds+++ One Of Tampa's Oldest Neighborhoods+++Easy Access To Major Highways, Shopping, Dining, Top-Rated Schools, And Macdill Air Force Base+++MAKE IT YOURS, CALL TODAY BEFORE IT’S GONE.
-
2026-04-14price $179,990 693-char remark
Show marketing remark (693 chars)
Highest and Best offer by May 5, 2026 at 5 PM. PRIME SOUTH TAMPA LOCATION++++Build Your South Tampa Dream Home, +++CONCRETE BLOCK HOUSE On The property Was Damaged In The Hurricane++++PRICED based on Value In The Structure For Rehab Or The Lot For New Construction+++Screened In Patio Front Porch++Call Today And Get The Ball Rolling On Your New Construction Project! +++Investors!++++ Seize The Opportunity To Own A Piece Of South Tampa In A Rapidly Growing Residential Neighborhood With Many New Builds+++ One Of Tampa's Oldest Neighborhoods+++Easy Access To Major Highways, Shopping, Dining, Top-Rated Schools, And Macdill Air Force Base+++MAKE IT YOURS, CALL TODAY BEFORE IT’S GONE.
-
2026-02-16$184,990 Active 693-char remark
Show marketing remark (693 chars)
Highest and Best offer by May 5, 2026 at 5 PM. PRIME SOUTH TAMPA LOCATION++++Build Your South Tampa Dream Home, +++CONCRETE BLOCK HOUSE On The property Was Damaged In The Hurricane++++PRICED based on Value In The Structure For Rehab Or The Lot For New Construction+++Screened In Patio Front Porch++Call Today And Get The Ball Rolling On Your New Construction Project! +++Investors!++++ Seize The Opportunity To Own A Piece Of South Tampa In A Rapidly Growing Residential Neighborhood With Many New Builds+++ One Of Tampa's Oldest Neighborhoods+++Easy Access To Major Highways, Shopping, Dining, Top-Rated Schools, And Macdill Air Force Base+++MAKE IT YOURS, CALL TODAY BEFORE IT’S GONE.
-
1996-10-09soldstatus $25,000
-
1983-08-01soldstatus $32,300
ⓘ Source: listings_history table (triggers on properties + properties_extension) + one-shot
backfill from property_details.listing_events for pre-trigger history.
Tax reassessment forecast FL · Resets to sale price
- Current annual tax
- $613 · $51/mo
- Projected year-2 tax
- $1,328 · $111/mo
- Expected delta
- +$715/yr (+$60/mo · 116.5%)
ⓘ Screening estimate from a state-policy table — verify with the county assessor before closing.
Climate risk First Street
- Flood 10/10 Extreme FEMA zone AE · 99% chance over 30 yrs
- Wildfire 2/10 Low
- Heat 10/10 Extreme 7 d/yr ≥107°F today · 30 d/yr by 30 yrs out
- Wind 10/10 Extreme 99% chance of damaging wind over 30 yrs
- Air quality 4/10 Moderate 4 unhealthy d/yr today · 4 by 30 yrs out
Nearby sold comps map
Loading sold comps map…
Walkable amenities ~0.75 mi
Loading nearby amenities…
Taxation est. · year 1
- Rental income
- $25,862
- − Mortgage interest
- −$8,962
- − Property taxes
- −$613
- − Insurance
- −$5,918
- − Repairs & maintenance
- −$2,069
- − Management
- −$2,069
- − Depreciation
- −$4,655
- Taxable income
- $1,575
- Est. tax owed @ 24.0%
- −$378
- After-tax cash flow
- $3,452/yr
For passive investors: Depreciation is non-cash, so a rental often shows a tax loss while cash-flowing — sheltering income. Rental losses are passive: they offset passive income freely, and up to $25,000/yr can offset ordinary (W-2) income if you actively participate and your MAGI is under $100k (phasing out to $0 by $150k); unused losses carry forward. On sale, claimed depreciation is recaptured at up to 25%, and gains may owe capital-gains tax (a 1031 exchange can defer both). Figures are a year-1 estimate at your 24.0% rate — not tax advice; consult a CPA.
Schools (NCES district)
- District
- Hillsborough
- NCES district ID
- 1200870
- Math proficiency
- 47% ▼ -8.00%
- Reading proficiency
- 50% ▼ -4.00%
- Median HH income
- $50,622
- Composite
- 41.6/100
- National rank
- #3435
- State rank
- #41 of 73 in FL
Livability — Tampa
- Score
- 79/100
- State rank
- #142
- US rank
- #2135
Category grades
Schools grade is shown separately in the Schools card above.
Census & demographics
- Census place
- Tampa, FL
- County
- Hillsborough County · 1,540,968 people
- City population
- 523,346
- Metro
- Tampa-St. Petersburg-Clearwater, FL
- Population (ZIP)
- 15,830
- Household income
- $93,210
- Rent vs Own
- Severe rent burden
- 728.0
Population outlook (Hillsborough County) Hauer SSP2
- Today (2025)
- 1,607,022 people
- By 2030
- 1,733,968 · +7.9%
- By 2040
- 1,979,565 · +23.2%
- By 2050
- 2,203,427 · +37.1%
- By 2075
- 2,667,893 · +66.0%
- By 2100
- 2,891,558 · +79.9%
Race, ethnicity, and origin ACS 2023
- Neighborhood character
- Diverse neighborhood (Simpson 0.59)
- Race & ethnicity
- White 60% Hispanic / Latino 16% Black 13% Two or more races 13% Asian 4% Pacific Islander 1%
- Hispanic origin (detail)
- Mexican 4% Puerto Rican 4% Cuban 3%
- Common ancestry
- Slovak 2% Romanian 2% Hispanic 2%
- Foreign-born
- 12% · Canada, Jamaica, Vietnam
- Languages at home
- 82% English-only · Spanish 9% Arabic 2% Other Indo-European 2%
Political lean MEDSL · Hillsborough
- 2024 margin
- Toss-up / Even · D 47.8% · R 50.9% · Other 1.3%
- 2008→2024 swing
- -10.2pp toward R · 2008: 7.1pp · 2024: -3.1pp
- All cycles
- 2024: R+3.1 2020: D+6.9 2016: D+6.8 2012: D+6.7 2008: D+7.1
Not yet ingested
- Civics
- —
Market trends
- HPI YoY
- ▼ -148.14%
- Current HPI
- 394.8298
- Rent YoY
- ▼ -2.93%
- Metro
- Tampa-St. Petersburg-Clearwater, FL
- State GDP YoY
- ▲ 3.28%
- F500 in state
- 36
Industry mix (Fortune 500 HQ in FL)
| Industry | F500 HQs | Revenue |
|---|---|---|
| Industrial Technology | 2 | $29B |
|
||
| Insurance | 2 | $17B |
|
||
| Retail | 1 | $60B |
|
||
| Technology Distribution | 1 | $58B |
|
||
| Homebuilding | 1 | $35B |
|
||
| Technology Manufacturing | 1 | $35B |
|
||
Price history
+441.8% since first listed5 events — show timeline
- 2026-04-29 Price Changed $175,000 Stellar MLS as Distributed by MLS Grid
- 2026-04-14 Price Changed $179,990 Stellar MLS as Distributed by MLS Grid
- 2026-02-16 Listed $184,990 Stellar MLS as Distributed by MLS Grid
- 1996-10-09 Sold (Public Records) $25,000 Public Records
- 1983-08-01 Sold (Public Records) $32,300 Public Records
Property tax history
+4.5%/yrLatest (2025): $613 · +5.1% YoY. Source: county tax records.
Cash-flow waterfall
monthlySold comps — $/sqft
last 12 mo · ≤1 miLoading sold comps…