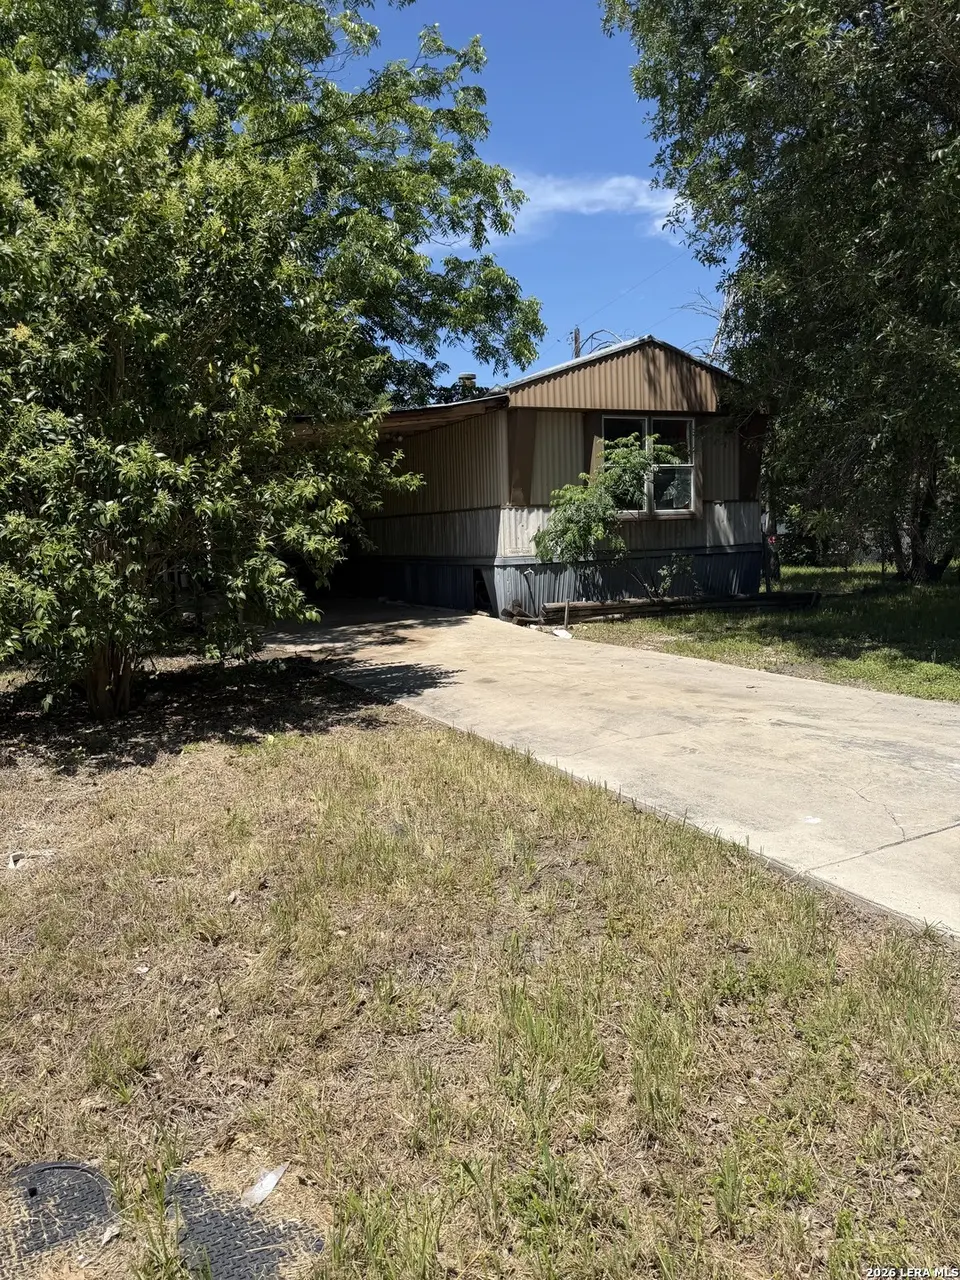
1512 Wisteria Ln · New Braunfels, TX
Flood risk 6/10 · Moderate
- FEMA flood zone
- X (shaded)
- Chance of flooding over 30 yrs
- 0.73%
- Est. flood insurance / yr
- $507 – $1,088
Fire risk 3/10 · Minor
- Est. fire insurance / yr
- $1,222 – $2,270
Heat risk 8/10 · Major
- Hot days now (above 108°F)
- 7 days/yr
- Hot days in 30 yrs
- 21 days/yr
Wind risk 8/10 · Major
- Chance of severe wind over 30 yrs
- 80.0%
Air-quality risk 1/10 · Minimal
- Unhealthy air days now
- 0 days/yr
- Unhealthy air days in 30 yrs
- 0 days/yr
Risk factors via First Street. Map © Google.
Why this score? — see what drove the B- grade
The composite is a weighted blend of 9 inputs, each scored 0–100. Each bar is that input's sub-score; the figure is the points it added to the 100-point composite (weight × sub-score).
- Cash flow +30.0/30.0
- DSCR +10.0/10.0
- 1% rule +9.3/10.0
- ARV discount +7.5/15.0
- Schools +4.4/10.0
- Livability +4.2/5.0
- Condition / age +2.5/5.0
- Rent growth +2.0/5.0
- Appreciation +0.0/10.0
$110,000
🖨 Deal sheet 📄 Offer letter ✓ Due diligence
Listing remarks
Great investment property in a great area! Conveniently located close to downtown and major highways! Come make this 3 bedroom 2 bathroom house your new home! With a large living room and a separate eating area, there is lots of space to spread out. If you don't like this one, thats ok! Remove this one and add your new one onto the lot that is almost a quarter acre! Great location with a ton of potential to do what you would like!
Key facts
- Large living room
- Separate eating area
- Close to downtown
Tags
Property features AI
Exterior
- Utilities: City water/sewer
- Home design: Pre-owned home; Approximately 32 years old; Composition roof
- Construction: Siding exterior; Composition roof; Pre-owned construction
- Exterior features: Siding exterior; Lot in GREEN VALLEY EST - COMAL subdivision
Interior
- Kitchen: Stove/Range; Eat-in kitchen (about 10 x 7)
- Bedrooms: Primary bedroom on lower level, about 12 x 12; Second bedroom about 10 x 10; Third bedroom about 10 x 12
- Flooring: Carpeting; Linoleum; Wood flooring
- Bathrooms: Two full bathrooms; Primary bath with separate tub and shower and double vanity (about 12 x 10)
- Heating & cooling: Electric heat
- Interior features: Eat-in kitchen; Walk-in pantry; Utility room inside; All window coverings remain; 1 living area
- Laundry & utility: Washer connection; Dryer connection; Utility room inside
Neighborhood map
What this means for you Summary
Snapshot
- This is a 3-bed/2.0-bath manufactured listed at $110k.
Deal economics
- At list price, monthly cash flow is $507 ($6k/yr) — positive.
- The deal already cash-flows at list — no discount required.
- Meets the 1% rule at list price ($2k rent vs $110k).
- Recommended offer: $108k (1.5% below list) — sets the bar for market timing.
- Cap rate 11.8% vs local median 3.4% in New Braunfels — top-decile yield for the area; either an underpriced asset or a hidden risk that comps aren't pricing in. Stress-test before assuming the spread holds.
Location & tenants
- Location reads 83/100 on livability (#9 in TX, #925 nationally) — a professional / high-income tenant draw. Strengths: amenities A+, housing A+, health & safety A+; Watch: commute F.
- New Braunfels ISD (urban): math 47% / reading 53% proficiency, ranked #157 of 826 in TX (top 19%) — acceptable for families but not a draw, mixed tenant base, ~2y average lease.
- Market conditions: Rents soft (-2.0%/yr); 1896 active listings in the ZIP; 37 comparable units currently listed for rent nearby; rentals at typical pace (median 18d on market — plan ~3-4 weeks tenant-placement turnaround); solid renter incomes; 3,420 units permitted in Comal County in 2024 (1,164 in 5+ unit buildings).
Forward outlook
- Local home prices are declining (-3.0%/yr); year-one equity from $761 of loan paydown is wiped out by about $3k of value loss. Plan a longer hold.
- Comal County population projected at +70% by 2050 — long-run rental-demand tailwind backs the buy-and-hold thesis.
- At projected returns (-3.0% appreciation + 0.0% rent growth), your $31k cash investment doubles in ~8 years — after that, you're playing with house money.
Negotiation context
- It's been on market 16 days — a 2% lower offer ($108k) is reasonable based on typical stale-listing flexibility.
Risks & watch-outs
- Climate carrying-cost: major flood risk; severe wind risk, 80% chance of damaging wind over 30y; extreme-heat days projected 7→21/yr by 2055 (HVAC capex compounding) — expect insurance premiums to compound above CPI over the hold.
Questions for the listing agent
- Is there a deadline driving the sale (1031 exchange, divorce, estate, relocation)? That informs how much negotiation room exists.
- Schools are B-rated — typically a magnet for longer-tenancy family renters. What's the average tenant stay here, and is there a school-zone premium baked into asking?
- What's the average days-on-market for RENTAL listings here right now (not sales)? A rising rental-DOM trend means longer vacancies and softer asking-rent achievability than the comps imply.
- What's the recent tenant-quality profile in this submarket — average credit score on applications, eviction rate, late-payment / NSF rate, and stable-employment percentage? A property-management company in the area should have these aggregated.
- How much new for-sale + rental construction is in the pipeline within 1–3 miles? Heavy new supply typically softens prices + rents 12–24 months out; constrained supply supports both.
Investment metrics
- 1% rule
- 1.43% ✓
- Cap rate
- 11.82%
- Cash-on-cash
- 19.74%
- DSCR
- 1.88
- GRM
- 5.8
CMA / ARV
No comps found within radius.
Projected returns pro-forma
-3.0% appreciation · 0.0% rent growth · sell at horizon
- IRR
- 8.4%
- Equity multiple
- 1.32×
- Total profit
- $9,841
- Equity at exit
- $16,401
- IRR
- 15.0%
- Equity multiple
- 2.05×
- Total profit
- $32,317
- Equity at exit
- $9,511
Cash invested: $30,800 (down + closing). Projections, not guarantees.
Landlord ↔ Tenant lean methodology
- Overall (STATE)
- 87 Strongly Landlord-Friendly
- State Texas
- 87 Strongly Landlord-Friendly · R+5
- County
- — inherits STATE
- City
- — inherits STATE
ZIP-level market 78130
- Rents YoY
- -2.0%
- Active inventory
- 1896
- Price-to-rent
- 5.8×
Monthly cashflow live
- Estimated rent
- $1,577 high interval (Pro) →
- Mortgage (P&I)
- −$577
- Tax from tax record
- −$116 /mo · $1,394/yr
- Insurance
- −$46
- HOA
- −$0
- Vacancy / Maint / Mgmt
- −$331
- Net cashflow
- $507
Break-even live
UW: 25.0% down · 7.5% · 30yr · 1.5% tax · 5.0% vac · 8.0% maint · 8.0% mgmt
Financing live
Cash to close
- Down payment
- $27,500
- Closing costs
- $3,300
- Reserves months
- —
- Total cash needed
- —
Loan-product check · same deal, 3 products live
Conventional
25% down · 7.5% · 30yr
- Down + closing
- —
- Monthly P&I
- —
- Monthly cashflow
- —
- DSCR
- —
- Eligible?
- —
Personal DTI + credit; lowest rate.
DSCR
20% down · 8.5% · 30yr
- Down + closing
- —
- Monthly P&I
- —
- Monthly cashflow
- —
- DSCR
- —
- Eligible?
- —
No personal income docs; deal must DSCR.
Hard money
10% down · 12.0% · 12mo
- Down + closing
- —
- Monthly P&I
- —
- Monthly cashflow
- —
- DSCR
- —
- Eligible?
- —
Short-term bridge; refi at stabilization.
Rent comps 37 comps
| Address | Beds | Baths | Sqft | Rent | $/sqft | DOM | Units | Dist |
|---|---|---|---|---|---|---|---|---|
| 222 Redbud Ln Unit A New Braunfels, TX | 2.0 | 1.0 | 962 | $1,095 | $1.14 | 43d | 1 | 0.13mi |
| 284 Perryman St New Braunfels, TX | 2.0 | 1.0 | 750 | $1,850 | $2.47 | 23d | 1 | 0.40mi |
| 1231 Huisache Ave New Braunfels, TX | 1.0–2.0 | 1.0–2.0 | 866 | $1,588 | $1.83 | 1d | 8 | 0.64mi |
| 935 Linde Ave Unit H New Braunfels, TX | 2.0 | 2.0 | 972 | $975 | $1.00 | 43d | 1 | 0.64mi |
| 1935 Hilltop Summit Rd Unit 2NB-2 New Braunfels, TX | 2.0 | 2.0 | 1060 | $1,329 | $1.25 | 2d | 1 | 0.66mi |
| 303 E Faust St New Braunfels, TX | 2.0 | 1.0 | 884 | $1,295 | $1.46 | 43d | 1 | 0.73mi |
| 1045 Sanger Ave New Braunfels, TX | 1.0–2.0 | 1.0–2.0 | 837 | $1,500 | $1.79 | 43d | 14 | 0.76mi |
| 453 S Business IH 35 Unit 710 New Braunfels, TX | 2.0 | 2.0 | 1020 | $1,322 | $1.30 | 3d | 1 | 0.79mi |
| 453 N Business HWY New Braunfels, TX | 1.0–2.0 | 1.0–2.0 | 816 | $1,391 | $1.70 | 1d | 13 | 0.80mi |
| 2010 N Ranch Estates Blvd New Braunfels, TX | 3.0 | 2.0 | 1169 | $1,649 | $1.41 | 43d | 1 | 0.97mi |
| 1302 S Mesquite Ave New Braunfels, TX | 3.0 | 2.0 | 1426 | $1,775 | $1.24 | 23d | 1 | 1.00mi |
| 2062 N Ranch Estates Blvd New Braunfels, TX | 3.0 | 2.0 | 1346 | $1,775 | $1.32 | 23d | 1 | 1.09mi |
| 1022 Clover Cir New Braunfels, TX | 2.0 | 1.0 | 800 | $1,395 | $1.74 | 10d | 1 | 1.10mi |
| 554 Lee St New Braunfels, TX | 2.0 | 1.0 | 953 | $1,625 | $1.71 | 3d | 1 | 1.14mi |
| 262 Clemens Ave New Braunfels, TX | 2.0 | 1.0 | 1158 | $1,800 | $1.55 | 16d | 1 | 1.14mi |
| 271 Willow Ave New Braunfels, TX | 2.0 | 2.0 | 1300 | $1,950 | $1.50 | 23d | 1 | 1.16mi |
| 1440 Jackson St Unit B New Braunfels, TX | 2.0 | 1.0 | 750 | $1,150 | $1.53 | 43d | 1 | 1.18mi |
| 859 Oasis St New Braunfels, TX | 2.0 | 1.0 | 896 | $1,375 | $1.53 | 3d | 1 | 1.20mi |
| 770 S Interstate 35 South Frontage Rd Unit 3294 New Braunfels, TX | 3.0 | 2.0 | 1298 | $1,922 | $1.48 | 3d | 1 | 1.20mi |
| 770 S Interstate 35 South Frontage Rd Unit 710 New Braunfels, TX | 2.0 | 2.0 | 933 | $1,482 | $1.59 | 3d | 1 | 1.20mi |
| 770 Interstate 35 N New Braunfels, TX | 1.0–3.0 | 1.0–2.0 | 995 | $1,930 | $1.94 | 20d | 6 | 1.21mi |
| 893 Pine St New Braunfels, TX | 2.0 | 1.0 | 1166 | $1,645 | $1.41 | 17d | 1 | 1.21mi |
| 1360 W County Line Rd Unit 3212 New Braunfels, TX | 3.0 | 2.0 | 1150 | $1,553 | $1.35 | 3d | 1 | 1.25mi |
| 1360 W County Line Rd Unit 2212 New Braunfels, TX | 2.0 | 2.0 | 896 | $1,113 | $1.24 | 3d | 1 | 1.25mi |
| 244 Ridgewood Ave New Braunfels, TX | 3.0 | 2.0 | 1250 | $1,700 | $1.36 | 23d | 1 | 1.31mi |
| 926 Misty Acres Dr New Braunfels, TX | 3.0 | 2.0 | 1188 | $1,395 | $1.17 | 2d | 1 | 1.32mi |
| 1642 W County Line Rd New Braunfels, TX | 2.0 | 2.0 | 1238 | $1,495 | $1.21 | 4d | 1 | 1.38mi |
| 991 W Mill St Unit NA New Braunfels, TX | 2.0 | 2.0 | 1126 | $2,200 | $1.95 | 23d | 1 | 1.38mi |
| 555 S Union Ave New Braunfels, TX | 2.0 | 1.0 | 918 | $1,695 | $1.85 | 2d | 1 | 1.39mi |
| 1013 Misty Acres Dr New Braunfels, TX | 3.0 | 2.0 | 1215 | $1,350 | $1.11 | 21d | 1 | 1.39mi |
| 1033 Carolyn Cv New Braunfels, TX | 3.0 | 2.0 | 1111 | $1,495 | $1.35 | 12d | 1 | 1.40mi |
| 1185 W Mill St New Braunfels, TX | 2.0 | 2.0 | 876 | $1,595 | $1.82 | 23d | 1 | 1.43mi |
| 1055 Carolyn Cv New Braunfels, TX | 3.0 | 2.0 | 1111 | $1,500 | $1.35 | 43d | 1 | 1.44mi |
| 2014 Rueben Rd New Braunfels, TX | 3.0 | 2.5 | 1380 | $1,595 | $1.16 | 43d | 1 | 1.47mi |
| 2028 Rueben Rd New Braunfels, TX | 3.0 | 2.5 | 1380 | $1,595 | $1.16 | 3d | 1 | 1.49mi |
| 618 Gode Ln New Braunfels, TX | 3.0 | 2.0 | 1255 | $1,395 | $1.11 | 43d | 1 | 1.49mi |
| 1632 Sunnycrest Cir New Braunfels, TX | 3.0 | 2.0 | 1371 | $1,625 | $1.19 | 17d | 1 | 1.50mi |
Listing history 8 events
-
2026-06-07statusdays on market $110,000 Pending 16 DOM
-
2026-06-04days on market $110,000 Active 15 DOM
-
2026-06-03days on market $110,000 Active 14 DOM
-
2026-06-02days on market $110,000 Active 13 DOM
-
2026-06-01days on market $110,000 Active 12 DOM
-
2026-05-31statusdays on market $110,000 Active 11 DOM
-
2026-05-20$110,000 New
-
1978-02-20soldstatus
ⓘ Source: listings_history table (triggers on properties + properties_extension) + one-shot
backfill from property_details.listing_events for pre-trigger history.
Tax reassessment forecast TX · Resets to sale price
- Current annual tax
- $1,394 · $116/mo
- Projected year-2 tax
- $2,013 · $168/mo
- Expected delta
- +$619/yr (+$52/mo · 44.4%)
ⓘ Screening estimate from a state-policy table — verify with the county assessor before closing.
Climate risk First Street
- Flood 6/10 Major FEMA zone X (shaded) · 73% chance over 30 yrs
- Wildfire 3/10 Moderate
- Heat 8/10 Severe 7 d/yr ≥108°F today · 21 d/yr by 30 yrs out
- Wind 8/10 Severe 80% chance of damaging wind over 30 yrs
- Air quality 1/10 Low 0 unhealthy d/yr today · 0 by 30 yrs out
Nearby sold comps map
Loading sold comps map…
Walkable amenities ~0.75 mi
Loading nearby amenities…
Taxation est. · year 1
- Rental income
- $18,920
- − Mortgage interest
- −$6,162
- − Property taxes
- −$1,394
- − Insurance
- −$550
- − Repairs & maintenance
- −$1,514
- − Management
- −$1,514
- − Depreciation
- −$3,200
- Taxable income
- $4,588
- Est. tax owed @ 24.0%
- −$1,101
- After-tax cash flow
- $4,980/yr
For passive investors: Depreciation is non-cash, so a rental often shows a tax loss while cash-flowing — sheltering income. Rental losses are passive: they offset passive income freely, and up to $25,000/yr can offset ordinary (W-2) income if you actively participate and your MAGI is under $100k (phasing out to $0 by $150k); unused losses carry forward. On sale, claimed depreciation is recaptured at up to 25%, and gains may owe capital-gains tax (a 1031 exchange can defer both). Figures are a year-1 estimate at your 24.0% rate — not tax advice; consult a CPA.
Schools (NCES district)
- District
- New Braunfels ISD
- NCES district ID
- 4832370
- Math proficiency
- 47% ▼ -10.00%
- Reading proficiency
- 53% ▼ -2.00%
- Median HH income
- $60,945
- Composite
- 43.81/100
- National rank
- #2931
- State rank
- #157 of 826 in TX
Livability — New Braunfels
- Score
- 83/100
- State rank
- #9
- US rank
- #925
Category grades
Schools grade is shown separately in the Schools card above.
Census & demographics
- Census place
- New Braunfels, TX
- County
- Comal County · 206,262 people
- City population
- 144,962
- Metro
- San Antonio-New Braunfels, TX
- Population (ZIP)
- 104,009
- Household income
- $83,064
- Rent vs Own
- Severe rent burden
- 2912.0
Population outlook (Comal County) Hauer SSP2
- Today (2025)
- 175,637 people
- By 2030
- 199,911 · +13.8%
- By 2040
- 249,436 · +42.0%
- By 2050
- 299,430 · +70.5%
- By 2075
- 423,857 · +141.3%
- By 2100
- 512,048 · +191.5%
Race, ethnicity, and origin ACS 2023
- Neighborhood character
- Majority White (58%)
- Race & ethnicity
- White 58% Hispanic / Latino 37% Two or more races 19% Black 2%
- Hispanic origin (detail)
- Mexican 32%
- Common ancestry
- Romanian 2% Lithuanian 2% Slovak 2%
- Foreign-born
- 7% · Canada
- Languages at home
- 78% English-only · Spanish 20% German/W. Germanic 1%
Political lean MEDSL · Comal
- 2024 margin
- Solid R (+45.5) · D 26.8% · R 72.2%
- 2008→2024 swing
- +1.9pp toward D · 2008: -47.4pp · 2024: -45.5pp
- All cycles
- 2024: R+45.5 2020: R+42.7 2016: R+50.1 2012: R+54.1 2008: R+47.4
Not yet ingested
- Civics
- —
Market trends
- HPI YoY
- ▼ -190.61%
- Current HPI
- 173.7128
- Rent YoY
- ▼ -1.97%
- Metro
- San Antonio-New Braunfels, TX
- State GDP YoY
- ▲ 3.95%
- F500 in state
- 110
Industry mix (Fortune 500 HQ in TX)
| Industry | F500 HQs | Revenue |
|---|---|---|
| Energy | 16 | $1,198B |
|
||
| Technology | 5 | $198B |
|
||
| Engineering / Construction | 4 | $72B |
|
||
| Energy Services | 3 | $60B |
|
||
| Utilities | 3 | $41B |
|
||
| Healthcare | 2 | $330B |
|
||
Price history
2 events — show timeline
- 2026-05-20 Listed $110,000 LERA
- 1978-02-20 Sold (Public Records) — Public Records
Property tax history
-0.2%/yrLatest (2026): $1,394 · +0.6% YoY. Source: county tax records.
Cash-flow waterfall
monthlySold comps — $/sqft
last 12 mo · ≤1 miLoading sold comps…