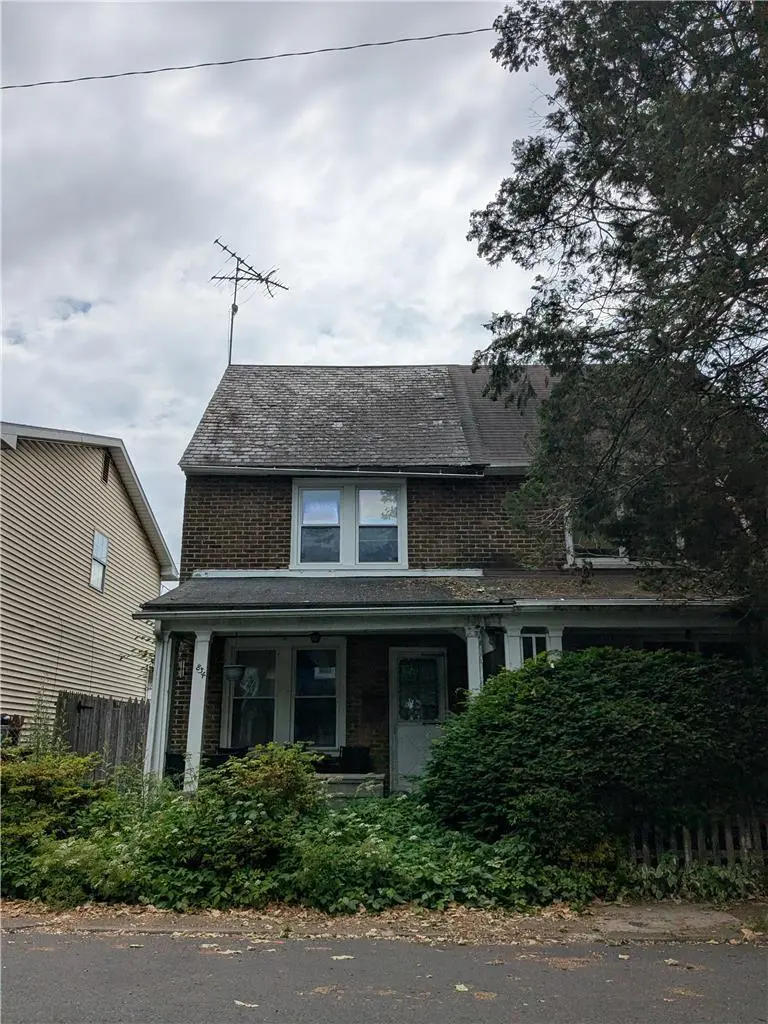
834 Hawthorne Rd · Bethlehem, PA
Flood risk 1/10 · Minimal
- FEMA flood zone
- X (unshaded)
- Chance of flooding over 30 yrs
- 0.0%
- Est. flood insurance / yr
- $473 – $860
Fire risk 1/10 · Minimal
- Est. fire insurance / yr
- $511 – $949
Heat risk 5/10 · Moderate
- Hot days now (above 99°F)
- 7 days/yr
- Hot days in 30 yrs
- 15 days/yr
Wind risk 4/10 · Minor
- Chance of severe wind over 30 yrs
- 18.0%
Air-quality risk 4/10 · Minor
- Unhealthy air days now
- 3 days/yr
- Unhealthy air days in 30 yrs
- 6 days/yr
Risk factors via First Street. Map © Google.
Why this score? — see what drove the B+ grade
The composite is a weighted blend of 9 inputs, each scored 0–100. Each bar is that input's sub-score; the figure is the points it added to the 100-point composite (weight × sub-score).
- Cash flow +29.9/30.0
- ARV discount +15.0/15.0
- DSCR +10.0/10.0
- 1% rule +8.9/10.0
- Livability +4.1/5.0
- Schools +3.5/10.0
- Rent growth +2.7/5.0
- Condition / age +2.5/5.0
- Appreciation +0.0/10.0
$159,900
🖨 Deal sheet 📄 Offer letter ✓ Due diligence
Listing remarks MLS
Classic colonial twin nestled in a quiet Bethlehem community on a lovely tree lined street. Playground located across the street. Wonderful fenced backyard. Enjoy the covered front porch this summer. Hardwood floors, newer kitchen with lots of cabinets, finished third floor for master bedroom, and full basement that could be finished. Replacement windows. Don't wait on this one.
Key facts
- Tree lined street
- Built 1916
- Listed 4 days
Tags
Property features AI
Exterior
- Parking: On-street parking
- Utilities: Public water; Public sewer; Electric service with 100 amps and circuit breakers
- Home design: 2-story property; Slate roof
- Construction: Brick construction; Slate roof
- Exterior features: Front porch; Brick exterior
Interior
- Kitchen: Electric oven
- Bedrooms: Three bedrooms on the second level (sizes approx. 10 x 9, 11 x 8, 11 x 9); Den on the third level (approx. 26 x 13)
- Bathrooms: One full bathroom (second level, approx. 7 x 6)
- Heating & cooling: Forced air heating (electric and gas); Ceiling fan(s); Wall/window air conditioning units
- Interior features: Eat-in kitchen; Full exterior-entry basement
- Laundry & utility: First-level laundry room (approx. 7 x 5); Gas water heater
Neighborhood map
What this means for you Summary
Snapshot
- This is a 3-bed/1.0-bath townhouse listed at $160k.
Deal economics
- At list price, monthly cash flow is $593 ($7k/yr) — positive.
- The deal already cash-flows at list — no discount required.
- Meets the 1% rule at list price ($2k rent vs $160k).
- Cap rate 10.7% vs local median 4.3% in Bethlehem — top-decile yield for the area; either an underpriced asset or a hidden risk that comps aren't pricing in. Stress-test before assuming the spread holds.
Location & tenants
- Location reads 82/100 on livability (#138 in PA, #1,122 nationally) — a professional / high-income tenant draw. Strengths: amenities A+, cost of living A+, housing A+; Watch: commute F.
- Bethlehem Area SD (urban): math 31% / reading 49% proficiency, ranked #342 of 539 in PA (top 64%) — families likely to look elsewhere, expect single-tenant / working-renter base with shorter leases.
- Market conditions: Rents flat; 103 active listings in the ZIP; 40 comparable units currently listed for rent nearby; rentals at typical pace (median 21d on market — plan ~3-4 weeks tenant-placement turnaround); solid renter incomes; 567 units permitted in Northampton County in 2024 (151 in 5+ unit buildings).
- This rent runs 35% of the median local income ($75k/yr) — at the standard rent-burdened threshold; future hikes will face affordability resistance.
Forward outlook
- Local home prices are declining (-3.0%/yr); year-one equity from $1k of loan paydown is wiped out by about $5k of value loss. Plan a longer hold.
- At projected returns (-3.0% appreciation + 0.8% rent growth), your $45k cash investment doubles in ~10 years — after that, you're playing with house money.
Negotiation context
- Only 4 days on market — expect competitive offers; lowballing is unlikely to land.
- 3 sale attempts since 25y ago with the ask held roughly flat each time — persistent listings suggest the price (not the market) is what's stuck; bring a comps-based counter.
- Current owner paid $127k; 26% above their basis — modest negotiation headroom, anchor on the comps not their cost.
Risks & watch-outs
- Watch-outs: built in 1916 — expect roof / HVAC / electrical / plumbing capex.
- Climate carrying-cost: extreme-heat days projected 7→15/yr by 2055 (HVAC capex compounding) — expect insurance premiums to compound above CPI over the hold.
Questions for the listing agent
- Built in 1916 — when were the roof, HVAC, electrical panel, plumbing, and water heater last replaced?
- Is there a deadline driving the sale (1031 exchange, divorce, estate, relocation)? That informs how much negotiation room exists.
- Schools are B-rated — typically a magnet for longer-tenancy family renters. What's the average tenant stay here, and is there a school-zone premium baked into asking?
- What's the average days-on-market for RENTAL listings here right now (not sales)? A rising rental-DOM trend means longer vacancies and softer asking-rent achievability than the comps imply.
- What's the recent tenant-quality profile in this submarket — average credit score on applications, eviction rate, late-payment / NSF rate, and stable-employment percentage? A property-management company in the area should have these aggregated.
- How much new for-sale + rental construction is in the pipeline within 1–3 miles? Heavy new supply typically softens prices + rents 12–24 months out; constrained supply supports both.
Investment metrics
- 1% rule
- 1.39% ✓
- Cap rate
- 10.74%
- Cash-on-cash
- 15.90%
- DSCR
- 1.71
- GRM
- 6.0
CMA / ARV
- ARV (on-the-fly)
- $245,220
- Comps found
- 12
Show comp detail 12 sales within ~0.75 mi
| Address | Dist | Beds/Ba | Sqft | Sold | Price | $/sf | Match |
|---|---|---|---|---|---|---|---|
| 822 Elm St | 0.09mi | 3/1.5 | 1,406 (+5%) | 3mo | $250,000 | $178 | 83 |
| 529 E Laurel St | 0.22mi | 3/1.5 | 1,440 (+8%) | 0mo | $275,000 | $191 | 75 |
| 726 Pembroke Rd | 0.18mi | 3/1.0 | 1,478 (+10%) | 1mo | $270,000 | $183 | 73 |
| 1005 Wood St | 0.13mi | 2/3.0 (-1) | 1,440 (+8%) | 2mo | $300,000 | $208 | 67 |
| 622 E Locust St | 0.25mi | 3/1.0 | 1,176 (-12%) | 2mo | $200,000 | $170 | 66 |
| 315 E North St | 0.30mi | 3/1.0 | 1,536 (+15%) | 2mo | $205,000 | $133 | 60 |
| 1168 Minsi Trail St | 0.37mi | 3/1.0 | 1,194 (-11%) | 6mo | $255,000 | $214 | 60 |
| 1136 N New St | 0.74mi | 3/1.0 | 1,296 (-3%) | 4mo | $232,500 | $179 | 56 |
| 754 E Washington Ave | 0.45mi | 3/2.0 | 1,200 (-10%) | 3mo | $250,000 | $208 | 55 |
| 123 E Garrison St | 0.51mi | 2/1.0 (-1) | 1,156 (-14%) | 1mo | $204,000 | $176 | 47 |
| 1507 High St | 0.71mi | 3/2.5 | 1,440 (+8%) | 4mo | $325,000 | $226 | 45 |
| 828 Center St | 0.54mi | 4/1.0 (+1) | 1,539 (+15%) | 6mo | $274,900 | $179 | 40 |
Match score weights: distance 35% · size 25% · config 20% · recency 20%. Top-matched comps best support the ARV.
Projected returns pro-forma
-3.0% appreciation · 0.85% rent growth · sell at horizon
- IRR
- 4.3%
- Equity multiple
- 1.16×
- Total profit
- $7,223
- Equity at exit
- $23,842
- IRR
- 11.6%
- Equity multiple
- 1.82×
- Total profit
- $36,691
- Equity at exit
- $13,825
Cash invested: $44,772 (down + closing). Projections, not guarantees.
Landlord ↔ Tenant lean methodology
- Overall (STATE)
- 62 Landlord-Friendly
- State Pennsylvania
- 62 Landlord-Friendly · EVEN
- County
- — inherits STATE
- City
- — inherits STATE
ZIP-level market 18018
- Rents YoY
- 0.8%
- Active inventory
- 103
- Price-to-rent
- 6.0×
Monthly cashflow live
- Estimated rent
- $2,226 high interval (Pro) →
- Mortgage (P&I)
- −$839
- Tax from tax record
- −$261 /mo · $3,127/yr
- Insurance
- −$67
- HOA
- −$0
- Vacancy / Maint / Mgmt
- −$468
- Net cashflow
- $593
Break-even live
UW: 25.0% down · 7.5% · 30yr · 1.5% tax · 5.0% vac · 8.0% maint · 8.0% mgmt
Financing live
Cash to close
- Down payment
- $39,975
- Closing costs
- $4,797
- Reserves months
- —
- Total cash needed
- —
Loan-product check · same deal, 3 products live
Conventional
25% down · 7.5% · 30yr
- Down + closing
- —
- Monthly P&I
- —
- Monthly cashflow
- —
- DSCR
- —
- Eligible?
- —
Personal DTI + credit; lowest rate.
DSCR
20% down · 8.5% · 30yr
- Down + closing
- —
- Monthly P&I
- —
- Monthly cashflow
- —
- DSCR
- —
- Eligible?
- —
No personal income docs; deal must DSCR.
Hard money
10% down · 12.0% · 12mo
- Down + closing
- —
- Monthly P&I
- —
- Monthly cashflow
- —
- DSCR
- —
- Eligible?
- —
Short-term bridge; refi at stabilization.
Rent comps 40 comps
| Address | Beds | Baths | Sqft | Rent | $/sqft | DOM | Units | Dist |
|---|---|---|---|---|---|---|---|---|
| 537 Goepp Cir Unit B Bethlehem, PA | 3.0 | 1.5 | 1225 | $1,895 | $1.55 | 43d | 1 | 0.05mi |
| 822 Elm St Bethlehem, PA | 3.0 | 1.5 | 1406 | $2,195 | $1.56 | 14d | 1 | 0.09mi |
| 802 Elm St Bethlehem, PA | 4.0 | 1.5 | 1520 | $2,800 | $1.84 | 21d | 1 | 0.11mi |
| 650 E North St Bethlehem, PA | 2.0 | 1.0–2.0 | 935 | $2,350 | $2.51 | 14d | 7 | 0.25mi |
| 316 E Union Blvd Bethlehem, PA | 4.0 | 2.0 | 1460 | $2,145 | $1.47 | 43d | 1 | 0.27mi |
| 326 E Frankford St Bethlehem, PA | 2.0 | 2.0 | 1250 | $2,300 | $1.84 | 23d | 1 | 0.28mi |
| 326 E Frankford St Bethlehem, PA | 2.0 | 2.0 | 1250 | $2,300 | $1.84 | 43d | 1 | 0.28mi |
| 746 Linden St Unit 2 Bethlehem, PA | 3.0 | 1.0 | 1008 | $1,975 | $1.96 | 43d | 1 | 0.29mi |
| 1214 Maple St Bethlehem, PA | 3.0 | 1.0 | 1462 | $2,000 | $1.37 | 43d | 1 | 0.34mi |
| 229 E Union Blvd Unit 1st Floor Bethlehem, PA | 2.0 | 1.0 | 1000 | $1,675 | $1.68 | 2d | 1 | 0.37mi |
| 229 E Union Blvd Unit 2nd Floor Bethlehem, PA | 2.0 | 1.0 | 982 | $1,595 | $1.62 | 2d | 1 | 0.37mi |
| 1138 Arcadia St Bethlehem, PA | 3.0 | 1.0 | 1802 | $2,095 | $1.16 | 43d | 1 | 0.39mi |
| 754 E Washington Ave Bethlehem, PA | 3.0 | 2.0 | 1200 | $1,900 | $1.58 | 43d | 1 | 0.44mi |
| 129 E Goepp St Bethlehem, PA | 3.0 | 2.0 | 1648 | $2,600 | $1.58 | 2d | 1 | 0.47mi |
| 122 E Goepp St Unit 1 Bethlehem, PA | 3.0 | 1.0 | 1137 | $1,895 | $1.67 | 2d | 1 | 0.49mi |
| 830 Media St Bethlehem, PA | 3.0 | 1.0 | 1128 | $2,100 | $1.86 | 23d | 1 | 0.50mi |
| 830 Media St Bethlehem, PA | 3.0 | 1.0 | 1128 | $2,100 | $1.86 | 43d | 1 | 0.50mi |
| 69 E Goepp St Bethlehem, PA | 3.0 | 1.0 | 1100 | $2,150 | $1.95 | 2d | 1 | 0.56mi |
| 417 Linden St Bethlehem, PA | 3.0 | 1.5 | 1699 | $2,450 | $1.44 | 2d | 1 | 0.56mi |
| 239 E Church St Bethlehem, PA | 3.0 | 2.5 | 1724 | $2,950 | $1.71 | 23d | 1 | 0.61mi |
| 55 E Elizabeth Ave Unit 1 Bethlehem, PA | 2.0 | 2.0 | 1184 | $2,250 | $1.90 | 44d | 1 | 0.68mi |
| 409 E Washington Ave Bethlehem, PA | 4.0 | 1.5 | 1650 | $2,645 | $1.60 | 2d | 1 | 0.70mi |
| 1320 Chelsea Ave Bethlehem, PA | 3.0 | 2.0 | 1373 | $2,395 | $1.74 | 2d | 1 | 0.73mi |
| 1320 Chelsea Ave Bethlehem, PA | 3.0 | 2.0 | 1373 | $2,349 | $1.71 | 14d | 1 | 0.73mi |
| 1136 N New St Bethlehem, PA | 3.0 | 1.0 | 1296 | $2,300 | $1.77 | 2d | 1 | 0.73mi |
| 30 E Market St Apt 1 Bethlehem, PA | 2.0 | 1.0 | 1200 | $1,950 | $1.62 | 43d | 1 | 0.75mi |
| 42 E Wall St Bethlehem, PA | 4.0 | 1.0 | 1474 | $2,550 | $1.73 | 23d | 1 | 0.77mi |
| 47 W Goepp St Bethlehem, PA | 3.0 | 1.5 | 1184 | $1,995 | $1.68 | 2d | 1 | 0.79mi |
| 1240 Pembroke Rd #2 Bethlehem, PA | 2.0 | 1.0 | 1300 | $1,495 | $1.15 | 43d | 1 | 0.80mi |
| 1240 Pembroke Rd #1 Bethlehem, PA | 3.0 | 1.0 | 1249 | $1,795 | $1.44 | 43d | 1 | 0.80mi |
| 50 W Garrison St Unit 1 Bethlehem, PA | 2.0 | 1.0 | 900 | $1,395 | $1.55 | 2d | 1 | 0.81mi |
| 56 W North St Bethlehem, PA | 2.0 | 2.0 | 1486 | $2,400 | $1.62 | 14d | 1 | 0.83mi |
| 68 W Union Blvd Bethlehem, PA | 4.0 | 1.5 | 1804 | $2,295 | $1.27 | 14d | 1 | 0.84mi |
| 34 E Washington Ave Bethlehem, PA | 2.0 | 1.0 | 1100 | $2,000 | $1.82 | 23d | 1 | 0.87mi |
| 328 Carver Dr Unit A Bethlehem, PA | 2.0 | 2.0 | 1466 | $2,050 | $1.40 | 43d | 1 | 0.87mi |
| 1532 N New St Unit B Bethlehem, PA | 2.0 | 1.5 | 1100 | $1,845 | $1.68 | 2d | 1 | 0.89mi |
| 124 W Union Blvd Unit 214 Bethlehem, PA | 2.0 | 2.0 | 1000 | $2,120 | $2.12 | 23d | 1 | 0.94mi |
| 314 State St Bethlehem, PA | 4.0 | 2.0 | 1654 | $2,650 | $1.60 | 14d | 1 | 1.00mi |
| 610 E 3rd St Bethlehem, PA | 1.0–2.0 | 1.0–2.0 | 974 | $3,008 | $3.09 | 2d | 8 | 1.01mi |
| 1209 Mechanic St Bethlehem, PA | 3.0 | 1.0 | 1003 | $2,000 | $1.99 | 21d | 1 | 1.02mi |
Listing history 4 events
-
2026-06-15status $159,900 Pending 4 DOM
-
2026-06-15days on market $159,900 Active 4 DOM
-
2026-06-14remarks 382-char remark
-
2026-06-14$159,900 Active 2 DOM
ⓘ Source: listings_history table (triggers on properties + properties_extension) + one-shot
backfill from property_details.listing_events for pre-trigger history.
Tax reassessment forecast PA · Partial reset (capped growth)
- Current annual tax
- $3,127 · $261/mo
- Projected year-2 tax
- $3,127 · $261/mo
- Expected delta
- $0/yr ($0/mo · 0.0%)
ⓘ Screening estimate from a state-policy table — verify with the county assessor before closing.
Climate risk First Street
- Flood 1/10 Low FEMA zone X (unshaded) · 0% chance over 30 yrs
- Wildfire 1/10 Low
- Heat 5/10 Major 7 d/yr ≥99°F today · 15 d/yr by 30 yrs out
- Wind 4/10 Moderate 18% chance of damaging wind over 30 yrs
- Air quality 4/10 Moderate 3 unhealthy d/yr today · 6 by 30 yrs out
Nearby sold comps map
Loading sold comps map…
Walkable amenities ~0.75 mi
Loading nearby amenities…
Taxation est. · year 1
- Rental income
- $26,717
- − Mortgage interest
- −$8,957
- − Property taxes
- −$3,127
- − Insurance
- −$800
- − Repairs & maintenance
- −$2,137
- − Management
- −$2,137
- − Depreciation
- −$4,652
- Taxable income
- $4,908
- Est. tax owed @ 24.0%
- −$1,178
- After-tax cash flow
- $5,940/yr
For passive investors: Depreciation is non-cash, so a rental often shows a tax loss while cash-flowing — sheltering income. Rental losses are passive: they offset passive income freely, and up to $25,000/yr can offset ordinary (W-2) income if you actively participate and your MAGI is under $100k (phasing out to $0 by $150k); unused losses carry forward. On sale, claimed depreciation is recaptured at up to 25%, and gains may owe capital-gains tax (a 1031 exchange can defer both). Figures are a year-1 estimate at your 24.0% rate — not tax advice; consult a CPA.
Schools (NCES district)
- District
- Bethlehem Area SD
- NCES district ID
- 4203570
- Math proficiency
- 31% ▼ -2.00%
- Reading proficiency
- 49% ▼ -6.00%
- Median HH income
- $55,124
- Composite
- 34.92/100
- National rank
- #5068
- State rank
- #342 of 539 in PA
Livability — Bethlehem
- Score
- 82/100
- State rank
- #138
- US rank
- #1122
Category grades
Schools grade is shown separately in the Schools card above.
Census & demographics
- Census place
- Bethlehem, PA
- County
- Lehigh County · 333,019 people
- City population
- 129,661
- Metro
- Allentown-Bethlehem-Easton, PA-NJ
- Population (ZIP)
- 32,965
- Household income
- $75,417
- Rent vs Own
- Severe rent burden
- 1361.0
Population outlook (Northampton County) Hauer SSP2
- Today (2025)
- 312,227 people
- By 2030
- 314,769 · +0.8%
- By 2040
- 316,914 · +1.5%
- By 2050
- 318,037 · +1.9%
- By 2075
- 334,003 · +7.0%
- By 2100
- 344,696 · +10.4%
Race, ethnicity, and origin ACS 2023
- Neighborhood character
- Majority White (65%)
- Race & ethnicity
- White 65% Hispanic / Latino 24% Two or more races 10% Black 6% Asian 2%
- Hispanic origin (detail)
- Mexican 2% Puerto Rican 14% Dominican 3%
- Common ancestry
- Romanian 4% Italian 2% Polish 2%
- Foreign-born
- 9% · Canada, Jamaica, China
- Languages at home
- 81% English-only · Spanish 15% Other Indo-European 2%
Political lean MEDSL · Northampton
- 2024 margin
- Toss-up / Even · D 48.6% · R 50.4%
- 2008→2024 swing
- -14.1pp toward R · 2008: 12.3pp · 2024: -1.8pp
- All cycles
- 2024: R+1.8 2020: D+0.7 2016: R+3.8 2012: D+4.6 2008: D+12.3
Not yet ingested
- Civics
- —
Market trends
- HPI YoY
- ▼ -211.46%
- Current HPI
- 301.1699
- Rent YoY
- ▲ 0.85%
- Metro
- Allentown-Bethlehem-Easton, PA-NJ
- State GDP YoY
- ▲ 1.68%
- F500 in state
- 34
Industry mix (Fortune 500 HQ in PA)
| Industry | F500 HQs | Revenue |
|---|---|---|
| Healthcare | 2 | $309B |
|
||
| Insurance | 2 | $27B |
|
||
| Telecommunications / Media | 1 | $124B |
|
||
| Industrial Distribution | 1 | $22B |
|
||
| Financial Services | 1 | $20B |
|
||
| Chemicals / Materials | 1 | $18B |
|
||
Price history
+201.7% since first listed8 events — show timeline
- 2026-06-11 Listed $159,900 GLVRMLS
- 2006-07-14 Sold (MLS) $127,000 GLVRMLS
- 2006-07-13 Sold (Public Records) $127,000 Public Records
- 2006-06-11 Listed $125,000 GLVRMLS
- 2002-03-31 Listing Removed — GLVRMLS
- 2001-09-19 Listed $85,000 GLVRMLS
- 1993-04-01 Sold (Public Records) $72,000 Public Records
- 1987-08-01 Sold (Public Records) $53,000 Public Records
Property tax history
+1.5%/yrLatest (2026): $3,127 · +3.5% YoY. Source: county tax records.
Cash-flow waterfall
monthlySold comps — $/sqft
last 12 mo · ≤1 miLoading sold comps…