 Duplex
116 3rd St · Ithaca, NY
Flood risk 7/10 · Major
- FEMA flood zone
- X (shaded)
- Chance of flooding over 30 yrs
- 0.78%
- Est. flood insurance / yr
- $473 – $860
Fire risk 1/10 · Minimal
- Est. fire insurance / yr
- $691 – $1,283
Heat risk 3/10 · Minor
- Hot days now (above 94°F)
- 7 days/yr
- Hot days in 30 yrs
- 16 days/yr
Wind risk 1/10 · Minimal
- Chance of severe wind over 30 yrs
- 1.0%
Air-quality risk 2/10 · Minimal
- Unhealthy air days now
- 0 days/yr
- Unhealthy air days in 30 yrs
- 1 days/yr
Risk factors via First Street. Map © Google.
Why this score? — see what drove the B+ grade
The composite is a weighted blend of 9 inputs, each scored 0–100. Each bar is that input's sub-score; the figure is the points it added to the 100-point composite (weight × sub-score).
- Cash flow +30.0/30.0
- ARV discount +12.7/15.0
- 1% rule +10.0/10.0
- DSCR +10.0/10.0
- Schools +5.4/10.0
- Livability +3.9/5.0
- Rent growth +3.8/5.0
- Condition / age +2.2/5.0
- Appreciation +0.0/10.0
$432,450
🖨 Deal sheet 📄 Offer letter ✓ Due diligence
Multi-family units
County records classify this as Multi-Family (2-4 Unit). Listing-text estimate: 2 units. confirmed
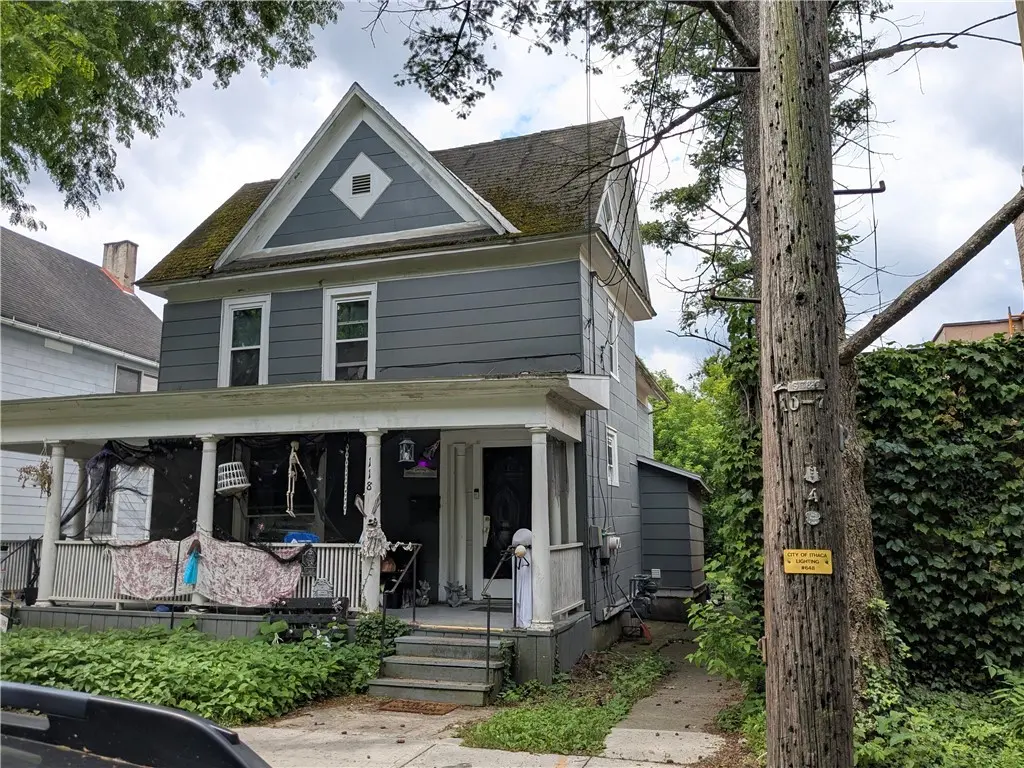
Listing remarks
Downtown Ithaca duplex with strong location appeal. Within walking distance of the Farmers Market, Cayuga Lake, Stewart Park, local dining, shopping, and nearby medical facilities, this well-maintained property offers convenience for tenants and owners alike. Regular updates throughout the interior help make this a turnkey investment opportunity. Walk to Red Feet, or out to dinner. The Park is also nearby! The science center beckons. Both units rented into 2027 Solid rental, great condition inside.
Key facts
- 5,410 sq ft lot
- Garage
- Built 1900
Property features AI
Finance
- Financial info: Income detail provided: two units each reporting $1,800 actual rent (total rent per unit listed as $1,800)
Exterior
- Parking: Garage (1 car) and gravel parking
- Utilities: Public water; Sewer connected; Water connected; Electricity connected
- Home design: Residential multi-family property; Two-story building
- Construction: Frame construction; Stone foundation
- Exterior features: Asphalt roof; Rectangular lot near public transit; Porch (in one unit)
Interior
- Kitchen: Oven/range and refrigerator included in units
- Bedrooms: Two 3-bedroom units (each unit has 3 bedrooms)
- Flooring: Hardwood; Laminate; Varies
- Bathrooms: Two full bathrooms and one half bathroom (total for property); Unit breakdown: one unit with 1 bath, one unit with 2 baths
- Heating & cooling: Forced air heating; Natural gas
- Interior features: Partial basement; Water heater; Hardwood and laminate flooring; varies by area; Green energy-efficient appliances and lighting
- Laundry & utility: Washer/dryer not specified
Neighborhood map
What this means for you Summary
Snapshot
- This is a 2 × 3-bed/1.2-bath units multifamily listed at $432k. Condition is rated fair.
Deal economics
- At list price, monthly cash flow is $2k ($26k/yr) — positive. Per door: $1k/mo.
- The deal already cash-flows at list — no discount required.
- Meets the 1% rule at list price ($7k rent vs $432k).
- Cap rate 12.4% vs local median 5.3% in Ithaca — top-decile yield for the area; either an underpriced asset or a hidden risk that comps aren't pricing in. Stress-test before assuming the spread holds.
Location & tenants
- Location reads 77/100 on livability (#210 in NY, #3,240 nationally) — a middle-class / working-renter tenant base. Strengths: amenities A+, commute A+, health & safety A+; Watch: housing C-, employment D+, cost of living D.
- Ithaca City School District (urban): math 57% / reading 71% proficiency, ranked #195 of 590 in NY (top 33%) — acceptable for families but not a draw, mixed tenant base, ~2y average lease.
- Zoned schools: Beverly J Martin Elementary School (math 15% / reading 34%, grade F, #1,825 of 2,108 statewide, top 88%, 274 students, 58% FRL); Boynton Middle School (math 36% / reading 64%, grade C, #261 of 729 statewide, top 36%, 526 students, 36% FRL); Ithaca Senior High School (math 95% / reading 95%, grade A+, #83 of 1,100 statewide, top 8%, 1,341 students, 31% FRL).
- Market conditions: Rents rising fast (+5.2%/yr); 327 active listings in the ZIP; 1 comparable units currently listed for rent nearby; 382 units permitted in Tompkins County in 2024 (208 in 5+ unit buildings).
- At $6,569/mo this rent would consume 110% of the median local household income ($71k/yr) (locally 5169% of renters already pay >50% of income on rent) — very limited rent-growth headroom before tenants either downsize or default.
Forward outlook
- Local home prices are declining (-3.0%/yr); year-one equity from $3k of loan paydown is wiped out by about $13k of value loss. Plan a longer hold.
- Tompkins County population projected at +17% by 2050 — long-run rental-demand tailwind backs the buy-and-hold thesis.
- At projected returns (-3.0% appreciation + 5.2% rent growth), your $121k cash investment doubles in ~6 years — after that, you're playing with house money.
Negotiation context
- Only 7 days on market — expect competitive offers; lowballing is unlikely to land.
Risks & watch-outs
- Watch-outs: flood insurance adds $56/mo; built in 1900 — expect roof / HVAC / electrical / plumbing capex.
- Climate carrying-cost: major flood risk — expect insurance premiums to compound above CPI over the hold.
Questions for the listing agent
- Can we see the unit-by-unit rent roll, current vacancy, and any below-market leases? What's the average tenancy length?
- What capital expenditures (roof, boiler, parking lot, exteriors) have been made in the last 5 years, and what's planned in the next 2?
- Have any recent inspections been done? Can we get a copy of the seller's disclosures and any deferred-maintenance estimates?
- Built in 1900 — when were the roof, HVAC, electrical panel, plumbing, and water heater last replaced?
- What's the actual annual flood-insurance premium (NFIP or private), and is the property in a SFHA with mandatory coverage?
- Is there a deadline driving the sale (1031 exchange, divorce, estate, relocation)? That informs how much negotiation room exists.
- Schools are A-rated — typically a magnet for longer-tenancy family renters. What's the average tenant stay here, and is there a school-zone premium baked into asking?
- What's the average days-on-market for RENTAL listings here right now (not sales)? A rising rental-DOM trend means longer vacancies and softer asking-rent achievability than the comps imply.
- What's the recent tenant-quality profile in this submarket — average credit score on applications, eviction rate, late-payment / NSF rate, and stable-employment percentage? A property-management company in the area should have these aggregated.
- How much new apartment / multifamily construction is in the pipeline within 1–3 miles? Heavy new supply (>2% of stock underway) typically softens rents 12–24 months out; light construction supports rent growth.
Investment metrics
- 1% rule
- 1.52% ✓
- Cap rate
- 12.40%
- Cash-on-cash
- 21.81%
- DSCR
- 1.97
- GRM
- 5.5
CMA / ARV
- ARV (on-the-fly)
- $489,474
- Comps found
- 6
Show comp detail 6 sales within ~0.75 mi
| Address | Dist | Beds/Ba | Sqft | Sold | Price | $/sf | Match |
|---|---|---|---|---|---|---|---|
| 607 N Cayuga St | 0.29mi | 5/4.0 (-1) | 2,296 (-0%) | 10mo | $495,000 | $216 | 67 |
| 206 Third St | 0.04mi | 6/2.0 | 2,600 (+13%) | 12mo | $415,000 | $160 | 64 |
| 817-819 N Cayuga St | 0.39mi | 6/3.0 | 2,482 (+8%) | 10mo | $529,000 | $213 | 57 |
| 402 S Plain St | 0.59mi | 5/2.5 (-1) | 2,140 (-7%) | 1mo | $430,000 | $201 | 55 |
| 842 N Aurora St | 0.53mi | 5/2.0 (-1) | 2,408 (+5%) | 9mo | $465,000 | $193 | 53 |
| 512 University Ave | 0.65mi | 6/3.0 | 2,535 (+10%) | 17mo | $570,000 | $225 | 36 |
Match score weights: distance 35% · size 25% · config 20% · recency 20%. Top-matched comps best support the ARV.
Projected returns pro-forma
-3.0% appreciation · 5.22% rent growth · sell at horizon
- IRR
- 16.3%
- Equity multiple
- 1.67×
- Total profit
- $81,697
- Equity at exit
- $64,480
- IRR
- 26.5%
- Equity multiple
- 3.58×
- Total profit
- $312,035
- Equity at exit
- $37,390
Cash invested: $121,086 (down + closing). Projections, not guarantees.
Landlord ↔ Tenant lean methodology
- Overall (STATE)
- 15 Strongly Tenant-Friendly
- State New York
- 15 Strongly Tenant-Friendly · D+10
- County
- — inherits STATE
- City
- — inherits STATE
ZIP-level market 14850
- Rents YoY
- 5.2%
- Active inventory
- 327
- Price-to-rent
- 11.0×
Monthly cashflow live
- Estimated rent
- $6,569 high interval (Pro) →
- Mortgage (P&I)
- −$2,268
- Tax est. 1.5%
- −$541 /mo · $6,487/yr
- Insurance
- −$180
- Flood insurance flood zone
- −$56 /mo · $666/yr
- HOA
- −$0
- Vacancy / Maint / Mgmt
- −$1,379
- Net cashflow
- $2,145
Break-even live
2-unit breakdown (identical units grouped — click to expand)
| Units | Beds | Baths | Est. rent |
|---|---|---|---|
| 2× units | 3 | 1.2 | $6,570 |
| #1 | 3 | 1.2 | $3,285 |
| #2 | 3 | 1.2 | $3,285 |
| Total (2 units) | $6,569 | ||
UW: 25.0% down · 7.5% · 30yr · 1.5% tax · 5.0% vac · 8.0% maint · 8.0% mgmt
Financing live
Cash to close
- Down payment
- $108,112
- Closing costs
- $12,974
- Reserves months
- —
- Total cash needed
- —
Loan-product check · same deal, 3 products live
Conventional
25% down · 7.5% · 30yr
- Down + closing
- —
- Monthly P&I
- —
- Monthly cashflow
- —
- DSCR
- —
- Eligible?
- —
Personal DTI + credit; lowest rate.
DSCR
20% down · 8.5% · 30yr
- Down + closing
- —
- Monthly P&I
- —
- Monthly cashflow
- —
- DSCR
- —
- Eligible?
- —
No personal income docs; deal must DSCR.
Hard money
10% down · 12.0% · 12mo
- Down + closing
- —
- Monthly P&I
- —
- Monthly cashflow
- —
- DSCR
- —
- Eligible?
- —
Short-term bridge; refi at stabilization.
Rent comps 1 comps
| Address | Beds | Baths | Sqft | Rent | $/sqft | DOM | Units | Dist |
|---|---|---|---|---|---|---|---|---|
| 126 College Ave Ithaca, NY | 6.0 | 2.0 | 1658 | $4,400 | $2.65 | 43d | 5 | 1.05mi |
Listing history 8 events
-
2026-06-19days on market $432,450 Active 7 DOM
-
2026-06-18days on market $432,450 Active 6 DOM
-
2026-06-18remarks 503-char remark
-
2026-06-17days on market $432,450 Active 5 DOM
-
2026-06-16days on market $432,450 Active 4 DOM
-
2026-06-15days on market $432,450 Active 3 DOM
-
2026-06-13remarks 474-char remark
-
2026-06-13$432,450 Active 1 DOM
ⓘ Source: listings_history table (triggers on properties + properties_extension) + one-shot
backfill from property_details.listing_events for pre-trigger history.
Climate risk First Street
- Flood 7/10 Severe FEMA zone X (shaded) · 78% chance over 30 yrs
- Wildfire 1/10 Low
- Heat 3/10 Moderate 7 d/yr ≥94°F today · 16 d/yr by 30 yrs out
- Wind 1/10 Low 100% chance of damaging wind over 30 yrs
- Air quality 2/10 Low 0 unhealthy d/yr today · 1 by 30 yrs out
Nearby sold comps map
Loading sold comps map…
Walkable amenities ~0.75 mi
Loading nearby amenities…
Taxation est. · year 1
- Rental income
- $78,828
- − Mortgage interest
- −$24,224
- − Property taxes
- −$6,487
- − Insurance
- −$2,829
- − Repairs & maintenance
- −$6,306
- − Management
- −$6,306
- − Depreciation
- −$12,580
- Taxable income
- $20,096
- Est. tax owed @ 24.0%
- −$4,823
- After-tax cash flow
- $20,922/yr
For passive investors: Depreciation is non-cash, so a rental often shows a tax loss while cash-flowing — sheltering income. Rental losses are passive: they offset passive income freely, and up to $25,000/yr can offset ordinary (W-2) income if you actively participate and your MAGI is under $100k (phasing out to $0 by $150k); unused losses carry forward. On sale, claimed depreciation is recaptured at up to 25%, and gains may owe capital-gains tax (a 1031 exchange can defer both). Figures are a year-1 estimate at your 24.0% rate — not tax advice; consult a CPA.
Condition & rehab AI · 8 photos
This two-unit property requires significant exterior repairs and maintenance to improve its condition and value.
Repairs flagged
- Major Paint — Peeling paint on the front porch and siding
- Major Roof — Signs of moss and possible water damage
- Major Flooring — Concrete porch with visible cracks
Value-add opportunities
- Both Paint the exterior and roof — Improves curb appeal and value
- Both Repair the concrete porch — Enhances safety and aesthetics
- Rental Replace Halloween decorations with neutral ones — Attracts tenants and maintains a neutral appearance
Renovation cost estimate screening
| Repair item | Severity | Est. cost |
|---|---|---|
| Paint · Peeling paint on the front porch and siding | Major | $15,000–50,000 |
| Roof · Signs of moss and possible water damage | Major | $15,000–50,000 |
| Flooring · Concrete porch with visible cracks | Major | $15,000–50,000 |
| Total estimated repair cost · 3 items | $45,000–150,000 |
Value-add ROI direction
- Both Paint the exterior and roof — Improves curb appeal and value ↑
- Both Repair the concrete porch — Enhances safety and aesthetics ↑
- Rental Replace Halloween decorations with neutral ones — Attracts tenants and maintains a neutral appearance ↑
ⓘ Cost ranges are severity-bucket heuristics (US national rule-of-thumb). Get contractor quotes + a written scope before underwriting a rehab budget.
Schools (NCES district)
- District
- Ithaca City School District
- NCES district ID
- 3615570
- Math proficiency
- 57% ▼ -5.00%
- Reading proficiency
- 71% ▲ 11.00%
- Median HH income
- $46,528
- Composite
- 54.01/100
- National rank
- #1397
- State rank
- #195 of 590 in NY
Livability — Ithaca
- Score
- 77/100
- State rank
- #210
- US rank
- #3240
Category grades
Schools grade is shown separately in the Schools card above.
Census & demographics
- Census place
- Ithaca, NY
- County
- Tompkins County · 68,610 people
- City population
- 68,610
- Metro
- Ithaca, NY
- Population (ZIP)
- 68,610
- Household income
- $71,445
- Rent vs Own
- Severe rent burden
- 5169.0
Population outlook (Tompkins County) Hauer SSP2
- Today (2025)
- 113,958 people
- By 2030
- 118,774 · +4.2%
- By 2040
- 125,927 · +10.5%
- By 2050
- 133,599 · +17.2%
- By 2075
- 156,759 · +37.6%
- By 2100
- 169,896 · +49.1%
Race, ethnicity, and origin ACS 2023
- Neighborhood character
- Predominantly White (68%)
- Race & ethnicity
- White 68% Asian 13% Hispanic / Latino 8% Two or more races 8% Black 4%
- Hispanic origin (detail)
- Mexican 2% Puerto Rican 2%
- Common ancestry
- Romanian 3% Italian 3% Scotch-Irish 2%
- Foreign-born
- 18% · China, Canada, South Korea
- Languages at home
- 79% English-only · Chinese 5% Spanish 4% Other Indo-European 4%
Political lean MEDSL · Tompkins
- 2024 margin
- Solid D (+50.6) · D 75.3% · R 24.7%
- 2008→2024 swing
- +8.6pp toward D · 2008: 42.1pp · 2024: 50.6pp
- All cycles
- 2024: D+50.6 2020: D+49.2 2016: D+42.1 2012: D+39.8 2008: D+42.1
Not yet ingested
- Civics
- —
Market trends
- HPI YoY
- ▼ -276.59%
- Current HPI
- 389.7215
- Rent YoY
- ▲ 5.22%
- Metro
- Ithaca, NY
- State GDP YoY
- ▲ 2.60%
- F500 in state
- 92
Industry mix (Fortune 500 HQ in NY)
| Industry | F500 HQs | Revenue |
|---|---|---|
| Financial Services | 10 | $950B |
|
||
| Consumer Goods | 9 | $162B |
|
||
| Insurance | 4 | $225B |
|
||
| Telecommunications | 2 | $144B |
|
||
| Pharmaceuticals | 2 | $112B |
|
||
| Media / Entertainment | 2 | $69B |
|
||
Price history
1 event — show timeline
- 2026-06-13 Listed $432,450 IBRMLS
Cash-flow waterfall
monthlySold comps — $/sqft
last 12 mo · ≤1 miLoading sold comps…