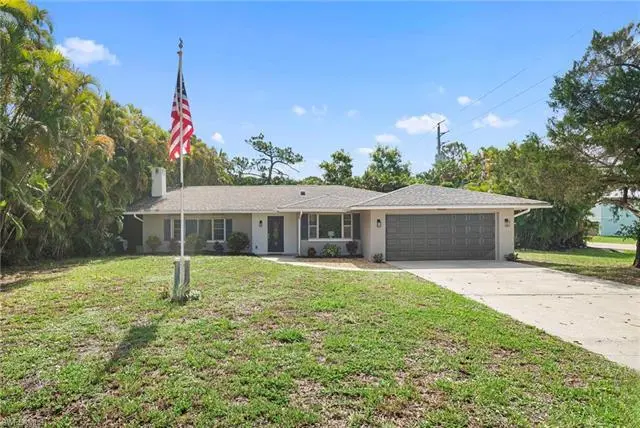
4688 Pembrooke Ln · Bonita Springs, FL
Flood risk 9/10 · Severe
- FEMA flood zone
- AE
- Chance of flooding over 30 yrs
- 0.99%
- Est. flood insurance / yr
- $1,737 – $8,500
Fire risk 3/10 · Minor
- Est. fire insurance / yr
- $947 – $1,759
Heat risk 10/10 · Severe
- Hot days now (above 107°F)
- 7 days/yr
- Hot days in 30 yrs
- 29 days/yr
Wind risk 10/10 · Severe
- Chance of severe wind over 30 yrs
- 99.0%
Air-quality risk 3/10 · Minor
- Unhealthy air days now
- 2 days/yr
- Unhealthy air days in 30 yrs
- 2 days/yr
Risk factors via First Street. Map © Google.
Why this score? — see what drove the B+ grade
The composite is a weighted blend of 9 inputs, each scored 0–100. Each bar is that input's sub-score; the figure is the points it added to the 100-point composite (weight × sub-score).
- Cash flow +30.0/30.0
- ARV discount +15.0/15.0
- DSCR +10.0/10.0
- 1% rule +8.9/10.0
- Schools +4.1/10.0
- Livability +3.5/5.0
- Rent growth +3.2/5.0
- Condition / age +2.5/5.0
- Appreciation +0.0/10.0
$449,900
🖨 Deal sheet 📄 Offer letter ✓ Due diligence
Listing remarks MLS
Great location in one of the most sought after neighborhoods in Bonita Springs! Right off Coconut Road, a stone's throw away from the Hyatt, and the Ritz-Carlton Luxury Residences currently under construction. The house has been completely renovated. You can relax all day in the pool, or spend some time in the nearby Promenade at Bonita Bay. You have a very large yard on this oversized corner lot, and there's no HOA! Yard also has an irrigation system. Grab this one while you still can!
Key facts
- Private road
- New a c system
- Brand new roof
Tags
Property features AI
Finance
- Other: Corner lot, regular shape; Lot area approximately 0.324 acres; Subdivision: Estero Bay Shores
- HOA & community: No HOA maintenance or amenities; Community type: Boating
Exterior
- Parking: Attached 2-car garage
- Utilities: Central water; Central sewer; Cable available
- Home design: Single family home; One-story ranch; Rear exposure to the east; Residential property
- Construction: Concrete block construction; Stucco exterior; Shingle roof; Built in 1979
- Exterior features: Patio; Landscaped area view; Private below-ground concrete pool; Single-hung windows
Interior
- Kitchen: Refrigerator/Freezer included
- Bedrooms: 3 bedrooms
- Flooring: Tile
- Bathrooms: 2 full bathrooms; Master bath with separate tub and shower
- Heating & cooling: Central electric heat; Central electric cooling; Ceiling fans
- Interior features: Built-in cabinets; Cable prewire; Family room; Split bedroom floor plan
- Laundry & utility: Washer/dryer hookup; Auto garage door opener
Neighborhood map
What this means for you Summary
Snapshot
- This is a 3-bed/2.0-bath single-family listed at $450k.
Deal economics
- At list price, monthly cash flow is $1k ($17k/yr) — positive.
- The deal already cash-flows at list — no discount required.
- Meets the 1% rule at list price ($6k rent vs $450k).
- Cap rate 11.3% vs local median 1.7% in Bonita Springs — top-decile yield for the area; either an underpriced asset or a hidden risk that comps aren't pricing in. Stress-test before assuming the spread holds.
Location & tenants
- Location reads 70/100 on livability (#428 in FL) — a middle-class / working-renter tenant base. Strengths: crime A+, housing A+, employment A; Watch: schools C-, cost of living C-, health & safety D.
- Lee (suburban): math 47% / reading 50% proficiency, ranked #42 of 73 in FL (top 58%) — families likely to look elsewhere, expect single-tenant / working-renter base with shorter leases.
- Market conditions: Rents rising (+2.9%/yr); 699 active listings in the ZIP; 40 comparable units currently listed for rent nearby; rentals at typical pace (median 24d on market — plan ~3-4 weeks tenant-placement turnaround); high-income renter base; 15,411 units permitted in Lee County in 2024 (4,686 in 5+ unit buildings).
- At $6,272/mo this rent would consume 58% of the median local household income ($131k/yr) (locally 554% of renters already pay >50% of income on rent) — very limited rent-growth headroom before tenants either downsize or default.
Forward outlook
- Local home prices are declining (-3.0%/yr); year-one equity from $3k of loan paydown is wiped out by about $13k of value loss. Plan a longer hold.
- Lee County population projected at +44% by 2050 — long-run rental-demand tailwind backs the buy-and-hold thesis.
- At projected returns (-3.0% appreciation + 2.9% rent growth), your $126k cash investment doubles in ~9 years — after that, you're playing with house money.
Negotiation context
- Only 3 days on market — expect competitive offers; lowballing is unlikely to land.
- 4 sale attempts since 3y ago with the ask held roughly flat each time — persistent listings suggest the price (not the market) is what's stuck; bring a comps-based counter.
- Current owner paid $260k; list at $450k implies a 73% gain — meaningful room to come down on a strong offer.
Risks & watch-outs
- Watch-outs: flood insurance adds $427/mo.
- Climate carrying-cost: in FEMA flood zone AE (mandatory federal flood insurance); severe wind risk, 99% chance of damaging wind over 30y; extreme-heat days projected 7→29/yr by 2055 (HVAC capex compounding) — expect insurance premiums to compound above CPI over the hold.
Questions for the listing agent
- Built in 1979 — when were the roof, HVAC, electrical panel, plumbing, and water heater last replaced?
- What's the actual annual flood-insurance premium (NFIP or private), and is the property in a SFHA with mandatory coverage?
- Is there a deadline driving the sale (1031 exchange, divorce, estate, relocation)? That informs how much negotiation room exists.
- What's the average days-on-market for RENTAL listings here right now (not sales)? A rising rental-DOM trend means longer vacancies and softer asking-rent achievability than the comps imply.
- What's the recent tenant-quality profile in this submarket — average credit score on applications, eviction rate, late-payment / NSF rate, and stable-employment percentage? A property-management company in the area should have these aggregated.
- How much new for-sale + rental construction is in the pipeline within 1–3 miles? Heavy new supply typically softens prices + rents 12–24 months out; constrained supply supports both.
Investment metrics
- 1% rule
- 1.39% ✓
- Cap rate
- 11.26%
- Cash-on-cash
- 17.75%
- DSCR
- 1.79
- GRM
- 6.0
CMA / ARV
- ARV (on-the-fly)
- $579,985
- Comps found
- 2
Show comp detail 2 sales within ~0.75 mi
| Address | Dist | Beds/Ba | Sqft | Sold | Price | $/sf | Match |
|---|---|---|---|---|---|---|---|
| 4694 Pembrooke Ln | 0.01mi | 3/3.0 | 1,426 (-10%) | 8mo | $520,000 | $365 | 72 |
| 4713 Fiji Ln | 0.39mi | 2/2.5 (-1) | 1,560 (-2%) | 14mo | $121,000 | $78 | 60 |
Match score weights: distance 35% · size 25% · config 20% · recency 20%. Top-matched comps best support the ARV.
Projected returns pro-forma
-3.0% appreciation · 2.85% rent growth · sell at horizon
- IRR
- 3.7%
- Equity multiple
- 1.14×
- Total profit
- $18,017
- Equity at exit
- $67,082
- IRR
- 13.1%
- Equity multiple
- 2.04×
- Total profit
- $131,074
- Equity at exit
- $38,899
Cash invested: $125,972 (down + closing). Projections, not guarantees.
Landlord ↔ Tenant lean methodology
- Overall (STATE)
- 87 Strongly Landlord-Friendly
- State Florida
- 87 Strongly Landlord-Friendly · R+3
- County
- — inherits STATE
- City
- — inherits STATE
ZIP-level market 34134
- Rents YoY
- 2.9%
- Active inventory
- 699
- Price-to-rent
- 6.0×
Monthly cashflow live
- Estimated rent
- $6,272 high interval (Pro) →
- Mortgage (P&I)
- −$2,359
- Tax from tax record
- −$545 /mo · $6,538/yr
- Insurance
- −$187
- Flood insurance flood zone
- −$427 /mo · $5,118/yr
- HOA
- −$0
- Vacancy / Maint / Mgmt
- −$1,317
- Net cashflow
- $1,437
Break-even live
UW: 25.0% down · 7.5% · 30yr · 1.5% tax · 5.0% vac · 8.0% maint · 8.0% mgmt
Financing live
Cash to close
- Down payment
- $112,475
- Closing costs
- $13,497
- Reserves months
- —
- Total cash needed
- —
Loan-product check · same deal, 3 products live
Conventional
25% down · 7.5% · 30yr
- Down + closing
- —
- Monthly P&I
- —
- Monthly cashflow
- —
- DSCR
- —
- Eligible?
- —
Personal DTI + credit; lowest rate.
DSCR
20% down · 8.5% · 30yr
- Down + closing
- —
- Monthly P&I
- —
- Monthly cashflow
- —
- DSCR
- —
- Eligible?
- —
No personal income docs; deal must DSCR.
Hard money
10% down · 12.0% · 12mo
- Down + closing
- —
- Monthly P&I
- —
- Monthly cashflow
- —
- DSCR
- —
- Eligible?
- —
Short-term bridge; refi at stabilization.
Rent comps 40 comps
| Address | Beds | Baths | Sqft | Rent | $/sqft | DOM | Units | Dist |
|---|---|---|---|---|---|---|---|---|
| 4700 Leilani Ln Bonita Springs, FL | 2.0 | 2.0 | 1380 | $5,000 | $3.62 | 23d | 1 | 0.11mi |
| 4715 Swordfish St Bonita Springs, FL | 4.0 | 2.5 | 1940 | $4,395 | $2.27 | 11d | 1 | 0.18mi |
| 4715 Swordfish St Bonita Springs, FL | 4.0 | 2.5 | 1940 | $7,795 | $4.02 | 23d | 1 | 0.18mi |
| 4709 Kon Tiki Ln Bonita Springs, FL | 2.0 | 2.0 | 1475 | $1,500 | $1.02 | 23d | 1 | 0.29mi |
| 4161 Sawgrass Point Dr #101 Bonita Springs, FL | 2.0 | 2.0 | 1445 | $5,500 | $3.81 | 23d | 1 | 0.50mi |
| 4161 Sawgrass Point Dr #101 Bonita Springs, FL | 2.0 | 2.0 | 1445 | $5,500 | $3.81 | 21d | 1 | 0.50mi |
| 24420 Reserve Ct #202 Bonita Springs, FL | 3.0 | 2.0 | 2244 | $8,000 | $3.57 | 23d | 1 | 0.50mi |
| 4201 Sawgrass Point Dr #102 Bonita Springs, FL | 2.0 | 2.0 | 1319 | $5,000 | $3.79 | 23d | 1 | 0.52mi |
| 23850 Via Italia Cir #204 Estero, FL | 3.0 | 3.0 | 2086 | $11,000 | $5.27 | 3d | 1 | 0.54mi |
| 23850 Via Italia Cir #204 Estero, FL | 3.0 | 3.0 | 2086 | $7,000 | $3.36 | 23d | 1 | 0.54mi |
| 23850 Via Italia Cir #404 Estero, FL | 3.0 | 3.0 | 2085 | $11,000 | $5.28 | 23d | 1 | 0.54mi |
| 4200 Sawgrass Point Dr #101 Bonita Springs, FL | 2.0 | 2.0 | 1445 | $5,250 | $3.63 | 23d | 1 | 0.56mi |
| 24300 Sandpiper Isle Way #201 Bonita Springs, FL | 3.0 | 2.5 | 1887 | $7,500 | $3.97 | 23d | 1 | 0.63mi |
| 25151 Bay Cedar Dr Bonita Springs, FL | 2.0 | 2.0 | 1738 | $11,000 | $6.33 | 1d | 1 | 0.68mi |
| 23650 Via Veneto Blvd #1602 Estero, FL | 2.0 | 2.5 | 1818 | $8,000 | $4.40 | 23d | 1 | 0.68mi |
| 24361 Sandpiper Isle Way #401 Bonita Springs, FL | 2.0 | 2.0 | 1807 | $8,000 | $4.43 | 23d | 1 | 0.72mi |
| 24360 Sandpiper Isle Way #101 Bonita Springs, FL | 2.0 | 2.0 | 1666 | $6,500 | $3.90 | 23d | 1 | 0.73mi |
| 23540 Via Veneto Blvd #1702 Bonita Springs, FL | 3.0 | 3.0 | 1910 | $12,500 | $6.54 | 23d | 1 | 0.85mi |
| 23540 Via Veneto Blvd #804 Estero, FL | 2.0 | 2.5 | 1910 | $11,000 | $5.76 | 23d | 1 | 0.85mi |
| 25130 Sandpiper Greens Ct #104 Bonita Springs, FL | 2.0 | 2.0 | 1392 | $6,500 | $4.67 | 23d | 1 | 0.91mi |
| 24827 Lakemont Cove Ln #101 Bonita Springs, FL | 2.0 | 2.0 | 1552 | $6,750 | $4.35 | 23d | 1 | 1.06mi |
| 24821 Lakemont Cove Ln #201 Bonita Springs, FL | 3.0 | 2.0 | 1633 | $7,000 | $4.29 | 23d | 1 | 1.09mi |
| 24821 Lakemont Cove Ln #202 Bonita Springs, FL | 3.0 | 2.0 | 1658 | $5,000 | $3.02 | 21d | 1 | 1.09mi |
| 24821 Lakemont Cove Ln #101 Bonita Springs, FL | 2.0 | 2.0 | 1203 | $6,500 | $5.40 | 23d | 1 | 1.09mi |
| 3578 Heron Cove Ct Bonita Springs, FL | 3.0 | 3.0 | 2185 | $9,000 | $4.12 | 23d | 1 | 1.16mi |
| 23272 E Eldorado Ave Unit 1073519P Bonita Springs, FL | 4.0 | 2.0 | 1786 | $8,737 | $4.89 | 21d | 1 | 1.19mi |
| 3441 Morning Lake Dr #202 Estero, FL | 3.0 | 2.5 | 2045 | $6,000 | $2.93 | 10d | 1 | 1.22mi |
| 4649 Santiago Ln Bonita Springs, FL | 3.0 | 2.0 | 1625 | $2,600 | $1.60 | 23d | 1 | 1.30mi |
| 4649 Santiago Ln Bonita Springs, FL | 3.0 | 2.0 | 1625 | $2,600 | $1.60 | 13d | 1 | 1.30mi |
| 3451 Ballybridge Cir #103 Bonita Springs, FL | 3.0 | 2.0 | 1703 | $6,500 | $3.82 | 23d | 1 | 1.34mi |
| 23680 Walden Center Dr #107 Estero, FL | 2.0 | 2.0 | 1052 | $1,900 | $1.81 | 3d | 1 | 1.34mi |
| 23640 Walden Center Dr #106 Estero, FL | 2.0 | 2.0 | 1052 | $1,850 | $1.76 | 1d | 1 | 1.36mi |
| 23710 Walden Center Dr #308 Estero, FL | 3.0 | 2.0 | 1355 | $3,000 | $2.21 | 23d | 1 | 1.38mi |
| 23520 Walden Center Dr #308 Estero, FL | 2.0 | 2.0 | 1239 | $2,000 | $1.61 | 23d | 1 | 1.41mi |
| 23520 Walden Center Dr #308 Estero, FL | 2.0 | 2.0 | 1239 | $2,000 | $1.61 | 3d | 1 | 1.41mi |
| 23500 Walden Center Dr Estero, FL | 1.0–2.0 | 1.0–2.0 | 803 | $2,800 | $3.48 | 16d | 3 | 1.41mi |
| 4665 Key Largo Ln Bonita Springs, FL | 3.0 | 2.0 | 1880 | $12,000 | $6.38 | 23d | 1 | 1.42mi |
| 4600 Key Largo Ln Bonita Springs, FL | 4.0 | 2.0 | 2000 | $5,250 | $2.62 | 23d | 1 | 1.45mi |
| 4600 Key Largo Ln Bonita Springs, FL | 4.0 | 2.0 | 2000 | $5,250 | $2.62 | 3d | 1 | 1.45mi |
| 3401 Tralee Ct #202 Bonita Springs, FL | 3.0 | 2.0 | 2184 | $7,500 | $3.43 | 23d | 1 | 1.45mi |
Listing history 4 events
-
2026-06-18days on market $449,900 Active 3 DOM
-
2026-06-17days on market $449,900 Active 2 DOM
-
2026-06-16remarks 699-char remark
-
2026-06-16$449,900 Active 1 DOM
ⓘ Source: listings_history table (triggers on properties + properties_extension) + one-shot
backfill from property_details.listing_events for pre-trigger history.
Tax reassessment forecast FL · Resets to sale price
- Current annual tax
- $6,538 · $545/mo
- Projected year-2 tax
- $6,538 · $545/mo
- Expected delta
- $0/yr ($0/mo · 0.0%)
ⓘ Screening estimate from a state-policy table — verify with the county assessor before closing.
Climate risk First Street
- Flood 9/10 Extreme FEMA zone AE · 99% chance over 30 yrs
- Wildfire 3/10 Moderate
- Heat 10/10 Extreme 7 d/yr ≥107°F today · 29 d/yr by 30 yrs out
- Wind 10/10 Extreme 99% chance of damaging wind over 30 yrs
- Air quality 3/10 Moderate 2 unhealthy d/yr today · 2 by 30 yrs out
Nearby sold comps map
Loading sold comps map…
Walkable amenities ~0.75 mi
Loading nearby amenities…
Taxation est. · year 1
- Rental income
- $75,268
- − Mortgage interest
- −$25,201
- − Property taxes
- −$6,538
- − Insurance
- −$7,368
- − Repairs & maintenance
- −$6,021
- − Management
- −$6,021
- − Depreciation
- −$13,088
- Taxable income
- $11,029
- Est. tax owed @ 24.0%
- −$2,647
- After-tax cash flow
- $14,596/yr
For passive investors: Depreciation is non-cash, so a rental often shows a tax loss while cash-flowing — sheltering income. Rental losses are passive: they offset passive income freely, and up to $25,000/yr can offset ordinary (W-2) income if you actively participate and your MAGI is under $100k (phasing out to $0 by $150k); unused losses carry forward. On sale, claimed depreciation is recaptured at up to 25%, and gains may owe capital-gains tax (a 1031 exchange can defer both). Figures are a year-1 estimate at your 24.0% rate — not tax advice; consult a CPA.
Schools (NCES district)
- District
- Lee
- NCES district ID
- 1201080
- Math proficiency
- 47% ▼ -11.00%
- Reading proficiency
- 50% ▼ -4.00%
- Median HH income
- $49,518
- Composite
- 41.49/100
- National rank
- #3458
- State rank
- #42 of 73 in FL
Livability — Bonita Springs
- Score
- 70/100
- State rank
- #428
- US rank
- #7576
Category grades
Schools grade is shown separately in the Schools card above.
Census & demographics
- Census place
- Bonita Springs, FL
- County
- Lee County · 788,662 people
- City population
- 64,727
- Metro
- Cape Coral-Fort Myers, FL
- Population (ZIP)
- 16,475
- Household income
- $130,719
- Rent vs Own
- Severe rent burden
- 554.0
Population outlook (Lee County) Hauer SSP2
- Today (2025)
- 871,946 people
- By 2030
- 955,468 · +9.6%
- By 2040
- 1,113,587 · +27.7%
- By 2050
- 1,256,891 · +44.1%
- By 2075
- 1,560,270 · +78.9%
- By 2100
- 1,726,848 · +98.0%
Race, ethnicity, and origin ACS 2023
- Neighborhood character
- Predominantly White (91%)
- Race & ethnicity
- White 91% Hispanic / Latino 5% Two or more races 3% Asian 1%
- Common ancestry
- Slovak 5% Romanian 4% Serbian 2%
- Foreign-born
- 10% · Canada, Jamaica
- Languages at home
- 91% English-only · Spanish 4% German/W. Germanic 1% Other Indo-European 1%
Political lean MEDSL · Lee
- 2024 margin
- Strong R (+28.4) · D 35.5% · R 63.9%
- 2008→2024 swing
- -18.0pp toward R · 2008: -10.4pp · 2024: -28.4pp
- All cycles
- 2024: R+28.4 2020: R+19.2 2016: R+20.4 2012: R+16.6 2008: R+10.4
Not yet ingested
- Civics
- —
Market trends
- HPI YoY
- ▼ -236.48%
- Current HPI
- 237.4416
- Rent YoY
- ▲ 2.85%
- Metro
- Cape Coral-Fort Myers, FL
- State GDP YoY
- ▲ 3.28%
- F500 in state
- 36
Industry mix (Fortune 500 HQ in FL)
| Industry | F500 HQs | Revenue |
|---|---|---|
| Industrial Technology | 2 | $29B |
|
||
| Insurance | 2 | $17B |
|
||
| Retail | 1 | $60B |
|
||
| Technology Distribution | 1 | $58B |
|
||
| Homebuilding | 1 | $35B |
|
||
| Technology Manufacturing | 1 | $35B |
|
||
Price history
+2149.5% since first listed13 events — show timeline
- 2026-06-15 Listed $449,900 BEARMLS
- 2026-04-21 Sold (MLS) $260,000 BEARMLS
- 2026-03-26 Price Changed $260,000 BEARMLS
- 2026-03-03 Pending — BEARMLS
- 2025-10-02 Relisted — BEARMLS
- 2025-03-10 Price Changed $449,000 BEARMLS
- 2024-08-06 Price Changed $524,500 BEARMLS
- 2023-12-07 Price Changed $589,000 BEARMLS
- 2023-10-16 Price Changed $624,500 BEARMLS
- 2023-06-30 Relisted — BEARMLS
- 2023-05-30 Listed $649,900 BEARMLS
- 1997-02-21 Sold (Public Records) $105,000 Public Records
- 1989-03-01 Sold (Public Records) $20,000 Public Records
Property tax history
+18.1%/yrLatest (2025): $6,538 · +441.3% YoY. Source: county tax records.
Cash-flow waterfall
monthlySold comps — $/sqft
last 12 mo · ≤1 miLoading sold comps…