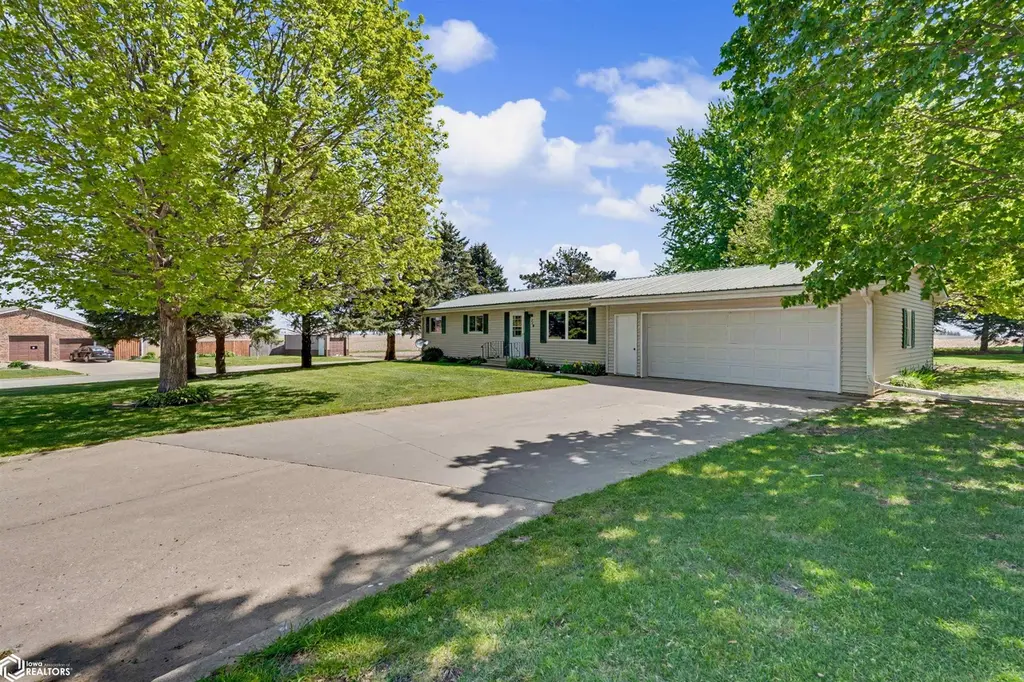
110 Sunrise Dr · Lincoln, IA
Flood risk 1/10 · Minimal
- FEMA flood zone
- X (unshaded)
- Chance of flooding over 30 yrs
- 0.0%
- Est. flood insurance / yr
- $473 – $860
Fire risk 1/10 · Minimal
- Est. fire insurance / yr
- $902 – $1,676
Heat risk 2/10 · Minimal
- Hot days now (above 102°F)
- 7 days/yr
- Hot days in 30 yrs
- 16 days/yr
Wind risk 2/10 · Minimal
- Chance of severe wind over 30 yrs
- —
Air-quality risk 1/10 · Minimal
- Unhealthy air days now
- 0 days/yr
- Unhealthy air days in 30 yrs
- 0 days/yr
Risk factors via First Street. Map © Google.
Why this score? — see what drove the B- grade
The composite is a weighted blend of 9 inputs, each scored 0–100. Each bar is that input's sub-score; the figure is the points it added to the 100-point composite (weight × sub-score).
- Cash flow +25.0/30.0
- ARV discount +9.7/15.0
- DSCR +8.2/10.0
- Schools +6.4/10.0
- 1% rule +6.0/10.0
- Appreciation +4.8/10.0
- Livability +3.2/5.0
- Rent growth +2.5/5.0
- Condition / age +2.5/5.0
$92,500
🖨 Deal sheet 📄 Offer letter ✓ Due diligence
Listing remarks
Charming ranch home in the lovely community of Lincoln! Enjoy all main floor living in this spacious ranch home, complete with three bedrooms, one bathroom, main floor laundry, an attached two car garage, and more! This home boasts a large corner lot with beautiful mature trees. Out back, you're sure to enjoy the concrete patio, perfect for summer entertaining and relaxing! To make this home even more appealing, you'll have the added benefit of an all metal roof! Call today to schedule your your of this wonderful home!
Key facts
- All metal roof
- Large corner lot
- Concrete patio
Tags
Property features AI
Exterior
- Parking: Attached 2-car garage
- Utilities: Public water; Public sewer
- Home design: Single-family residence; Residential property
- Construction: Vinyl siding
- Exterior features: Metal roof
Interior
- Kitchen: Range; Microwave; Dishwasher; Refrigerator
- Bathrooms: One three-quarter bathroom
- Heating & cooling: Forced air heating; Central air conditioning
- Interior features: Accessible full bath; Basement
- Laundry & utility: Washer; Dryer
Neighborhood map
What this means for you Summary
Snapshot
- This is a 3-bed/1.5-bath single-family listed at $92k.
Deal economics
- At list price, monthly cash flow is $202 ($2k/yr) — positive.
- The deal already cash-flows at list — no discount required.
- Meets the 1% rule at list price ($1k rent vs $92k).
Location & tenants
- Location reads 64/100 on livability (#609 in IA) — a middle-class / working-renter tenant base. Strengths: cost of living A+, housing A+; Watch: schools F, amenities F, commute F.
- Gladbrook-Reinbeck Community School District (rural): math 76% / reading 74% proficiency, ranked #71 of 289 in IA (top 25%) — strong family-tenant draw, lease renewals of 3-5y typical.
- Market conditions: 1 active listings in the ZIP; 17 units permitted in Tama County in 2024 (0 in 5+ unit buildings).
Forward outlook
- In year one you build about $267 of equity ($640 loan paydown + $-373 appreciation (-0.4% local appreciation)).
- Tama County population projected at -15% by 2050 — secular population decline; favor cash flow + early exit over multi-decade hold.
- At projected returns (-0.4% appreciation + 3.0% rent growth), your $26k cash investment doubles in ~8 years — after that, you're playing with house money.
Negotiation context
- Only 8 days on market — expect competitive offers; lowballing is unlikely to land.
Questions for the listing agent
- Is there a deadline driving the sale (1031 exchange, divorce, estate, relocation)? That informs how much negotiation room exists.
- Schools are F-rated, which usually means shorter tenancies and higher turnover. Who's the typical renter profile here, and what's been the actual vacancy rate?
- What's the average days-on-market for RENTAL listings here right now (not sales)? A rising rental-DOM trend means longer vacancies and softer asking-rent achievability than the comps imply.
- What's the recent tenant-quality profile in this submarket — average credit score on applications, eviction rate, late-payment / NSF rate, and stable-employment percentage? A property-management company in the area should have these aggregated.
- How much new for-sale + rental construction is in the pipeline within 1–3 miles? Heavy new supply typically softens prices + rents 12–24 months out; constrained supply supports both.
Investment metrics
- 1% rule
- 1.10% ✓
- Cap rate
- 8.91%
- Cash-on-cash
- 9.35%
- DSCR
- 1.42
- GRM
- 7.6
CMA / ARV
- ARV (on-the-fly)
- $97,200
- Comps found
- 1
Show comp detail 1 sale within ~0.75 mi
| Address | Dist | Beds/Ba | Sqft | Sold | Price | $/sf | Match |
|---|---|---|---|---|---|---|---|
| 103 Pershing Ave | 0.13mi | 3/1.0 | 1,149 (-4%) | 2mo | $93,000 | $81 | 83 |
Match score weights: distance 35% · size 25% · config 20% · recency 20%. Top-matched comps best support the ARV.
Projected returns pro-forma
-0.4% appreciation · 3.0% rent growth · sell at horizon
- IRR
- 7.0%
- Equity multiple
- 1.32×
- Total profit
- $8,402
- Equity at exit
- $25,007
- IRR
- 12.5%
- Equity multiple
- 2.31×
- Total profit
- $34,047
- Equity at exit
- $28,619
Cash invested: $25,900 (down + closing). Projections, not guarantees.
Landlord ↔ Tenant lean methodology
- Overall (STATE)
- 83 Strongly Landlord-Friendly
- State Iowa
- 83 Strongly Landlord-Friendly · R+6
- County
- — inherits STATE
- City
- — inherits STATE
ZIP-level market 50652
- Home prices YoY
- -0.4%
- Active inventory
- 1
- Price-to-rent
- 7.6×
Monthly cashflow live
- Estimated rent
- $1,019 medium interval (Pro) →
- Mortgage (P&I)
- −$485
- Tax from tax record
- −$80 /mo · $954/yr
- Insurance
- −$39
- HOA
- −$0
- Vacancy / Maint / Mgmt
- −$214
- Net cashflow
- $202
Break-even live
UW: 25.0% down · 7.5% · 30yr · 1.5% tax · 5.0% vac · 8.0% maint · 8.0% mgmt
Financing live
Cash to close
- Down payment
- $23,125
- Closing costs
- $2,775
- Reserves months
- —
- Total cash needed
- —
Loan-product check · same deal, 3 products live
Conventional
25% down · 7.5% · 30yr
- Down + closing
- —
- Monthly P&I
- —
- Monthly cashflow
- —
- DSCR
- —
- Eligible?
- —
Personal DTI + credit; lowest rate.
DSCR
20% down · 8.5% · 30yr
- Down + closing
- —
- Monthly P&I
- —
- Monthly cashflow
- —
- DSCR
- —
- Eligible?
- —
No personal income docs; deal must DSCR.
Hard money
10% down · 12.0% · 12mo
- Down + closing
- —
- Monthly P&I
- —
- Monthly cashflow
- —
- DSCR
- —
- Eligible?
- —
Short-term bridge; refi at stabilization.
Listing history 3 events
-
2026-05-19status Pending
-
2026-05-11historical Active Under Contract
-
2026-05-11$92,500 Active
ⓘ Source: listings_history table (triggers on properties + properties_extension) + one-shot
backfill from property_details.listing_events for pre-trigger history.
Tax reassessment forecast IA · Partial reset (capped growth)
- Current annual tax
- $954 · $80/mo
- Projected year-2 tax
- $1,203 · $100/mo
- Expected delta
- +$249/yr (+$21/mo · 26.1%)
ⓘ Screening estimate from a state-policy table — verify with the county assessor before closing.
Climate risk First Street
- Flood 1/10 Low FEMA zone X (unshaded) · 0% chance over 30 yrs
- Wildfire 1/10 Low
- Heat 2/10 Low 7 d/yr ≥102°F today · 16 d/yr by 30 yrs out
- Wind 2/10 Low
- Air quality 1/10 Low 0 unhealthy d/yr today · 0 by 30 yrs out
Nearby sold comps map
Loading sold comps map…
Walkable amenities ~0.75 mi
Loading nearby amenities…
Taxation est. · year 1
- Rental income
- $12,227
- − Mortgage interest
- −$5,181
- − Property taxes
- −$954
- − Insurance
- −$462
- − Repairs & maintenance
- −$978
- − Management
- −$978
- − Depreciation
- −$2,691
- Taxable income
- $982
- Est. tax owed @ 24.0%
- −$236
- After-tax cash flow
- $2,186/yr
For passive investors: Depreciation is non-cash, so a rental often shows a tax loss while cash-flowing — sheltering income. Rental losses are passive: they offset passive income freely, and up to $25,000/yr can offset ordinary (W-2) income if you actively participate and your MAGI is under $100k (phasing out to $0 by $150k); unused losses carry forward. On sale, claimed depreciation is recaptured at up to 25%, and gains may owe capital-gains tax (a 1031 exchange can defer both). Figures are a year-1 estimate at your 24.0% rate — not tax advice; consult a CPA.
Schools (NCES district)
- District
- Gladbrook-Reinbeck Community School District
- NCES district ID
- 1912660
- Math proficiency
- 76% ▼ -3.00%
- Reading proficiency
- 74% ▲ 9.00%
- Median HH income
- $55,866
- Composite
- 64.09/100
- National rank
- #576
- State rank
- #71 of 289 in IA
Livability — Lincoln
- Score
- 64/100
- State rank
- #609
- US rank
- #14009
Category grades
Schools grade is shown separately in the Schools card above.
Census & demographics
- Census place
- Lincoln, IA
- City population
- 88
- Population (ZIP)
- 88
Population outlook (Tama County) Hauer SSP2
- Today (2025)
- 16,690 people
- By 2030
- 16,217 · -2.8%
- By 2040
- 15,207 · -8.9%
- By 2050
- 14,186 · -15.0%
- By 2075
- 12,228 · -26.7%
- By 2100
- 10,386 · -37.8%
Race, ethnicity, and origin ACS 2023
- Neighborhood character
- Predominantly White (92%)
- Race & ethnicity
- White 92% Two or more races 5% Hispanic / Latino 3%
- Common ancestry
- Iranian 2% Lithuanian 1% Romanian 1%
- Languages at home
- 98% English-only · Spanish 2%
Political lean MEDSL · Tama
- 2024 margin
- Strong R (+26.9) · D 35.7% · R 62.6% · Other 1.7%
- 2008→2024 swing
- -39.1pp toward R · 2008: 12.2pp · 2024: -26.9pp
- All cycles
- 2024: R+26.9 2020: R+19.1 2016: R+20.6 2012: D+7.4 2008: D+12.2
Not yet ingested
- Civics
- —
Market trends
- HPI YoY
- ▼ -0.40%
- Current HPI
- 91.9994
- Rent YoY
- —
- Metro
- —
- State GDP YoY
- ▲ 2.48%
- F500 in state
- 4
Industry mix (Fortune 500 HQ in IA)
| Industry | F500 HQs | Revenue |
|---|---|---|
| Financial Services | 1 | $16B |
|
||
| Retail / Convenience | 1 | $15B |
|
||
Price history
3 events — show timeline
- 2026-05-19 Pending — IAR
- 2026-05-11 Contingent — IAR
- 2026-05-11 Listed $92,500 IAR
Property tax history
+2.5%/yrLatest (2025): $954 · -1.9% YoY. Source: county tax records.
Cash-flow waterfall
monthlySold comps — $/sqft
last 12 mo · ≤1 miLoading sold comps…