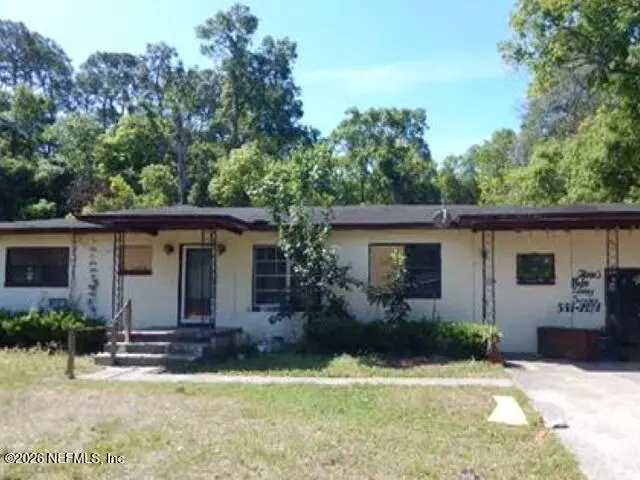
3736 Rose St · Jacksonville, FL
Flood risk 1/10 · Minimal
- FEMA flood zone
- X (unshaded)
- Chance of flooding over 30 yrs
- 0.0%
- Est. flood insurance / yr
- $507 – $1,088
Fire risk 4/10 · Minor
- Est. fire insurance / yr
- $947 – $1,759
Heat risk 9/10 · Severe
- Hot days now (above 107°F)
- 7 days/yr
- Hot days in 30 yrs
- 19 days/yr
Wind risk 9/10 · Severe
- Chance of severe wind over 30 yrs
- 99.0%
Air-quality risk 4/10 · Minor
- Unhealthy air days now
- 6 days/yr
- Unhealthy air days in 30 yrs
- 6 days/yr
Risk factors via First Street. Map © Google.
Why this score? — see what drove the B grade
The composite is a weighted blend of 9 inputs, each scored 0–100. Each bar is that input's sub-score; the figure is the points it added to the 100-point composite (weight × sub-score).
- Cash flow +30.0/30.0
- 1% rule +10.0/10.0
- DSCR +10.0/10.0
- ARV discount +7.5/15.0
- Livability +4.2/5.0
- Schools +3.9/10.0
- Condition / age +2.5/5.0
- Rent growth +2.2/5.0
- Appreciation +0.0/10.0
$88,400
🖨 Deal sheet 📄 Offer letter ✓ Due diligence
Listing remarks
AUCTION. Your renovation ideas are needed to restore this spacious ranch home. The original property floor plan features 3 beds, 2 baths, living-dining combo, and a kitchen with an eating nook. Multiple conversions were completed to alter the current floor plan to add additional rooms. The garage has been converted and would require renovations. Home sits on a large lot with additional storage structures and a patio. USE CAUTION - THRASH out may not be completed in all structures - roof damage is present. Home has a WELL AND SEPTIC with NO HVAC. Property will require many repairs and updates to include roof, flooring and room conversions. USE CAUTION throughout as water damage was repor
Key facts
- Spacious ranch home
- Converted garage
- Large lot
Tags
Property features AI
Finance
- HOA & community: Not a senior community
Exterior
- Parking: Other parking
- Utilities: Septic tank; Other utilities
- Home design: Single-family ranch-style home; One level
- Construction: Brick construction; Shingle roof
- Exterior features: Fenced yard; Other exterior structures
Interior
- Kitchen: Kitchen on the main level
- Bedrooms: Three bedrooms (all on the main level)
- Bathrooms: Two full bathrooms
- Heating & cooling: Wall/window air conditioning units
- Interior features: Five total rooms; Other interior features
- Laundry & utility: No appliances listed
Neighborhood map
What this means for you Summary
Snapshot
- This is a 3-bed/2.0-bath single-family listed at $88k.
Deal economics
- At list price, monthly cash flow is $891 ($11k/yr) — positive.
- The deal already cash-flows at list — no discount required.
- Meets the 1% rule at list price ($2k rent vs $88k).
- Cap rate 18.4% vs local median 4.0% in Jacksonville — top-decile yield for the area; either an underpriced asset or a hidden risk that comps aren't pricing in. Stress-test before assuming the spread holds.
Location & tenants
- Location reads 83/100 on livability (#50 in FL, #911 nationally) — a professional / high-income tenant draw. Strengths: amenities A+, commute A+, housing A+.
- Duval (urban): math 46% / reading 45% proficiency, ranked #48 of 73 in FL (top 66%) — families likely to look elsewhere, expect single-tenant / working-renter base with shorter leases.
- Market conditions: Rents soft (-1.4%/yr); 291 active listings in the ZIP; 14 comparable units currently listed for rent nearby; rentals at typical pace (median 21d on market — plan ~3-4 weeks tenant-placement turnaround); lower-income renter base — watch delinquency; 6,503 units permitted in Duval County in 2024 (1,131 in 5+ unit buildings).
- At $1,876/mo this rent would consume 54% of the median local household income ($41k/yr) (locally 1765% of renters already pay >50% of income on rent) — very limited rent-growth headroom before tenants either downsize or default.
Forward outlook
- Local home prices are declining (-3.0%/yr); year-one equity from $611 of loan paydown is wiped out by about $3k of value loss. Plan a longer hold.
- Duval County population projected at +19% by 2050 — long-run rental-demand tailwind backs the buy-and-hold thesis.
- At projected returns (-3.0% appreciation + 0.0% rent growth), your $25k cash investment doubles in ~3 years — after that, you're playing with house money.
Negotiation context
- Only 14 days on market — expect competitive offers; lowballing is unlikely to land.
- 2 sale attempts with the ask held roughly flat each time — persistent listings suggest the price (not the market) is what's stuck; bring a comps-based counter.
- Current owner paid $43k; list at $88k implies a 105% gain — meaningful room to come down on a strong offer.
Risks & watch-outs
- Climate carrying-cost: severe wind risk, 99% chance of damaging wind over 30y; extreme-heat days projected 7→19/yr by 2055 (HVAC capex compounding) — expect insurance premiums to compound above CPI over the hold.
Questions for the listing agent
- Built in 1961 — when were the roof, HVAC, electrical panel, plumbing, and water heater last replaced?
- Is there a deadline driving the sale (1031 exchange, divorce, estate, relocation)? That informs how much negotiation room exists.
- Schools are B-rated — typically a magnet for longer-tenancy family renters. What's the average tenant stay here, and is there a school-zone premium baked into asking?
- What's the average days-on-market for RENTAL listings here right now (not sales)? A rising rental-DOM trend means longer vacancies and softer asking-rent achievability than the comps imply.
- What's the recent tenant-quality profile in this submarket — average credit score on applications, eviction rate, late-payment / NSF rate, and stable-employment percentage? A property-management company in the area should have these aggregated.
- How much new for-sale + rental construction is in the pipeline within 1–3 miles? Heavy new supply typically softens prices + rents 12–24 months out; constrained supply supports both.
Investment metrics
- 1% rule
- 2.12% ✓
- Cap rate
- 18.38%
- Cash-on-cash
- 43.18%
- DSCR
- 2.92
- GRM
- 3.9
CMA / ARV
- ARV (on-the-fly)
- $242,880
- Comps found
- 12
Show comp detail 12 sales within ~0.75 mi
| Address | Dist | Beds/Ba | Sqft | Sold | Price | $/sf | Match |
|---|---|---|---|---|---|---|---|
| 3809 Rose St | 0.04mi | 4/2.0 (+1) | 2,239 (+11%) | 9mo | $137,500 | $61 | 68 |
| 9507 Arbor Oak Ln | 0.38mi | 3/2.0 | 1,893 (-6%) | 6mo | $271,600 | $143 | 66 |
| 3257 Garden Brook Rd | 0.17mi | 3/2.0 | 1,817 (-10%) | 11mo | $260,500 | $143 | 66 |
| 3283 Garden Acres Ct W | 0.14mi | 4/2.5 (+1) | 2,229 (+10%) | 7mo | $268,000 | $120 | 64 |
| 9487 Arbor Oak Ln | 0.40mi | 4/2.0 (+1) | 2,110 (+4%) | 7mo | $243,000 | $115 | 63 |
| 9520 Fraser Fir Ct | 0.43mi | 4/3.0 (+1) | 2,040 (+1%) | 8mo | $299,000 | $147 | 62 |
| 9626 Spottswood Rd W | 0.68mi | 3/2.0 | 2,063 (+2%) | 3mo | $197,500 | $96 | 62 |
| 9240 Tamworth Rd | 0.59mi | 4/2.0 (+1) | 1,983 (-2%) | 4mo | $98,900 | $50 | 60 |
| 3286 Soutel Dr | 0.60mi | 4/2.0 (+1) | 2,044 (+1%) | 7mo | $250,000 | $122 | 60 |
| 3103 Rogers Ave | 0.43mi | 4/2.5 (+1) | 2,215 (+9%) | 6mo | $265,000 | $120 | 53 |
| 3135 Soutel Dr | 0.61mi | 4/2.0 (+1) | 2,222 (+10%) | 5mo | $175,000 | $79 | 46 |
| 9350 Arbor Oak Ln | 0.50mi | 4/2.5 (+1) | 2,215 (+9%) | 11mo | $315,000 | $142 | 44 |
Match score weights: distance 35% · size 25% · config 20% · recency 20%. Top-matched comps best support the ARV.
Projected returns pro-forma
-3.0% appreciation · 0.0% rent growth · sell at horizon
- IRR
- 36.6%
- Equity multiple
- 2.49×
- Total profit
- $36,923
- Equity at exit
- $13,181
- IRR
- 41.7%
- Equity multiple
- 4.39×
- Total profit
- $84,023
- Equity at exit
- $7,643
Cash invested: $24,752 (down + closing). Projections, not guarantees.
Landlord ↔ Tenant lean methodology
- Overall (STATE)
- 87 Strongly Landlord-Friendly
- State Florida
- 87 Strongly Landlord-Friendly · R+3
- County
- — inherits STATE
- City
- — inherits STATE
ZIP-level market 32208
- Home prices YoY
- -33.6%
- Rents YoY
- -1.4%
- Active inventory
- 291
- Price-to-rent
- 3.9×
Monthly cashflow live
- Estimated rent
- $1,876 high interval (Pro) →
- Mortgage (P&I)
- −$464
- Tax from tax record
- −$91 /mo · $1,087/yr
- Insurance
- −$37
- HOA
- −$0
- Vacancy / Maint / Mgmt
- −$394
- Net cashflow
- $891
Break-even live
UW: 25.0% down · 7.5% · 30yr · 1.5% tax · 5.0% vac · 8.0% maint · 8.0% mgmt
Financing live
Cash to close
- Down payment
- $22,100
- Closing costs
- $2,652
- Reserves months
- —
- Total cash needed
- —
Loan-product check · same deal, 3 products live
Conventional
25% down · 7.5% · 30yr
- Down + closing
- —
- Monthly P&I
- —
- Monthly cashflow
- —
- DSCR
- —
- Eligible?
- —
Personal DTI + credit; lowest rate.
DSCR
20% down · 8.5% · 30yr
- Down + closing
- —
- Monthly P&I
- —
- Monthly cashflow
- —
- DSCR
- —
- Eligible?
- —
No personal income docs; deal must DSCR.
Hard money
10% down · 12.0% · 12mo
- Down + closing
- —
- Monthly P&I
- —
- Monthly cashflow
- —
- DSCR
- —
- Eligible?
- —
Short-term bridge; refi at stabilization.
Rent comps 14 comps
| Address | Beds | Baths | Sqft | Rent | $/sqft | DOM | Units | Dist |
|---|---|---|---|---|---|---|---|---|
| 3636 Turton Ave Jacksonville, FL | 4.0 | 2.0 | 1728 | $2,100 | $1.22 | 23d | 1 | 0.20mi |
| 9517 Fraser Fir Ct Jacksonville, FL | 4.0 | 2.0 | 1526 | $1,745 | $1.14 | 7d | 1 | 0.48mi |
| 8516 Bermuda Rd Jacksonville, FL | 3.0 | 2.0 | 1492 | $1,625 | $1.09 | 20d | 1 | 1.00mi |
| 8534 Addison Rd Jacksonville, FL | 4.0 | 2.0 | 1410 | $1,995 | $1.41 | 23d | 1 | 1.12mi |
| 8509 Addison Rd Jacksonville, FL | 4.0 | 2.0 | 1494 | $1,675 | $1.12 | 23d | 1 | 1.13mi |
| 3283 Penny Cove Dr Unit 1 Jacksonville, FL | 3.0 | 2.5 | 1650 | $2,000 | $1.21 | 17d | 1 | 1.14mi |
| 3231 Penny Cove Ln Jacksonville, FL | 3.0 | 2.5 | 1626 | $1,945 | $1.20 | 17d | 1 | 1.18mi |
| 2950 Bessent Rd Jacksonville, FL | 3.0 | 2.0 | 1446 | $1,779 | $1.23 | 21d | 1 | 1.20mi |
| 2978 Centerwood Dr Jacksonville, FL | 3.0 | 2.0 | 1437 | $1,805 | $1.26 | 23d | 1 | 1.22mi |
| 10569 Madrone Cove Ct Jacksonville, FL | 3.0 | 2.5 | 1678 | $1,700 | $1.01 | 23d | 1 | 1.24mi |
| 9504 Evesham Rd Jacksonville, FL | 4.0 | 2.0 | 1966 | $1,645 | $0.84 | 23d | 1 | 1.26mi |
| 8918 1st Ave Jacksonville, FL | 3.0 | 2.0 | 1435 | $1,321 | $0.92 | 16d | 1 | 1.43mi |
| 10373 Marsh Hawk Dr Jacksonville, FL | 3.0 | 2.0 | 1868 | $2,020 | $1.08 | 2d | 1 | 1.46mi |
| 10842 Lydia Estates Dr Jacksonville, FL | 4.0 | 2.0 | 2058 | $2,500 | $1.21 | 21d | 1 | 1.49mi |
Listing history 11 events
-
2026-06-18days on market $88,400 Active 14 DOM
-
2026-06-17days on market $88,400 Active 13 DOM
-
2026-06-16days on market $88,400 Active 12 DOM
-
2026-06-15days on market $88,400 Active 11 DOM
-
2026-06-13days on market $88,400 Active 9 DOM
-
2026-06-13days on market $88,400 Active 8 DOM
-
2026-06-09days on market $88,400 Active 5 DOM
-
2026-06-08days on market $88,400 Active 4 DOM
-
2026-06-07days on market $88,400 Active 3 DOM
-
2026-06-05remarks 699-char remark
-
2026-06-05$88,400 Active 1 DOM
ⓘ Source: listings_history table (triggers on properties + properties_extension) + one-shot
backfill from property_details.listing_events for pre-trigger history.
Tax reassessment forecast FL · Resets to sale price
- Current annual tax
- $1,087 · $91/mo
- Projected year-2 tax
- $1,087 · $91/mo
- Expected delta
- $0/yr ($0/mo · 0.0%)
ⓘ Screening estimate from a state-policy table — verify with the county assessor before closing.
Climate risk First Street
- Flood 1/10 Low FEMA zone X (unshaded) · 0% chance over 30 yrs
- Wildfire 4/10 Moderate
- Heat 9/10 Extreme 7 d/yr ≥107°F today · 19 d/yr by 30 yrs out
- Wind 9/10 Extreme 99% chance of damaging wind over 30 yrs
- Air quality 4/10 Moderate 6 unhealthy d/yr today · 6 by 30 yrs out
Nearby sold comps map
Loading sold comps map…
Walkable amenities ~0.75 mi
Loading nearby amenities…
Taxation est. · year 1
- Rental income
- $22,507
- − Mortgage interest
- −$4,952
- − Property taxes
- −$1,087
- − Insurance
- −$442
- − Repairs & maintenance
- −$1,801
- − Management
- −$1,801
- − Depreciation
- −$2,572
- Taxable income
- $9,853
- Est. tax owed @ 24.0%
- −$2,365
- After-tax cash flow
- $8,324/yr
For passive investors: Depreciation is non-cash, so a rental often shows a tax loss while cash-flowing — sheltering income. Rental losses are passive: they offset passive income freely, and up to $25,000/yr can offset ordinary (W-2) income if you actively participate and your MAGI is under $100k (phasing out to $0 by $150k); unused losses carry forward. On sale, claimed depreciation is recaptured at up to 25%, and gains may owe capital-gains tax (a 1031 exchange can defer both). Figures are a year-1 estimate at your 24.0% rate — not tax advice; consult a CPA.
Schools (NCES district)
- District
- Duval
- NCES district ID
- 1200480
- Math proficiency
- 46% ▼ -11.00%
- Reading proficiency
- 45% ▼ -4.00%
- Median HH income
- $48,987
- Composite
- 38.97/100
- National rank
- #4076
- State rank
- #48 of 73 in FL
Livability — Jacksonville
- Score
- 83/100
- State rank
- #50
- US rank
- #911
Category grades
Schools grade is shown separately in the Schools card above.
Census & demographics
- Census place
- Jacksonville, FL
- County
- Duval County · 1,015,274 people
- City population
- 979,034
- Metro
- Jacksonville, FL
- Population (ZIP)
- 32,699
- Household income
- $41,324
- Rent vs Own
- Severe rent burden
- 1765.0
Population outlook (Duval County) Hauer SSP2
- Today (2025)
- 1,013,010 people
- By 2030
- 1,059,228 · +4.6%
- By 2040
- 1,141,439 · +12.7%
- By 2050
- 1,205,258 · +19.0%
- By 2075
- 1,324,282 · +30.7%
- By 2100
- 1,319,620 · +30.3%
Race, ethnicity, and origin ACS 2023
- Neighborhood character
- Predominantly Black (77%)
- Race & ethnicity
- Black 77% White 16% Two or more races 4% Hispanic / Latino 3%
- Common ancestry
- Italian 1%
- Foreign-born
- 2% · Canada
- Languages at home
- 97% English-only · Spanish 2%
Political lean MEDSL · Duval
- 2024 margin
- Toss-up / Even · D 48.7% · R 50.1% · Other 1.2%
- 2008→2024 swing
- +0.4pp no change · 2008: -1.9pp · 2024: -1.5pp
- All cycles
- 2024: R+1.5 2020: D+3.8 2016: R+1.5 2012: R+3.6 2008: R+1.9
Not yet ingested
- Civics
- —
Market trends
- HPI YoY
- ▼ -110.56%
- Current HPI
- 217.9706
- Rent YoY
- ▼ -1.36%
- Metro
- Jacksonville, FL
- State GDP YoY
- ▲ 3.28%
- F500 in state
- 36
Industry mix (Fortune 500 HQ in FL)
| Industry | F500 HQs | Revenue |
|---|---|---|
| Industrial Technology | 2 | $29B |
|
||
| Insurance | 2 | $17B |
|
||
| Retail | 1 | $60B |
|
||
| Technology Distribution | 1 | $58B |
|
||
| Homebuilding | 1 | $35B |
|
||
| Technology Manufacturing | 1 | $35B |
|
||
Price history
+105.1% since first listed4 events — show timeline
- 2026-06-04 Listed $88,400 realMLS
- 2025-05-21 Listing Removed — GAMLS
- 2025-05-19 Listed $40,000 GAMLS
- 1993-03-10 Sold (Public Records) $43,100 Public Records
Property tax history
+2.9%/yrLatest (2025): $1,087 · +22.7% YoY. Source: county tax records.
Cash-flow waterfall
monthlySold comps — $/sqft
last 12 mo · ≤1 miLoading sold comps…