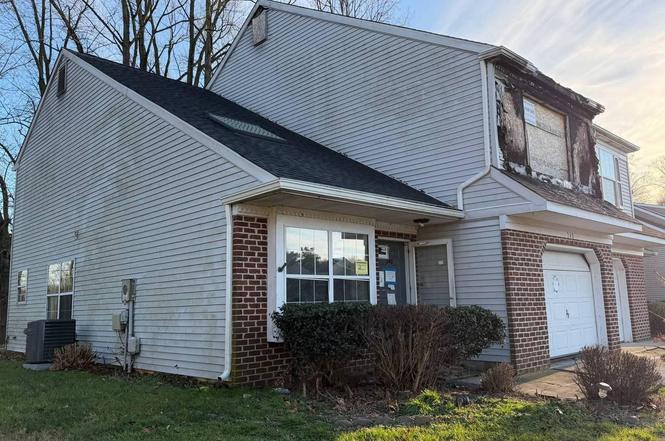
240 Grinding Wheel Dr · Dover, DE
Flood risk 1/10 · Minimal
- FEMA flood zone
- X (unshaded)
- Chance of flooding over 30 yrs
- 0.0%
- Est. flood insurance / yr
- $507 – $1,088
Fire risk 1/10 · Minimal
- Est. fire insurance / yr
- $476 – $884
Heat risk 8/10 · Major
- Hot days now (above 102°F)
- 7 days/yr
- Hot days in 30 yrs
- 16 days/yr
Wind risk 6/10 · Moderate
- Chance of severe wind over 30 yrs
- 75.0%
Air-quality risk 2/10 · Minimal
- Unhealthy air days now
- 1 days/yr
- Unhealthy air days in 30 yrs
- 2 days/yr
Risk factors via First Street. Map © Google.
Why this score? — see what drove the B- grade
The composite is a weighted blend of 9 inputs, each scored 0–100. Each bar is that input's sub-score; the figure is the points it added to the 100-point composite (weight × sub-score).
- Cash flow +30.0/30.0
- 1% rule +10.0/10.0
- DSCR +10.0/10.0
- ARV discount +7.5/15.0
- Livability +3.4/5.0
- Rent growth +3.3/5.0
- Condition / age +2.5/5.0
- Schools +2.0/10.0
- Appreciation +0.0/10.0
$120,000
🖨 Deal sheet 📄 Offer letter ✓ Due diligence
Listing remarks
🔥 Opportunity Knocks in Established Dover Community 🔥 240 Grinding Wheel Dr. , Dover, DE Opportunity knocks for the savvy investor, contractor, or buyer looking to build equity. This property has experienced fire damage and is being sold in as-is condition, offering significant upside potential for renovation, resale, or rental income. Located in a well-established Dover neighborhood, this home sits on a desirable lot with strong comparable values in the surrounding area — making it a prime candidate for a strategic rehab project. Why This Property Makes Sense: Solid footprint and layout ready for reimagination Opportunity to customize finishes and maximize ARV Potential flip, rental,
Key facts
- Garage
- Built 1996
- Listed 15 days
Neighborhood map
What this means for you Summary
Snapshot
- This is a 3-bed/2.5-bath single-family listed at $120k.
Deal economics
- At list price, monthly cash flow is $856 ($10k/yr) — positive.
- The deal already cash-flows at list — no discount required.
- Meets the 1% rule at list price ($2k rent vs $120k).
- Recommended offer: $118k (1.5% below list) — sets the bar for market timing.
- Cap rate 14.8% vs local median 5.2% in Dover — top-decile yield for the area; either an underpriced asset or a hidden risk that comps aren't pricing in. Stress-test before assuming the spread holds.
Location & tenants
- Location reads 67/100 on livability (#38 in DE) — a middle-class / working-renter tenant base. Strengths: amenities A+, cost of living A+, housing A+; Watch: schools C-, crime F, commute F.
- Capital School District (urban): math 14% / reading 31% proficiency, ranked #24 of 26 in DE (top 92%) — low school quality limits family demand, transient renter base, plan for 1-2y turnover.
- Market conditions: Rents rising (+3.3%/yr); 225 active listings in the ZIP; 3 comparable units currently listed for rent nearby; rentals lingering (median 44d on market — plan ~5-8 weeks vacancy on turnover, expect pricing pressure); 100% of comp listings sitting > 30 days — soft ceiling on asking rent; 1,201 units permitted in Kent County in 2024 (116 in 5+ unit buildings).
- This rent runs 38% of the median local income ($67k/yr) — at the standard rent-burdened threshold; future hikes will face affordability resistance.
Forward outlook
- Local home prices are declining (-3.0%/yr); year-one equity from $830 of loan paydown is wiped out by about $4k of value loss. Plan a longer hold.
- Kent County population projected at +22% by 2050 — long-run rental-demand tailwind backs the buy-and-hold thesis.
- At projected returns (-3.0% appreciation + 3.3% rent growth), your $34k cash investment doubles in ~4 years — after that, you're playing with house money.
Negotiation context
- It's been on market 15 days — a 2% lower offer ($118k) is reasonable based on typical stale-listing flexibility.
Risks & watch-outs
- Climate carrying-cost: major wind risk, 75% chance of damaging wind over 30y; extreme-heat days projected 7→16/yr by 2055 (HVAC capex compounding) — expect insurance premiums to compound above CPI over the hold.
Questions for the listing agent
- Is there a deadline driving the sale (1031 exchange, divorce, estate, relocation)? That informs how much negotiation room exists.
- Crime grade is F in this area — have there been break-ins, vandalism, or insurance claims at this property in the last 3 years? What carrier currently insures it and at what premium?
- What's the average days-on-market for RENTAL listings here right now (not sales)? A rising rental-DOM trend means longer vacancies and softer asking-rent achievability than the comps imply.
- What's the recent tenant-quality profile in this submarket — average credit score on applications, eviction rate, late-payment / NSF rate, and stable-employment percentage? A property-management company in the area should have these aggregated.
- How much new for-sale + rental construction is in the pipeline within 1–3 miles? Heavy new supply typically softens prices + rents 12–24 months out; constrained supply supports both.
Investment metrics
- 1% rule
- 1.75% ✓
- Cap rate
- 14.85%
- Cash-on-cash
- 30.56%
- DSCR
- 2.36
- GRM
- 4.8
CMA / ARV
- ARV (on-the-fly)
- $401,310
- Comps found
- 6
Show comp detail 6 sales within ~0.75 mi
| Address | Dist | Beds/Ba | Sqft | Sold | Price | $/sf | Match |
|---|---|---|---|---|---|---|---|
| 125 Millcreek Dr | 0.17mi | 4/2.5 (+1) | 2,118 (+11%) | 3mo | $369,000 | $174 | 66 |
| 128 Maple Glen Dr | 0.65mi | 3/2.0 | 1,913 (+0%) | 19mo | $385,000 | $201 | 52 |
| 116 Maple Glen Dr | 0.65mi | 3/2.0 | 1,813 (-5%) | 20mo | $380,000 | $210 | 43 |
| 121 Hobbyhorse Ct | 0.70mi | 3/2.0 | 1,690 (-12%) | 8mo | $410,000 | $243 | 40 |
| 130 Maple Glen Dr | 0.65mi | 3/2.0 | 1,629 (-15%) | 12mo | $420,000 | $258 | 33 |
| 23 S Bay Cir S | 0.74mi | 4/2.0 (+1) | 1,680 (-12%) | 10mo | $325,000 | $193 | 30 |
Match score weights: distance 35% · size 25% · config 20% · recency 20%. Top-matched comps best support the ARV.
Projected returns pro-forma
-3.0% appreciation · 3.3% rent growth · sell at horizon
- IRR
- 25.6%
- Equity multiple
- 2.06×
- Total profit
- $35,704
- Equity at exit
- $17,892
- IRR
- 33.5%
- Equity multiple
- 4.09×
- Total profit
- $103,957
- Equity at exit
- $10,375
Cash invested: $33,600 (down + closing). Projections, not guarantees.
Landlord ↔ Tenant lean methodology
- Overall (STATE)
- 70 Landlord-Friendly
- State Delaware
- 70 Landlord-Friendly · D+7
- County
- — inherits STATE
- City
- — inherits STATE
ZIP-level market 19904
- Rents YoY
- 3.3%
- Active inventory
- 225
- Price-to-rent
- 4.8×
Monthly cashflow live
- Estimated rent
- $2,101 medium interval (Pro) →
- Mortgage (P&I)
- −$629
- Tax from tax record
- −$125 /mo · $1,502/yr
- Insurance
- −$50
- HOA
- −$0
- Vacancy / Maint / Mgmt
- −$441
- Net cashflow
- $856
Break-even live
UW: 25.0% down · 7.5% · 30yr · 1.5% tax · 5.0% vac · 8.0% maint · 8.0% mgmt
Financing live
Cash to close
- Down payment
- $30,000
- Closing costs
- $3,600
- Reserves months
- —
- Total cash needed
- —
Loan-product check · same deal, 3 products live
Conventional
25% down · 7.5% · 30yr
- Down + closing
- —
- Monthly P&I
- —
- Monthly cashflow
- —
- DSCR
- —
- Eligible?
- —
Personal DTI + credit; lowest rate.
DSCR
20% down · 8.5% · 30yr
- Down + closing
- —
- Monthly P&I
- —
- Monthly cashflow
- —
- DSCR
- —
- Eligible?
- —
No personal income docs; deal must DSCR.
Hard money
10% down · 12.0% · 12mo
- Down + closing
- —
- Monthly P&I
- —
- Monthly cashflow
- —
- DSCR
- —
- Eligible?
- —
Short-term bridge; refi at stabilization.
Rent comps 3 comps
| Address | Beds | Baths | Sqft | Rent | $/sqft | DOM | Units | Dist |
|---|---|---|---|---|---|---|---|---|
| 1700 N DuPont Hwy Dover, DE | 1.0–3.0 | 1.0–2.0 | 1003 | $2,130 | $2.12 | 43d | 1 | 0.61mi |
| 63 Forest Creek Dr Dover, DE | 3.0 | 1.5 | 1322 | $1,600 | $1.21 | 43d | 1 | 1.45mi |
| 22 Forest Creek Dr Dover, DE | 4.0 | 3.0 | 1499 | $2,200 | $1.47 | 43d | 1 | 1.47mi |
Listing history 2 events
-
2026-02-26status Pending
-
2026-02-11$120,000 Active
ⓘ Source: listings_history table (triggers on properties + properties_extension) + one-shot
backfill from property_details.listing_events for pre-trigger history.
Tax reassessment forecast DE · Partial reset (capped growth)
- Current annual tax
- $1,502 · $125/mo
- Projected year-2 tax
- $1,502 · $125/mo
- Expected delta
- $0/yr ($0/mo · 0.0%)
ⓘ Screening estimate from a state-policy table — verify with the county assessor before closing.
Climate risk First Street
- Flood 1/10 Low FEMA zone X (unshaded) · 0% chance over 30 yrs
- Wildfire 1/10 Low
- Heat 8/10 Severe 7 d/yr ≥102°F today · 16 d/yr by 30 yrs out
- Wind 6/10 Major 75% chance of damaging wind over 30 yrs
- Air quality 2/10 Low 1 unhealthy d/yr today · 2 by 30 yrs out
Nearby sold comps map
Loading sold comps map…
Walkable amenities ~0.75 mi
Loading nearby amenities…
Taxation est. · year 1
- Rental income
- $25,217
- − Mortgage interest
- −$6,722
- − Property taxes
- −$1,502
- − Insurance
- −$600
- − Repairs & maintenance
- −$2,017
- − Management
- −$2,017
- − Depreciation
- −$3,491
- Taxable income
- $8,867
- Est. tax owed @ 24.0%
- −$2,128
- After-tax cash flow
- $8,140/yr
For passive investors: Depreciation is non-cash, so a rental often shows a tax loss while cash-flowing — sheltering income. Rental losses are passive: they offset passive income freely, and up to $25,000/yr can offset ordinary (W-2) income if you actively participate and your MAGI is under $100k (phasing out to $0 by $150k); unused losses carry forward. On sale, claimed depreciation is recaptured at up to 25%, and gains may owe capital-gains tax (a 1031 exchange can defer both). Figures are a year-1 estimate at your 24.0% rate — not tax advice; consult a CPA.
Schools (NCES district)
- District
- Capital School District
- NCES district ID
- 1000190
- Math proficiency
- 14% ▼ -17.00%
- Reading proficiency
- 31% ▼ -12.00%
- Median HH income
- $48,499
- Composite
- 19.78/100
- National rank
- #8703
- State rank
- #24 of 26 in DE
Livability — Dover
- Score
- 67/100
- State rank
- #38
- US rank
- #10574
Category grades
Schools grade is shown separately in the Schools card above.
Census & demographics
- Census place
- Dover, DE
- County
- Kent County · 82,184 people
- City population
- 76,581
- Metro
- Dover, DE
- Population (ZIP)
- 38,818
- Household income
- $66,908
- Rent vs Own
- Severe rent burden
- 1500.0
Population outlook (Kent County) Hauer SSP2
- Today (2025)
- 194,477 people
- By 2030
- 204,351 · +5.1%
- By 2040
- 222,135 · +14.2%
- By 2050
- 236,483 · +21.6%
- By 2075
- 266,327 · +36.9%
- By 2100
- 275,335 · +41.6%
Race, ethnicity, and origin ACS 2023
- Neighborhood character
- Diverse neighborhood (Simpson 0.64)
- Race & ethnicity
- White 48% Black 35% Two or more races 9% Hispanic / Latino 8% Asian 3%
- Hispanic origin (detail)
- Mexican 1% Puerto Rican 4%
- Common ancestry
- Hispanic 3% Romanian 2% Slovak 2%
- Foreign-born
- 10% · Canada, South Korea
- Languages at home
- 87% English-only · Spanish 5% French/Haitian/Cajun 3% German/W. Germanic 1%
Political lean MEDSL · Kent
- 2024 margin
- Toss-up / Even · D 50.2% · R 48.2% · Other 1.7%
- 2008→2024 swing
- -7.8pp toward R · 2008: 9.8pp · 2024: 2.0pp
- All cycles
- 2024: D+2.0 2020: D+4.1 2016: R+4.9 2012: D+4.9 2008: D+9.8
Not yet ingested
- Civics
- —
Market trends
- HPI YoY
- ▼ -112.03%
- Current HPI
- 187.6879
- Rent YoY
- ▲ 3.30%
- Metro
- Dover, DE
- State GDP YoY
- —
- F500 in state
- 0
Price history
2 events — show timeline
- 2026-02-26 Pending — BRIGHT MLS
- 2026-02-11 Listed $120,000 BRIGHT MLS
Property tax history
+2.0%/yrLatest (2025): $1,502 · +3.5% YoY. Source: county tax records.
Cash-flow waterfall
monthlySold comps — $/sqft
last 12 mo · ≤1 miLoading sold comps…