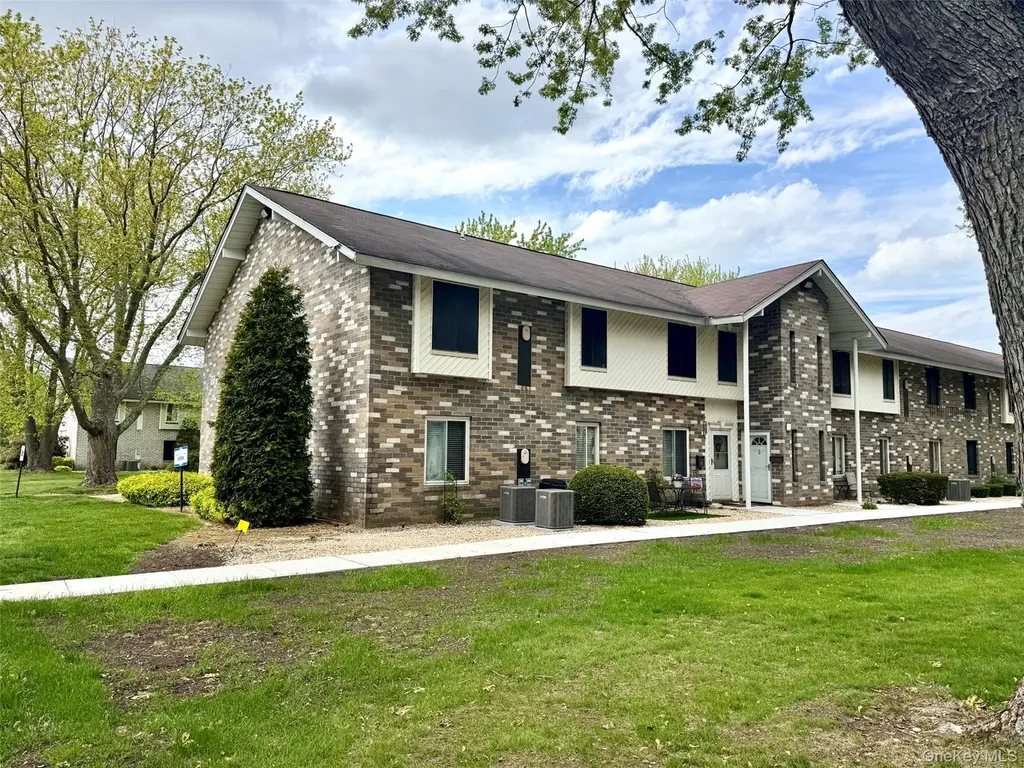
1 Aspen Ct Unit 1A · Coram, NY
Flood risk 1/10 · Minimal
- FEMA flood zone
- X (unshaded)
- Chance of flooding over 30 yrs
- 0.0%
- Est. flood insurance / yr
- $507 – $1,088
Fire risk 1/10 · Minimal
- Est. fire insurance / yr
- $691 – $1,283
Heat risk 5/10 · Moderate
- Hot days now (above 93°F)
- 7 days/yr
- Hot days in 30 yrs
- 18 days/yr
Wind risk 6/10 · Moderate
- Chance of severe wind over 30 yrs
- 77.0%
Air-quality risk 4/10 · Minor
- Unhealthy air days now
- 3 days/yr
- Unhealthy air days in 30 yrs
- 5 days/yr
Risk factors via First Street. Map © Google.
Why this score? — see what drove the C- grade
The composite is a weighted blend of 9 inputs, each scored 0–100. Each bar is that input's sub-score; the figure is the points it added to the 100-point composite (weight × sub-score).
- Cash flow +17.7/30.0
- ARV discount +7.5/15.0
- DSCR +5.5/10.0
- Schools +5.2/10.0
- 1% rule +4.8/10.0
- Condition / age +3.8/5.0
- Rent growth +3.7/5.0
- Livability +3.3/5.0
- Appreciation +0.0/10.0
$229,990
🖨 Deal sheet 📄 Offer letter ✓ Due diligence
Listing remarks
Welcome to this rare Executive Model co-op in the highly sought after, amenity filled North Isle Village. Larger than the standard deluxe model, this spacious layout offers an additional bedroom along with an expanded living room and oversized primary bedroom - providing the extra space so many buyers are looking for. This desirable ground-level end unit offers added privacy and convenience, with easy access and abundant natural light. The generous living room is perfect for entertaining or relaxing, while the extra bedroom provides flexibility for guests, a home office, or hobby space. The primary bedroom is notably larger than the deluxe model, offering plenty of room and additional dress
Key facts
- Outdoor pool
- Tennis courts
- Indoor pool
Tags
Property features AI
Finance
- HOA & community: Community clubhouse; Fitness center; Community pool; Tennis courts
Exterior
- Parking: Assigned parking space in a parking lot (1 total)
- Utilities: Public sewer; Cable available; Electricity connected; Natural gas connected; Sewer connected; Trash collection (private); Water connected
- Home design: Stock cooperative
- Construction: Brick exterior; Slab foundation
- Exterior features: Brick construction; Slab foundation; Not waterfront
Interior
- Kitchen: Dishwasher; Gas range; Refrigerator
- Bedrooms: Bedroom on the first floor
- Bathrooms: 1 full bathroom
- Heating & cooling: Central air conditioning; Forced air heating (natural gas)
- Interior features: First-floor bedroom; First-floor full bathroom; Breakfast bar; Galley-style kitchen; No basement; 5 total rooms; Pets allowed
Neighborhood map
What this means for you Summary
Snapshot
- This is a 2-bed/1.0-bath condo listed at $230k. Condition is rated good.
Deal economics
- At list price, monthly cash flow is $185 ($2k/yr) — positive.
- The deal already cash-flows at list — no discount required.
- To meet the 1% rule (rent ≥ 1% of price), the offer needs to be $225k (2.3% below list).
- Recommended offer: $225k (2.3% below list) — sets the bar for 1% rule.
- Cap rate 7.3% vs local median 3.5% in Coram — top-decile yield for the area; either an underpriced asset or a hidden risk that comps aren't pricing in. Stress-test before assuming the spread holds.
Location & tenants
- Location reads 66/100 on livability (#646 in NY) — a middle-class / working-renter tenant base. Strengths: employment A+, housing A+, health & safety B; Watch: amenities F, commute F, cost of living F.
- Longwood Central School District (rural): math 61% / reading 55% proficiency, ranked #235 of 590 in NY (top 40%) — acceptable for families but not a draw, mixed tenant base, ~2y average lease.
- Zoned schools: Coram Elementary School (math 37% / reading 52%, grade F, #1,277 of 2,108 statewide, top 64%, 914 students, 53% FRL); Longwood Junior High School (math 67% / reading 67%, grade A-, #101 of 729 statewide, top 15%, 1,388 students, 48% FRL); Longwood High School (math 90% / reading 77%, grade A, #409 of 1,100 statewide, top 39%, 2,977 students, 44% FRL).
- Market conditions: Rents rising fast (+4.7%/yr); 232 active listings in the ZIP; 11 comparable units currently listed for rent nearby; rentals at typical pace (median 22d on market — plan ~3-4 weeks tenant-placement turnaround); solid renter incomes; 1,366 units permitted in Suffolk County in 2024 (216 in 5+ unit buildings).
Forward outlook
- Local home prices are declining (-3.0%/yr); year-one equity from $2k of loan paydown is wiped out by about $7k of value loss. Plan a longer hold.
- Suffolk County population projected to shrink 5% by 2050 — rents likely to lag national; underwrite the cash flow, not the appreciation.
Negotiation context
- It's been on market 15 days — a 2% lower offer ($227k) is reasonable based on typical stale-listing flexibility.
Risks & watch-outs
- Climate carrying-cost: major wind risk, 77% chance of damaging wind over 30y; extreme-heat days projected 7→18/yr by 2055 (HVAC capex compounding) — expect insurance premiums to compound above CPI over the hold.
Questions for the listing agent
- Built in 1976 — when were the roof, HVAC, electrical panel, plumbing, and water heater last replaced?
- Any open or pending special assessments — roof, HVAC, plumbing, elevator, façade? What's the per-unit balance and payoff schedule, and is the seller paying it off at close or rolling it to the buyer?
- Is there a deadline driving the sale (1031 exchange, divorce, estate, relocation)? That informs how much negotiation room exists.
- Schools are B-rated — typically a magnet for longer-tenancy family renters. What's the average tenant stay here, and is there a school-zone premium baked into asking?
- What's the average days-on-market for RENTAL listings here right now (not sales)? A rising rental-DOM trend means longer vacancies and softer asking-rent achievability than the comps imply.
- What's the recent tenant-quality profile in this submarket — average credit score on applications, eviction rate, late-payment / NSF rate, and stable-employment percentage? A property-management company in the area should have these aggregated.
- How much new apartment / multifamily construction is in the pipeline within 1–3 miles? Heavy new supply (>2% of stock underway) typically softens rents 12–24 months out; light construction supports rent growth.
Investment metrics
- 1% rule
- 0.98% ✗
- Cap rate
- 7.26%
- Cash-on-cash
- 3.46%
- DSCR
- 1.15
- GRM
- 8.5
CMA / ARV
No comps found within radius.
Projected returns pro-forma
-3.0% appreciation · 4.66% rent growth · sell at horizon
- IRR
- -9.0%
- Equity multiple
- 0.66×
- Total profit
- $-21,606
- Equity at exit
- $34,292
- IRR
- 2.6%
- Equity multiple
- 1.20×
- Total profit
- $12,729
- Equity at exit
- $19,885
Cash invested: $64,397 (down + closing). Projections, not guarantees.
Landlord ↔ Tenant lean methodology
- Overall (STATE)
- 15 Strongly Tenant-Friendly
- State New York
- 15 Strongly Tenant-Friendly · D+10
- County
- — inherits STATE
- City
- — inherits STATE
ZIP-level market 11727
- Rents YoY
- 4.7%
- Active inventory
- 232
- Price-to-rent
- 8.5×
Monthly cashflow live
- Estimated rent
- $2,247 high interval (Pro) →
- Mortgage (P&I)
- −$1,206
- Tax est. 1.5%
- −$287 /mo · $3,450/yr
- Insurance
- −$96
- HOA
- −$0
- Vacancy / Maint / Mgmt
- −$472
- Net cashflow
- $185
Break-even live
UW: 25.0% down · 7.5% · 30yr · 1.5% tax · 5.0% vac · 8.0% maint · 8.0% mgmt
Financing live
Cash to close
- Down payment
- $57,498
- Closing costs
- $6,900
- Reserves months
- —
- Total cash needed
- —
Loan-product check · same deal, 3 products live
Conventional
25% down · 7.5% · 30yr
- Down + closing
- —
- Monthly P&I
- —
- Monthly cashflow
- —
- DSCR
- —
- Eligible?
- —
Personal DTI + credit; lowest rate.
DSCR
20% down · 8.5% · 30yr
- Down + closing
- —
- Monthly P&I
- —
- Monthly cashflow
- —
- DSCR
- —
- Eligible?
- —
No personal income docs; deal must DSCR.
Hard money
10% down · 12.0% · 12mo
- Down + closing
- —
- Monthly P&I
- —
- Monthly cashflow
- —
- DSCR
- —
- Eligible?
- —
Short-term bridge; refi at stabilization.
Rent comps 11 comps
| Address | Beds | Baths | Sqft | Rent | $/sqft | DOM | Units | Dist |
|---|---|---|---|---|---|---|---|---|
| 39 Fargo Ct Unit 39 Coram, NY | 1.0 | 1.0 | 650 | $2,000 | $3.08 | 43d | 1 | 0.12mi |
| 23 Sierra Ct Unit 23 Coram, NY | 1.0 | 1.0 | 600 | $1,995 | $3.33 | 43d | 1 | 0.14mi |
| 21 Sierra Ct Unit 21 Coram, NY | 1.0 | 1.0 | 650 | $1,895 | $2.92 | 43d | 1 | 0.14mi |
| 37 El Camino Ct #37 Coram, NY | 1.0 | 1.0 | 500 | $2,100 | $4.20 | 2d | 1 | 0.17mi |
| 10 Houston Ct #10 Coram, NY | 1.0 | 1.0 | 650 | $2,150 | $3.31 | 22d | 1 | 0.18mi |
| 5 Laramie Ct Unit 5 Coram, NY | 1.0 | 1.0 | 750 | $2,150 | $2.87 | 24d | 1 | 0.32mi |
| 11 Laramie Ct Unit 11 Coram, NY | 1.0 | 1.0 | 750 | $2,100 | $2.80 | 17d | 1 | 0.32mi |
| 119 Sequoia Dr Coram, NY | 1.0 | 1.0 | 700 | $2,200 | $3.14 | 15d | 1 | 0.33mi |
| 5 Whitney Ln Coram, NY | 1.0 | 1.0 | 552 | $1,900 | $3.44 | 43d | 1 | 0.94mi |
| 1998 New York 112 Coram, NY | 2.0 | 1.0 | 806 | $2,760 | $3.42 | 1d | 4 | 1.25mi |
| 100 Stonegate Way Middle Island, NY | 1.0–3.0 | 1.0–2.0 | 1058 | $3,196 | $3.02 | 1d | 4 | 1.29mi |
HOA detail condo
- Monthly dues
- $0 · $0/yr
- Assessments
- None detected in remarks — confirm with the listing agent.
Listing history 11 events
-
2026-06-18days on market $229,990 Active 15 DOM
-
2026-06-17days on market $229,990 Active 14 DOM
-
2026-06-16days on market $229,990 Active 13 DOM
-
2026-06-15days on market $229,990 Active 12 DOM
-
2026-06-13days on market $229,990 Active 10 DOM
-
2026-06-13days on market $229,990 Active 9 DOM
-
2026-06-09days on market $229,990 Active 6 DOM
-
2026-06-08days on market $229,990 Active 5 DOM
-
2026-06-07days on market $229,990 Active 4 DOM
-
2026-06-04remarks 699-char remark
-
2026-06-04$229,990 Active 1 DOM
ⓘ Source: listings_history table (triggers on properties + properties_extension) + one-shot
backfill from property_details.listing_events for pre-trigger history.
Climate risk First Street
- Flood 1/10 Low FEMA zone X (unshaded) · 0% chance over 30 yrs
- Wildfire 1/10 Low
- Heat 5/10 Major 7 d/yr ≥93°F today · 18 d/yr by 30 yrs out
- Wind 6/10 Major 77% chance of damaging wind over 30 yrs
- Air quality 4/10 Moderate 3 unhealthy d/yr today · 5 by 30 yrs out
Nearby sold comps map
Loading sold comps map…
Walkable amenities ~0.75 mi
Loading nearby amenities…
Taxation est. · year 1
- Rental income
- $26,961
- − Mortgage interest
- −$12,883
- − Property taxes
- −$3,450
- − Insurance
- −$1,150
- − Repairs & maintenance
- −$2,157
- − Management
- −$2,157
- − Depreciation
- −$6,691
- Taxable loss
- −$1,527
- Est. tax savings @ 24.0%
- +$366
- After-tax cash flow
- $2,592/yr
For passive investors: Depreciation is non-cash, so a rental often shows a tax loss while cash-flowing — sheltering income. Rental losses are passive: they offset passive income freely, and up to $25,000/yr can offset ordinary (W-2) income if you actively participate and your MAGI is under $100k (phasing out to $0 by $150k); unused losses carry forward. On sale, claimed depreciation is recaptured at up to 25%, and gains may owe capital-gains tax (a 1031 exchange can defer both). Figures are a year-1 estimate at your 24.0% rate — not tax advice; consult a CPA.
Condition & rehab AI · 13 photos
This executive model co-op in North Isle Village is in good condition with minor cosmetic updates needed to enhance its curb appeal and value.
Value-add opportunities
- Both Painting the exterior siding — Enhances curb appeal and property value
- Both Re-carpeting the living areas — Improves aesthetics and adds value
- Resale Replacing the kitchen faucet — Modernizes the kitchen and adds value
Renovation cost estimate screening
Value-add ROI direction
- Both Painting the exterior siding — Enhances curb appeal and property value ↑
- Both Re-carpeting the living areas — Improves aesthetics and adds value ↑
- Resale Replacing the kitchen faucet — Modernizes the kitchen and adds value ↑
ⓘ Cost ranges are severity-bucket heuristics (US national rule-of-thumb). Get contractor quotes + a written scope before underwriting a rehab budget.
Schools (NCES district)
- District
- Longwood Central School District
- NCES district ID
- 3619230
- Math proficiency
- 61% ▬ 0.00%
- Reading proficiency
- 55% ▼ -1.00%
- Median HH income
- $72,748
- Composite
- 51.63/100
- National rank
- #1703
- State rank
- #235 of 590 in NY
Livability — Coram
- Score
- 66/100
- State rank
- #646
- US rank
- #12097
Category grades
Schools grade is shown separately in the Schools card above.
Census & demographics
- Census place
- Coram, NY
- County
- Suffolk County · 679,920 people
- City population
- 28,495
- Metro
- New York-Newark-Jersey City, NY-NJ-PA
- Population (ZIP)
- 28,495
- Household income
- $103,287
- Rent vs Own
- Severe rent burden
- 994.0
Population outlook (Suffolk County) Hauer SSP2
- Today (2025)
- 1,505,262 people
- By 2030
- 1,498,318 · -0.5%
- By 2040
- 1,471,101 · -2.3%
- By 2050
- 1,424,848 · -5.3%
- By 2075
- 1,337,157 · -11.2%
- By 2100
- 1,217,720 · -19.1%
Race, ethnicity, and origin ACS 2023
- Neighborhood character
- Diverse neighborhood (Simpson 0.69)
- Race & ethnicity
- White 50% Hispanic / Latino 19% Two or more races 18% Black 15% Asian 6%
- Hispanic origin (detail)
- Mexican 1% Puerto Rican 8% Dominican 4%
- Common ancestry
- Romanian 4% Scotch-Irish 2% Lithuanian 1%
- Foreign-born
- 22% · Canada, South Korea, Jamaica
- Languages at home
- 72% English-only · Spanish 12% Other Indo-European 8% Arabic 2%
Political lean MEDSL · Suffolk
- 2024 margin
- Lean R (+10.0) · D 45.0% · R 55.0%
- 2008→2024 swing
- -16.0pp toward R · 2008: 6.0pp · 2024: -10.0pp
- All cycles
- 2024: R+10.0 2020: R+0.0 2016: R+8.2 2012: D+2.9 2008: D+6.0
Not yet ingested
- Civics
- —
Market trends
- HPI YoY
- ▼ -571.88%
- Current HPI
- 388.8297
- Rent YoY
- ▲ 4.66%
- Metro
- New York-Newark-Jersey City, NY-NJ-PA
- State GDP YoY
- ▲ 2.60%
- F500 in state
- 92
Industry mix (Fortune 500 HQ in NY)
| Industry | F500 HQs | Revenue |
|---|---|---|
| Financial Services | 10 | $950B |
|
||
| Consumer Goods | 9 | $162B |
|
||
| Insurance | 4 | $225B |
|
||
| Telecommunications | 2 | $144B |
|
||
| Pharmaceuticals | 2 | $112B |
|
||
| Media / Entertainment | 2 | $69B |
|
||
Price history
1 event — show timeline
- 2026-06-02 Listed $229,990 OneKey® MLS as Distributed by MLS Grid
Cash-flow waterfall
monthlySold comps — $/sqft
last 12 mo · ≤1 miLoading sold comps…