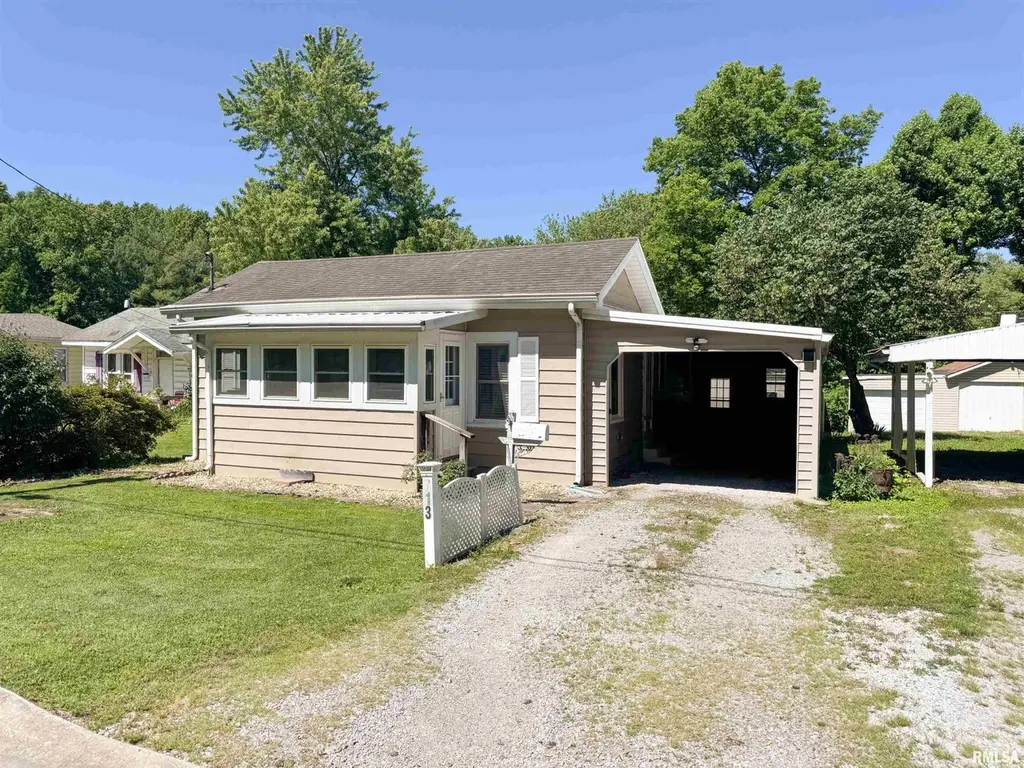
713 N 23rd St · Murphysboro, IL
Flood risk 1/10 · Minimal
- FEMA flood zone
- X (unshaded)
- Chance of flooding over 30 yrs
- 0.0%
- Est. flood insurance / yr
- $507 – $1,088
Fire risk 1/10 · Minimal
- Est. fire insurance / yr
- $804 – $1,492
Heat risk 5/10 · Moderate
- Hot days now (above 107°F)
- 7 days/yr
- Hot days in 30 yrs
- 21 days/yr
Wind risk 2/10 · Minimal
- Chance of severe wind over 30 yrs
- 2.0%
Air-quality risk 2/10 · Minimal
- Unhealthy air days now
- 0 days/yr
- Unhealthy air days in 30 yrs
- 2 days/yr
Risk factors via First Street. Map © Google.
Why this score? — see what drove the D grade
The composite is a weighted blend of 9 inputs, each scored 0–100. Each bar is that input's sub-score; the figure is the points it added to the 100-point composite (weight × sub-score).
- Cash flow +18.5/30.0
- ARV discount +7.5/15.0
- DSCR +5.8/10.0
- 1% rule +3.7/10.0
- Livability +2.7/5.0
- Rent growth +2.5/5.0
- Condition / age +2.5/5.0
- Schools +0.8/10.0
- Appreciation +0.0/10.0
$95,000
🖨 Deal sheet (PDF) 📄 Offer letter ✓ Due diligence
Listing remarks
Move right into this well-maintained 3-bedroom, 1-bath home that offers comfort, convenience, and pride of ownership throughout. The kitchen and dining areas feature new vinyl flooring, and the carpets have been freshly cleaned, making the home truly move-in ready. All appliances will stay with the property, providing added value and convenience for the new owner. Outside, you'll find a fully fenced backyard, perfect for pets, play, or entertaining. A spacious 12' x 16' shed with a covered porch offers excellent storage, workspace, or a relaxing spot to enjoy the outdoors. There is also an attached carport for added convenience getting in the house and protection for your vehicle. This char
Key facts
- Spacious shed
- New vinyl flooring
- 7,050 sq ft lot
Tags
Property features AI
Exterior
- Parking: Attached carport
- Utilities: Public water; Public sewer
- Home design: Single-family residence; Built in 1952
- Construction: Shingle roof; Not new construction
- Exterior features: Shed(s)
Interior
- Kitchen: Kitchen with Luxury Vinyl Plank flooring; Dishwasher, Microwave, Refrigerator
- Bedrooms: 3 bedrooms (all on the main level)
- Flooring: Carpet in bedrooms and living areas; Luxury Vinyl Plank in kitchen
- Bathrooms: 1 full bathroom
- Heating & cooling: Central air conditioning; Electric forced-air heating; Electric water heater
- Interior features: Ceiling fan(s); Dishwasher; Microwave; Refrigerator
Neighborhood map
What this means for you Summary
Snapshot
- This is a 1-bed/1.0-bath single-family listed at $95k.
Deal economics
- At list price, monthly cash flow is $90 ($1k/yr) — positive.
- The deal already cash-flows at list — no discount required.
- To meet the 1% rule (rent ≥ 1% of price), the offer needs to be $82k (13.2% below list).
- Recommended offer: $82k (13.2% below list) — sets the bar for 1% rule.
Location & tenants
- Location reads 54/100 on livability (#1,265 in IL) — a working-class tenant base; expect higher turnover. Strengths: cost of living A+, housing A-; Watch: crime D-, amenities F, commute F.
- Murphysboro CUSD 186 (town): math 9% / reading 10% proficiency, ranked #585 of 620 in IL (top 94%) — low school quality limits family demand, transient renter base, plan for 1-2y turnover; 62% free/reduced lunch — lower-income household profile, screen leases tightly.
- Zoned schools: Carruthers Elementary School (math 11% / reading 11%, grade F, #1,460 of 2,056 statewide, top 72%, 406 students, 0% FRL); Murphysboro Middle School (math 4% / reading 6%, grade F, #636 of 665 statewide, top 98%, 444 students, 0% FRL); Murphysboro High School (math 17% / reading 17%, grade F, #430 of 693 statewide, top 66%, 598 students, 0% FRL) — zoned schools average 0% FRL vs 62% district-wide (62 pts lower); this property's tenant base skews higher-income than the district average.
- Market conditions: 81 active listings in the ZIP; 1 comparable units currently listed for rent nearby; 5 units permitted in Jackson County in 2024 (0 in 5+ unit buildings).
Forward outlook
- Local home prices are declining (-3.0%/yr); year-one equity from $657 of loan paydown is wiped out by about $3k of value loss. Plan a longer hold.
Negotiation context
- It's been on market 18 days — a 2% lower offer ($94k) is reasonable based on typical stale-listing flexibility.
Risks & watch-outs
- Watch-outs: built in 1952 — expect roof / HVAC / electrical / plumbing capex.
- Climate carrying-cost: extreme-heat days projected 7→21/yr by 2055 (HVAC capex compounding) — expect insurance premiums to compound above CPI over the hold.
Questions for the listing agent
- Built in 1952 — when were the roof, HVAC, electrical panel, plumbing, and water heater last replaced?
- Is there a deadline driving the sale (1031 exchange, divorce, estate, relocation)? That informs how much negotiation room exists.
- Schools are F-rated, which usually means shorter tenancies and higher turnover. Who's the typical renter profile here, and what's been the actual vacancy rate?
- Crime grade is D in this area — have there been break-ins, vandalism, or insurance claims at this property in the last 3 years? What carrier currently insures it and at what premium?
- The area grade is low — what's the realistic commute time and amenity access for the typical tenant pool here? Any planned neighborhood developments (good or bad) we should know about?
- What's the average days-on-market for RENTAL listings here right now (not sales)? A rising rental-DOM trend means longer vacancies and softer asking-rent achievability than the comps imply.
- What's the recent tenant-quality profile in this submarket — average credit score on applications, eviction rate, late-payment / NSF rate, and stable-employment percentage? A property-management company in the area should have these aggregated.
- How much new for-sale + rental construction is in the pipeline within 1–3 miles? Heavy new supply typically softens prices + rents 12–24 months out; constrained supply supports both.
Investment metrics
- 1% rule
- 0.87% ✗
- Cap rate
- 7.43%
- Cash-on-cash
- 4.06%
- DSCR
- 1.18
- GRM
- 9.6
CMA / ARV
- ARV (on-the-fly)
- $49,680
- Comps found
- 12
Show comp detail 12 sales within ~0.75 mi
| Address | Dist | Beds/Ba | Sqft | Sold | Price | $/sf | Match |
|---|---|---|---|---|---|---|---|
| 2119 Herbert St | 0.17mi | 2/1.0 (+1) | 1,100 (+2%) | 22mo | $51,000 | $46 | 65 |
| 2119 Herbert St | 0.17mi | 2/1.0 (+1) | 1,100 (+2%) | 22mo | $51,000 | $46 | 65 |
| 2142 Gartside St | 0.16mi | 2/1.5 (+1) | 1,012 (-6%) | 14mo | $93,000 | $92 | 64 |
| 2142 Gartside St | 0.16mi | 2/1.5 (+1) | 1,012 (-6%) | 14mo | $93,000 | $92 | 64 |
| 2130 Rains St | 0.32mi | 2/2.0 (+1) | 1,026 (-5%) | 5mo | $22,053 | $21 | 63 |
| 2010 Elm St | 0.41mi | 2/1.0 (+1) | 1,020 (-6%) | 9mo | $45,000 | $44 | 60 |
| 2010 Elm St | 0.41mi | 2/1.0 (+1) | 1,020 (-6%) | 9mo | $45,000 | $44 | 60 |
| 2129 Logan | 0.30mi | 2/2.0 (+1) | 1,200 (+11%) | 5mo | $95,000 | $79 | 54 |
| 1520 Gartside St | 0.63mi | 2/1.0 (+1) | 980 (-9%) | 1mo | $100,000 | $102 | 49 |
| 1938 Pine St | 0.49mi | 2/1.0 (+1) | 1,200 (+11%) | 14mo | $79,500 | $66 | 42 |
| 1502 Gartside St | 0.67mi | 2/1.0 (+1) | 1,200 (+11%) | 7mo | $55,000 | $46 | 40 |
| 1502 Gartside St | 0.67mi | 2/1.0 (+1) | 1,200 (+11%) | 7mo | $55,000 | $46 | 40 |
Match score weights: distance 35% · size 25% · config 20% · recency 20%. Top-matched comps best support the ARV.
Projected returns pro-forma
-3.0% appreciation · 3.0% rent growth · sell at horizon
- IRR
- -10.0%
- Equity multiple
- 0.63×
- Total profit
- $-9,713
- Equity at exit
- $14,165
- IRR
- -0.7%
- Equity multiple
- 0.95×
- Total profit
- $-1,270
- Equity at exit
- $8,214
Cash invested: $26,600 (down + closing). Projections, not guarantees.
Landlord ↔ Tenant lean methodology
- Overall (STATE)
- 43 Moderately Tenant-Leaning
- State Illinois
- 43 Moderately Tenant-Leaning · D+7
- County
- — inherits STATE
- City
- — inherits STATE
ZIP-level market 62966
- Active inventory
- 81
- Price-to-rent
- 9.6×
Monthly cashflow live
- Estimated rent
- $825 medium interval (Pro) →
- Mortgage (P&I)
- −$498
- Tax from tax record
- −$24 /mo · $289/yr
- Insurance
- −$40
- HOA
- −$0
- Vacancy / Maint / Mgmt
- −$173
- Net cashflow
- $90
Break-even live
Sensitivity live
| Price | -10% $144 | -5% $117 | +0% $90 | +5% $63 | +10% $36 |
|---|---|---|---|---|---|
| Rent | -10% $25 | -5% $57 | +0% $90 | +5% $123 | +10% $155 |
| Rate | -1.0pp $138 | -0.5pp $114 | base $90 | +0.5pp $65 | +1.0pp $40 |
UW: 25.0% down · 7.5% · 30yr · 1.5% tax · 5.0% vac · 8.0% maint · 8.0% mgmt
Financing live
Cash to close
- Down payment
- $23,750
- Closing costs
- $2,850
- Reserves months
- —
- Total cash needed
- —
Loan-product check · same deal, 3 products live
Conventional
25% down · 7.5% · 30yr
- Down + closing
- —
- Monthly P&I
- —
- Monthly cashflow
- —
- DSCR
- —
- Eligible?
- —
Personal DTI + credit; lowest rate.
DSCR
20% down · 8.5% · 30yr
- Down + closing
- —
- Monthly P&I
- —
- Monthly cashflow
- —
- DSCR
- —
- Eligible?
- —
No personal income docs; deal must DSCR.
Hard money
10% down · 12.0% · 12mo
- Down + closing
- —
- Monthly P&I
- —
- Monthly cashflow
- —
- DSCR
- —
- Eligible?
- —
Short-term bridge; refi at stabilization.
Rent comps 1 comps
| Address | Beds | Baths | Sqft | Rent | $/sqft | DOM | Units | Dist |
|---|---|---|---|---|---|---|---|---|
| 502 Lucier St Murphysboro, IL | 2.0 | 1.0 | 988 | $825 | $0.84 | 45d | 1 | 1.23mi |
Listing history 14 events
-
2026-06-22days on market $95,000 Active 18 DOM
-
2026-06-19days on market $95,000 Active 15 DOM
-
2026-06-18days on market $95,000 Active 14 DOM
-
2026-06-17days on market $95,000 Active 13 DOM
-
2026-06-16days on market $95,000 Active 12 DOM
-
2026-06-15days on market $95,000 Active 11 DOM
-
2026-06-14days on market $95,000 Active 9 DOM
-
2026-06-13days on market $95,000 Active 8 DOM
-
2026-06-10days on market $95,000 Active 6 DOM
-
2026-06-09days on market $95,000 Active 5 DOM
-
2026-06-09days on market $95,000 Active 4 DOM
-
2026-06-07days on market $95,000 Active 3 DOM
-
2026-06-05remarks 699-char remark
-
2026-06-05$95,000 Active 1 DOM
ⓘ Source: listings_history table (triggers on properties + properties_extension) + one-shot
backfill from property_details.listing_events for pre-trigger history.
Tax reassessment forecast IL · Partial reset (capped growth)
- Current annual tax
- $289 · $24/mo
- Projected year-2 tax
- $1,223 · $102/mo
- Expected delta
- +$934/yr (+$78/mo · 323.4%)
ⓘ Screening estimate from a state-policy table — verify with the county assessor before closing.
Climate risk First Street
- Flood 1/10 Low FEMA zone X (unshaded) · 0% chance over 30 yrs
- Wildfire 1/10 Low
- Heat 5/10 Major 7 d/yr ≥107°F today · 21 d/yr by 30 yrs out
- Wind 2/10 Low 2% chance of damaging wind over 30 yrs
- Air quality 2/10 Low 0 unhealthy d/yr today · 2 by 30 yrs out
Nearby sold comps map
Loading sold comps map…
Walkable amenities ~0.75 mi
Loading nearby amenities…
Taxation est. · year 1
- Rental income
- $9,900
- − Mortgage interest
- −$5,321
- − Property taxes
- −$289
- − Insurance
- −$475
- − Repairs & maintenance
- −$792
- − Management
- −$792
- − Depreciation
- −$2,764
- Taxable loss
- −$533
- Est. tax savings @ 24.0%
- +$128
- After-tax cash flow
- $1,207/yr
For passive investors: Depreciation is non-cash, so a rental often shows a tax loss while cash-flowing — sheltering income. Rental losses are passive: they offset passive income freely, and up to $25,000/yr can offset ordinary (W-2) income if you actively participate and your MAGI is under $100k (phasing out to $0 by $150k); unused losses carry forward. On sale, claimed depreciation is recaptured at up to 25%, and gains may owe capital-gains tax (a 1031 exchange can defer both). Figures are a year-1 estimate at your 24.0% rate — not tax advice; consult a CPA.
Schools (NCES district)
- District
- Murphysboro CUSD 186
- NCES district ID
- 1727610
- Math proficiency
- 9% ▼ -9.00%
- Reading proficiency
- 10% ▼ -8.00%
- Median HH income
- $36,963
- Composite
- 7.97/100
- National rank
- #9925
- State rank
- #585 of 620 in IL
Livability — Murphysboro
- Score
- 54/100
- State rank
- #1265
- US rank
- #23786
Category grades
Schools grade is shown separately in the Schools card above.
Census & demographics
- Census place
- Murphysboro, IL
- City population
- 13,995
- Population (ZIP)
- 13,995
Population outlook (Jackson County) Hauer SSP2
- Today (2025)
- 59,093 people
- By 2030
- 59,628 · +0.9%
- By 2040
- 59,495 · +0.7%
- By 2050
- 58,811 · -0.5%
- By 2075
- 57,683 · -2.4%
- By 2100
- 55,337 · -6.4%
Race, ethnicity, and origin ACS 2023
- Neighborhood character
- Predominantly White (77%)
- Race & ethnicity
- White 77% Hispanic / Latino 8% Black 8% Two or more races 6%
- Hispanic origin (detail)
- Mexican 3% Puerto Rican 1%
- Common ancestry
- Lithuanian 5% Slovak 3% Italian 2%
- Foreign-born
- 4% · Canada, South Korea
- Languages at home
- 91% English-only · Spanish 6% Russian/Polish/Slavic 1%
Political lean MEDSL · Jackson
- 2024 margin
- Toss-up / Even · D 51.0% · R 47.5% · Other 1.4%
- 2008→2024 swing
- -18.3pp toward R · 2008: 21.8pp · 2024: 3.5pp
- All cycles
- 2024: D+3.5 2020: D+1.3 2016: D+3.0 2012: D+10.3 2008: D+21.8
Not yet ingested
- Civics
- —
Market trends
- HPI YoY
- ▼ -76.39%
- Current HPI
- 95.9393
- Rent YoY
- —
- Metro
- —
- State GDP YoY
- ▲ 1.59%
- F500 in state
- 60
Industry mix (Fortune 500 HQ in IL)
| Industry | F500 HQs | Revenue |
|---|---|---|
| Insurance | 4 | $201B |
|
||
| Consumer Goods | 4 | $87B |
|
||
| Industrial Machinery | 3 | $64B |
|
||
| Healthcare | 2 | $55B |
|
||
| Retail / Pharmacy | 1 | $148B |
|
||
| Agriculture / Food | 1 | $86B |
|
||
Price history
1 event — show timeline
- 2026-06-04 Listed $95,000 RMLSA as Distributed by MLS Grid
Property tax history
+0.3%/yrLatest (2024): $289 · -5.9% YoY. Source: county tax records.
Cash-flow waterfall
monthlySold comps — $/sqft
last 12 mo · ≤1 miLoading sold comps…