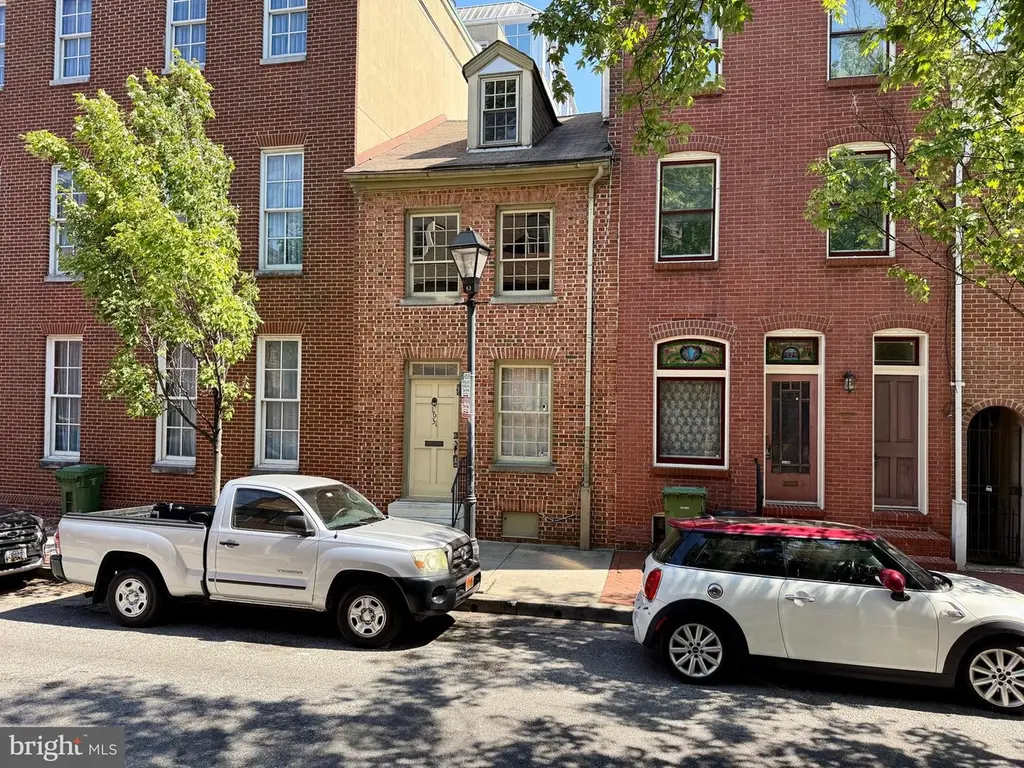
1631 Shakespeare St · Baltimore, MD
Flood risk 6/10 · Moderate
- FEMA flood zone
- X (unshaded)
- Chance of flooding over 30 yrs
- 0.56%
- Est. flood insurance / yr
- $507 – $1,088
Fire risk 1/10 · Minimal
- Est. fire insurance / yr
- $755 – $1,403
Heat risk 8/10 · Major
- Hot days now (above 103°F)
- 7 days/yr
- Hot days in 30 yrs
- 15 days/yr
Wind risk 6/10 · Moderate
- Chance of severe wind over 30 yrs
- 27.0%
Air-quality risk 4/10 · Minor
- Unhealthy air days now
- 6 days/yr
- Unhealthy air days in 30 yrs
- 7 days/yr
Risk factors via First Street. Map © Google.
Why this score? — see what drove the B grade
The composite is a weighted blend of 9 inputs, each scored 0–100. Each bar is that input's sub-score; the figure is the points it added to the 100-point composite (weight × sub-score).
- Cash flow +28.8/30.0
- ARV discount +15.0/15.0
- DSCR +10.0/10.0
- 1% rule +8.5/10.0
- Livability +3.8/5.0
- Rent growth +3.1/5.0
- Condition / age +2.5/5.0
- Schools +1.0/10.0
- Appreciation +0.0/10.0
$229,900
🖨 Deal sheet 📄 Offer letter ✓ Due diligence
Listing remarks
First time offered in nearly 50 years! Nestled on one of Historic Fells Point's most coveted streets, this classic brick rowhome offers a rare opportunity in an exceptional location just steps from the waterfront promenade, Broadway Square, acclaimed restaurants, charming shops, neighborhood pubs, and all the character that makes Fells Point one of Baltimore's most beloved destinations. Features include a Flemish brick façade, 3 bedrooms, 1 full bath, natural gas forced air heat, and a private rear patio that serves as a quiet urban oasis. Functional but requiring substantial renovation and updating, this property offers tremendous potential for investors and experienced renovators s
Key facts
- Built 1850
- Listed 11 days
Property features AI
Finance
- Other: Finished above-grade area: 1,668; Year built source: Assessor; Ownership interest: Fee Simple
Exterior
- Parking: On-street parking
- Utilities: Public water; Public sewer; Electric cooling fuel; Natural gas heating and hot water
- Home design: Interior townhouse/rowhouse; Fee simple ownership
- Construction: Brick construction; Crawl space foundation; Above-grade and below-grade structures
- Exterior features: Property located within city limits; Directions: Broadway to Shakespeare
Interior
- Kitchen: Kitchen
- Bedrooms: Two bedrooms on the first upper level; One bedroom on the second upper level
- Bathrooms: One full bathroom on the main level; One full bathroom total
- Heating & cooling: Forced air heating (natural gas); Window cooling units (electric)
- Interior features: Open living area; No basement
- Laundry & utility: Hot water: natural gas
Neighborhood map
What this means for you Summary
Snapshot
- This is a 3-bed/1.0-bath townhouse listed at $230k.
Deal economics
- At list price, monthly cash flow is $774 ($9k/yr) — positive.
- The deal already cash-flows at list — no discount required.
- Meets the 1% rule at list price ($3k rent vs $230k).
- Cap rate 10.3% vs local median 6.0% in Baltimore — top-decile yield for the area; either an underpriced asset or a hidden risk that comps aren't pricing in. Stress-test before assuming the spread holds.
Location & tenants
- Location reads 76/100 on livability (#90 in MD, #3,396 nationally) — a middle-class / working-renter tenant base. Strengths: amenities A+, commute A+, housing A+; Watch: schools D, crime F.
- Baltimore City Public Schools (urban): math 7% / reading 16% proficiency, ranked #24 of 24 in MD (top 100%) — low school quality limits family demand, transient renter base, plan for 1-2y turnover; 79% free/reduced lunch — lower-income household profile, screen leases tightly.
- Market conditions: Rents rising (+2.3%/yr); 131 active listings in the ZIP; 40 comparable units currently listed for rent nearby; rentals at typical pace (median 24d on market — plan ~3-4 weeks tenant-placement turnaround); 42% of comp listings sitting > 30 days — soft ceiling on asking rent; solid renter incomes; 1,273 units permitted in Baltimore city in 2024 (1,104 in 5+ unit buildings).
- This rent runs 44% of the median local income ($85k/yr) — at the standard rent-burdened threshold; future hikes will face affordability resistance.
Forward outlook
- Local home prices are declining (-3.0%/yr); year-one equity from $2k of loan paydown is wiped out by about $7k of value loss. Plan a longer hold.
- Baltimore County population projected to shrink 4% by 2050 — rents likely to lag national; underwrite the cash flow, not the appreciation.
- At projected returns (-3.0% appreciation + 2.3% rent growth), your $64k cash investment doubles in ~9 years — after that, you're playing with house money.
Negotiation context
- Only 11 days on market — expect competitive offers; lowballing is unlikely to land.
Risks & watch-outs
- Watch-outs: built in 1850 — expect roof / HVAC / electrical / plumbing capex.
- Climate carrying-cost: major flood risk; major wind risk, 27% chance of damaging wind over 30y; extreme-heat days projected 7→15/yr by 2055 (HVAC capex compounding) — expect insurance premiums to compound above CPI over the hold.
Questions for the listing agent
- Built in 1850 — when were the roof, HVAC, electrical panel, plumbing, and water heater last replaced?
- Is there a deadline driving the sale (1031 exchange, divorce, estate, relocation)? That informs how much negotiation room exists.
- Schools are D-rated, which usually means shorter tenancies and higher turnover. Who's the typical renter profile here, and what's been the actual vacancy rate?
- Crime grade is F in this area — have there been break-ins, vandalism, or insurance claims at this property in the last 3 years? What carrier currently insures it and at what premium?
- What's the average days-on-market for RENTAL listings here right now (not sales)? A rising rental-DOM trend means longer vacancies and softer asking-rent achievability than the comps imply.
- What's the recent tenant-quality profile in this submarket — average credit score on applications, eviction rate, late-payment / NSF rate, and stable-employment percentage? A property-management company in the area should have these aggregated.
- How much new for-sale + rental construction is in the pipeline within 1–3 miles? Heavy new supply typically softens prices + rents 12–24 months out; constrained supply supports both.
Investment metrics
- 1% rule
- 1.35% ✓
- Cap rate
- 10.33%
- Cash-on-cash
- 14.43%
- DSCR
- 1.64
- GRM
- 6.2
CMA / ARV
- ARV (on-the-fly)
- $406,992
- Comps found
- 12
Show comp detail 12 sales within ~0.75 mi
| Address | Dist | Beds/Ba | Sqft | Sold | Price | $/sf | Match |
|---|---|---|---|---|---|---|---|
| 1400 Lancaster St #901 | 0.17mi | 2/2.5 (-1) | 1,781 (+7%) | 1mo | $629,000 | $353 | 69 |
| 1330 Lancaster St Unit C603 | 0.24mi | 2/2.0 (-1) | 1,550 (-7%) | 0mo | $985,000 | $635 | 68 |
| 1400 Lancaster St #303 | 0.17mi | 2/2.5 (-1) | 1,539 (-8%) | 1mo | $425,000 | $276 | 67 |
| 1330 Lancaster St Unit C402 | 0.24mi | 2/2.0 (-1) | 1,429 (-14%) | 0mo | $775,000 | $542 | 56 |
| 1822 E Lombard St | 0.63mi | 3/1.5 | 1,830 (+10%) | 1mo | $289,000 | $158 | 52 |
| 307 S Exeter St | 0.48mi | 2/2.0 (-1) | 1,497 (-10%) | 0mo | $362,900 | $242 | 51 |
| 509 S Collington Ave S | 0.50mi | 3/2.0 | 1,451 (-13%) | 1mo | $250,000 | $172 | 50 |
| 2529 Fleet St | 0.75mi | 2/3.0 (-1) | 1,656 (-1%) | 1mo | $325,000 | $196 | 50 |
| 411 S Chester St | 0.49mi | 2/2.0 (-1) | 1,491 (-11%) | 1mo | $360,000 | $241 | 50 |
| 219 S Washington St | 0.54mi | 3/2.0 | 1,434 (-14%) | 0mo | $350,000 | $244 | 47 |
| 317 S Collington | 0.57mi | 3/2.5 | 1,440 (-14%) | 1mo | $365,000 | $253 | 44 |
| 14 N Wolfe St N | 0.74mi | 2/2.0 (-1) | 1,424 (-15%) | 1mo | $292,000 | $205 | 32 |
Match score weights: distance 35% · size 25% · config 20% · recency 20%. Top-matched comps best support the ARV.
Projected returns pro-forma
-3.0% appreciation · 2.26% rent growth · sell at horizon
- IRR
- 4.0%
- Equity multiple
- 1.15×
- Total profit
- $9,868
- Equity at exit
- $34,279
- IRR
- 12.8%
- Equity multiple
- 1.98×
- Total profit
- $63,229
- Equity at exit
- $19,878
Cash invested: $64,372 (down + closing). Projections, not guarantees.
Landlord ↔ Tenant lean methodology
- Overall (CITY)
- 12 Strongly Tenant-Friendly
- State Maryland
- 27 Tenant-Leaning · D+14
- County
- — inherits STATE
- City Baltimore
- 12 Strongly Tenant-Friendly · D+58
ZIP-level market 21231
- Rents YoY
- 2.3%
- Active inventory
- 131
- Price-to-rent
- 6.2×
Monthly cashflow live
- Estimated rent
- $3,108 high interval (Pro) →
- Mortgage (P&I)
- −$1,206
- Tax from tax record
- −$380 /mo · $4,558/yr
- Insurance
- −$96
- HOA
- −$0
- Vacancy / Maint / Mgmt
- −$653
- Net cashflow
- $774
Break-even live
UW: 25.0% down · 7.5% · 30yr · 1.5% tax · 5.0% vac · 8.0% maint · 8.0% mgmt
Financing live
Cash to close
- Down payment
- $57,475
- Closing costs
- $6,897
- Reserves months
- —
- Total cash needed
- —
Loan-product check · same deal, 3 products live
Conventional
25% down · 7.5% · 30yr
- Down + closing
- —
- Monthly P&I
- —
- Monthly cashflow
- —
- DSCR
- —
- Eligible?
- —
Personal DTI + credit; lowest rate.
DSCR
20% down · 8.5% · 30yr
- Down + closing
- —
- Monthly P&I
- —
- Monthly cashflow
- —
- DSCR
- —
- Eligible?
- —
No personal income docs; deal must DSCR.
Hard money
10% down · 12.0% · 12mo
- Down + closing
- —
- Monthly P&I
- —
- Monthly cashflow
- —
- DSCR
- —
- Eligible?
- —
Short-term bridge; refi at stabilization.
Rent comps 40 comps
| Address | Beds | Baths | Sqft | Rent | $/sqft | DOM | Units | Dist |
|---|---|---|---|---|---|---|---|---|
| 706 S Bethel St Baltimore, MD | 3.0 | 2.0 | 1500 | $3,300 | $2.20 | 43d | 1 | 0.08mi |
| 622 S Broadway Baltimore, MD | 2.0 | 1.0–2.0 | 953 | $2,998 | $3.14 | 1d | 8 | 0.13mi |
| 1402 Point St Baltimore, MD | 2.0–3.0 | 2.5–3.0 | 1470 | $5,730 | $3.90 | 3d | 3 | 0.20mi |
| 516 S Bethel St Baltimore, MD | 2.0 | 2.0 | 1307 | $2,500 | $1.91 | 23d | 1 | 0.21mi |
| 430 S Bond St Baltimore, MD | 3.0 | 2.5 | 1842 | $2,875 | $1.56 | 17d | 1 | 0.27mi |
| 1000 Fell St #603 Baltimore, MD | 2.0 | 1.0 | 1224 | $2,200 | $1.80 | 44d | 1 | 0.28mi |
| 1001 Aliceanna St Baltimore, MD | 1.0–2.0 | 1.0–2.0 | 844 | $3,081 | $3.65 | 3d | 3 | 0.31mi |
| 1911 Eastern Ave Baltimore, MD | 4.0 | 4.0 | 1520 | $2,600 | $1.71 | 23d | 1 | 0.34mi |
| 2013 Fleet St Baltimore, MD | 3.0 | 2.5 | 1565 | $3,100 | $1.98 | 12d | 1 | 0.36mi |
| 424 S Eden St Baltimore, MD | 4.0 | 3.5 | 1830 | $3,200 | $1.75 | 23d | 1 | 0.36mi |
| 1904 Bank St Baltimore, MD | 3.0 | 3.5 | 1792 | $3,250 | $1.81 | 43d | 1 | 0.40mi |
| 675 President St #1501 Baltimore, MD | 2.0 | 2.0 | 1466 | $5,500 | $3.75 | 43d | 1 | 0.41mi |
| 1802 Gough St Baltimore, MD | 3.0 | 2.0 | 1368 | $2,595 | $1.90 | 43d | 1 | 0.43mi |
| 1816 Gough St Baltimore, MD | 4.0 | 2.0 | 1248 | $3,500 | $2.80 | 23d | 1 | 0.44mi |
| 513 S Chester St Baltimore, MD | 4.0 | 4.5 | 1534 | $3,000 | $1.96 | 17d | 1 | 0.46mi |
| 251 S Durham St Baltimore, MD | 2.0 | 1.5 | 1120 | $2,300 | $2.05 | 23d | 1 | 0.46mi |
| 555 President St Baltimore, MD | 3.0 | 1.0–4.0 | 1352 | $5,373 | $3.97 | 2d | 1 | 0.49mi |
| 2210 Cambridge St Baltimore, MD | 3.0 | 3.5 | 1450 | $2,725 | $1.88 | 43d | 1 | 0.50mi |
| 2217 Fleet St Baltimore, MD | 3.0 | 2.0 | 1598 | $2,700 | $1.69 | 10d | 1 | 0.54mi |
| 301 S President St Unit 1013815P Baltimore, MD | 2.0 | 2.0 | 1097 | $4,999 | $4.56 | 4d | 1 | 0.54mi |
| 1818 E Pratt St Apt A Baltimore, MD | 3.0 | 2.5 | 1736 | $2,500 | $1.44 | 17d | 1 | 0.54mi |
| 513 S Madeira St Baltimore, MD | 2.0 | 2.0 | 1132 | $2,000 | $1.77 | 4d | 1 | 0.54mi |
| 328 S Collington Ave Baltimore, MD | 2.0 | 2.0 | 1100 | $2,300 | $2.09 | 43d | 1 | 0.56mi |
| 411 S Madeira St Baltimore, MD | 2.0 | 2.0 | 1312 | $2,150 | $1.64 | 43d | 1 | 0.58mi |
| 250 President St #403 Baltimore, MD | 2.0 | 2.0 | 1500 | $3,000 | $2.00 | 43d | 1 | 0.59mi |
| 2313 Foster Ave Baltimore, MD | 3.0 | 2.5 | 1974 | $2,900 | $1.47 | 43d | 1 | 0.59mi |
| 122 Lloyd St Baltimore, MD | 2.0 | 2.5 | 1620 | $2,855 | $1.76 | 23d | 1 | 0.60mi |
| 1005 Granby St #187 Baltimore, MD | 2.0 | 2.0 | 1351 | $2,200 | $1.63 | 43d | 1 | 0.61mi |
| 1901 E Lombard St Baltimore, MD | 2.0 | 1.0 | 2054 | $2,200 | $1.07 | 44d | 1 | 0.61mi |
| 100 Harborview Dr #204 Baltimore, MD | 2.0 | 2.0 | 1447 | $3,500 | $2.42 | 12d | 1 | 0.63mi |
| 801 Key Hwy Unit P60 Baltimore, MD | 2.0 | 2.0 | 1864 | $6,500 | $3.49 | 23d | 1 | 0.65mi |
| 825 S Port St Baltimore, MD | 2.0 | 1.5 | 1316 | $2,800 | $2.13 | 43d | 1 | 0.66mi |
| 227 S Madeira St Baltimore, MD | 2.0 | 2.5 | 1100 | $2,200 | $2.00 | 43d | 1 | 0.66mi |
| 1227 Haubert St Baltimore, MD | 2.0 | 2.0 | 1252 | $2,375 | $1.90 | 43d | 1 | 0.67mi |
| 23 Pierside Dr Baltimore, MD | 1.0–2.0 | 1.0–2.0 | 985 | $3,050 | $3.10 | 16d | 3 | 0.71mi |
| 23 Pierside Dr Baltimore, MD | 2.0 | 2.0 | 1205 | $2,975 | $2.47 | 17d | 2 | 0.71mi |
| 23 Pierside Dr Baltimore, MD | 1.0–2.0 | 1.0–2.0 | 975 | $3,050 | $3.13 | 44d | 1 | 0.71mi |
| 104 N Dallas St Baltimore, MD | 3.0 | 2.5 | 1584 | $2,500 | $1.58 | 21d | 1 | 0.74mi |
| 1110 Key Hwy Baltimore, MD | 1.0–2.0 | 1.0–2.5 | 1197 | $3,696 | $3.09 | 1d | 33 | 0.77mi |
| 651 E Clement St Baltimore, MD | 3.0 | 3.5 | 1292 | $2,800 | $2.17 | 43d | 1 | 0.78mi |
Listing history 8 events
-
2026-06-18days on market $229,900 Active 11 DOM
-
2026-06-17days on market $229,900 Active 10 DOM
-
2026-06-16days on market $229,900 Active 9 DOM
-
2026-06-15days on market $229,900 Active 8 DOM
-
2026-06-13days on market $229,900 Active 6 DOM
-
2026-06-09days on market $229,900 Active 2 DOM
-
2026-06-08remarks 692-char remark
-
2026-06-08$229,900 Active 1 DOM
ⓘ Source: listings_history table (triggers on properties + properties_extension) + one-shot
backfill from property_details.listing_events for pre-trigger history.
Tax reassessment forecast MD · Partial reset (capped growth)
- Current annual tax
- $4,558 · $380/mo
- Projected year-2 tax
- $4,558 · $380/mo
- Expected delta
- $0/yr ($0/mo · 0.0%)
ⓘ Screening estimate from a state-policy table — verify with the county assessor before closing.
Climate risk First Street
- Flood 6/10 Major FEMA zone X (unshaded) · 56% chance over 30 yrs
- Wildfire 1/10 Low
- Heat 8/10 Severe 7 d/yr ≥103°F today · 15 d/yr by 30 yrs out
- Wind 6/10 Major 27% chance of damaging wind over 30 yrs
- Air quality 4/10 Moderate 6 unhealthy d/yr today · 7 by 30 yrs out
Nearby sold comps map
Loading sold comps map…
Walkable amenities ~0.75 mi
Loading nearby amenities…
Taxation est. · year 1
- Rental income
- $37,299
- − Mortgage interest
- −$12,878
- − Property taxes
- −$4,558
- − Insurance
- −$1,150
- − Repairs & maintenance
- −$2,984
- − Management
- −$2,984
- − Depreciation
- −$6,688
- Taxable income
- $6,058
- Est. tax owed @ 24.0%
- −$1,454
- After-tax cash flow
- $7,838/yr
For passive investors: Depreciation is non-cash, so a rental often shows a tax loss while cash-flowing — sheltering income. Rental losses are passive: they offset passive income freely, and up to $25,000/yr can offset ordinary (W-2) income if you actively participate and your MAGI is under $100k (phasing out to $0 by $150k); unused losses carry forward. On sale, claimed depreciation is recaptured at up to 25%, and gains may owe capital-gains tax (a 1031 exchange can defer both). Figures are a year-1 estimate at your 24.0% rate — not tax advice; consult a CPA.
Schools (NCES district)
- District
- Baltimore City Public Schools
- NCES district ID
- 2400090
- Math proficiency
- 7% ▼ -9.00%
- Reading proficiency
- 16% ▼ -5.00%
- Median HH income
- $42,108
- Composite
- 10.08/100
- National rank
- #9805
- State rank
- #24 of 24 in MD
Livability — Baltimore
- Score
- 76/100
- State rank
- #90
- US rank
- #3396
Category grades
Schools grade is shown separately in the Schools card above.
Census & demographics
- Census place
- Baltimore, MD
- County
- Baltimore City · 558,601 people
- City population
- 588,727
- Metro
- Baltimore-Columbia-Towson, MD
- Population (ZIP)
- 14,969
- Household income
- $85,254
- Rent vs Own
- Severe rent burden
- 1147.0
Population outlook (Baltimore County) Hauer SSP2
- Today (2025)
- 624,249 people
- By 2030
- 621,541 · -0.4%
- By 2040
- 609,756 · -2.3%
- By 2050
- 597,249 · -4.3%
- By 2075
- 552,236 · -11.5%
- By 2100
- 513,934 · -17.7%
Race, ethnicity, and origin ACS 2023
- Neighborhood character
- Diverse neighborhood (Simpson 0.62)
- Race & ethnicity
- White 53% Black 29% Hispanic / Latino 9% Two or more races 7% Asian 4%
- Hispanic origin (detail)
- Mexican 3% Puerto Rican 1%
- Common ancestry
- Romanian 6% Slovak 2% Lithuanian 2%
- Foreign-born
- 10% · Canada, China, South Korea
- Languages at home
- 85% English-only · Spanish 6% Other Indo-European 2% Russian/Polish/Slavic 1%
Political lean MEDSL · Baltimore
- 2024 margin
- Solid D (+73.0) · D 85.2% · R 12.2% · Other 2.6%
- 2008→2024 swing
- -2.5pp toward R · 2008: 75.5pp · 2024: 73.0pp
- All cycles
- 2024: D+73.0 2020: D+76.6 2016: D+74.6 2012: D+76.4 2008: D+75.5
Not yet ingested
- Civics
- —
Market trends
- HPI YoY
- ▼ -545.26%
- Current HPI
- 351.3778
- Rent YoY
- ▲ 2.26%
- Metro
- Baltimore-Columbia-Towson, MD
- State GDP YoY
- ▲ 2.97%
- F500 in state
- 12
Industry mix (Fortune 500 HQ in MD)
| Industry | F500 HQs | Revenue |
|---|---|---|
| Aerospace / Defense | 1 | $71B |
|
||
| Utilities | 1 | $25B |
|
||
| Hotels | 1 | $24B |
|
||
| Consumer Goods | 1 | $7B |
|
||
| Real Estate | 1 | $6B |
|
||
| Chemicals | 1 | $2B |
|
||
Price history
+0.0% since first listed2 events — show timeline
- 2026-06-08 Listed $229,900 BRIGHT MLS
- 2026-06-08 Coming Soon $229,900 BRIGHT MLS
Property tax history
-3.4%/yrLatest (2025): $4,558 · +4.3% YoY. Source: county tax records.
Cash-flow waterfall
monthlySold comps — $/sqft
last 12 mo · ≤1 miLoading sold comps…